Global warming has gone too far this time, killing God.


Global warming has gone too far this time, killing God.
President Obama allowed countless numbers of honorably discharged veterans to die waiting for healthcare at VA hospitals, but suddenly became very concerned about the health of one deserter – and felt that he needed to release five terrorists who will kill many more people.
Good thing Bergdhal wasn’t waiting for health care at a VA hospital, he probably would have died.
40% of Americans think Obama is doing great.
Barack Obama had Dinesh D’Souza arrested and held on half a million dollars bail over a minor campaign finance violation – saying that they have zero tolerance for law-breakers.
This would be the same Barack Obama who commits massive breaches of the law on an hourly basis.
Here is a stunner.
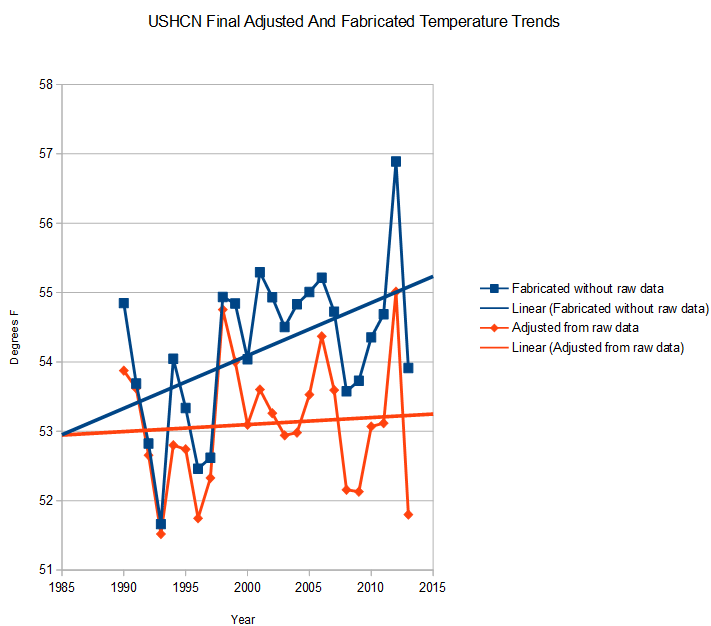
I plotted the USHCN V2.5 adjusted data below, distinguishing between data which was adjusted from raw data (red) and completely fake data (blue.) It turns out that essentially all reported warming since 1990 in the US, is due to fake data manufactured without any underlying thermometer data. The “record warm” year of 2012 was manufactured with two degrees of completely fake data.
Alarmists claim that the adjustments are necessary due to TOBS, etc. – but that isn’t what is producing the warming since 1990. The adjusted data shows almost no warming. The warming comes from fake data.
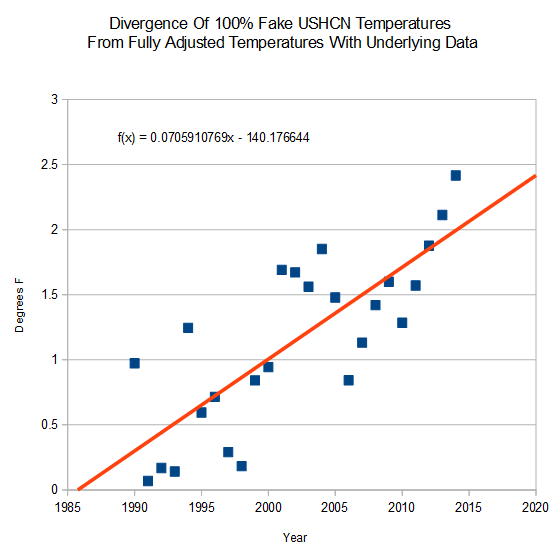
The fake data is diverging from the adjusted data at seven degrees per century.
The biggest scientific fraud in history.
The number of bizarre theories I have heard in recent weeks about what is wrong with my temperature adjustment graphs is incredibly entertaining.
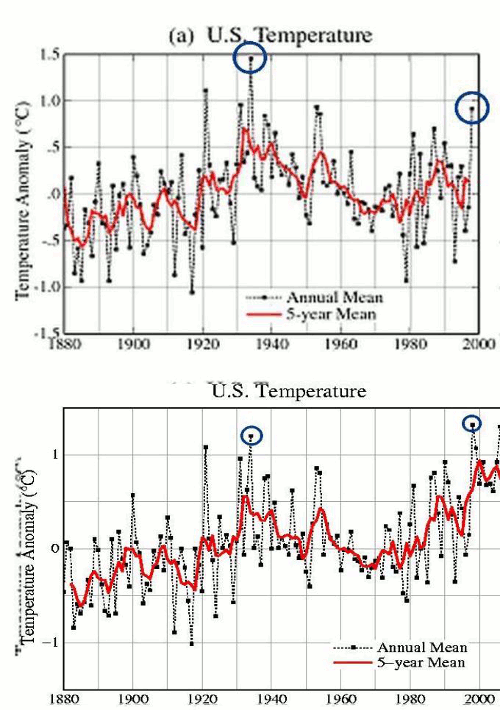
There is nothing wrong with the graphs. The data is being altered. We have known this for years. Hansen shows exactly the same thing I do.
What has brought on this recent wave of mass stupidity?
Amdahl’s Law basically says that you can only improve a system by the fraction of the system you are improving. If you have a section of code which uses up 10% of time of execution of the whole program, the best overall speedup you can produce by changes to that section is 10%.
Similarly, if the US produces 20% of global CO2 emissions in 2020, the largest effect Obama could have by wrecking the US economy is 20%. The only thing the EPA regs do is hurt Americans.
After posting my 40% manufactured data graph the other day, a skeptic sent me this E-mail.
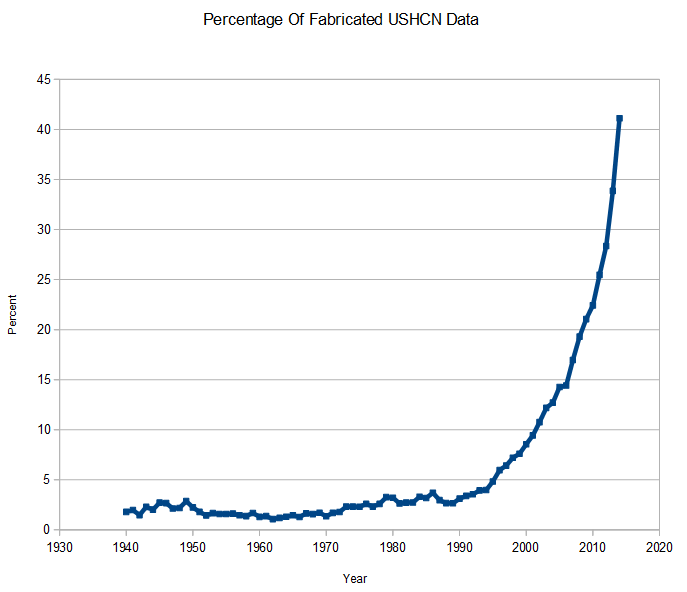
This claim: “More than 40% of USHCN final station data is now generated from stations which have no thermometer data.”
Is utterly bogus.
This kind of unsubstantiated claim is why some skeptics get called conspiracy theorists. If you can’t back it up to show that 40% of the USHCN has stopped reporting, then don’t publish it.
I’d take it down right now if I were you before somebody sees it and calls you out on it.
YOU NEED TO DO BETTER.
This is a very simple concept. The data below is for Troy, Alabama in 2012. There was no station data for January-April (-9999) – so they manufactured it as marked by “E” in the final data.

More than 40% of the current USHCN V2.5 final data now comes in this category.
The data is available here :
Final : ushcn.tavg.latest.FLs.52i.tar.gz
Raw : ushcn.tavg.latest.raw.tar.gz
Skeptics do need to do better, and step up their game.
I was listening to C-Span radio yesterday morning driving to work, and heard something remarkable – an intelligent, articulate, honest politician.
Representative Chris Smith R-NJ was discussing China, and the mind-boggling human rights abuses that go on there. It is country of slaves, with slave labor, forced abortion and no free speech. They have a shortage of 25 million women as a result of government policies, which drives the global sex trafficking market.
He was incredibly articulate and knowledgeable, and ripped Obama a new one for his failure to confront China, and his abuses of power. He would be a great candidate for president, unlike the buffoons the Republicans normally nominate.
A few mathematically illiterate people believe that somehow the use of anomalies would make NCDC data tampering go away. Below are the anomaly and absolute temperature graphs. As you can see, it makes absolutely no difference. All that the use of anomalies does is shift the Y-axis.
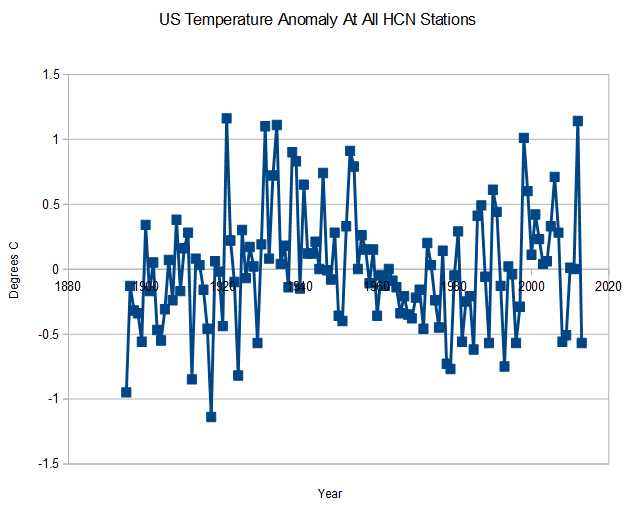
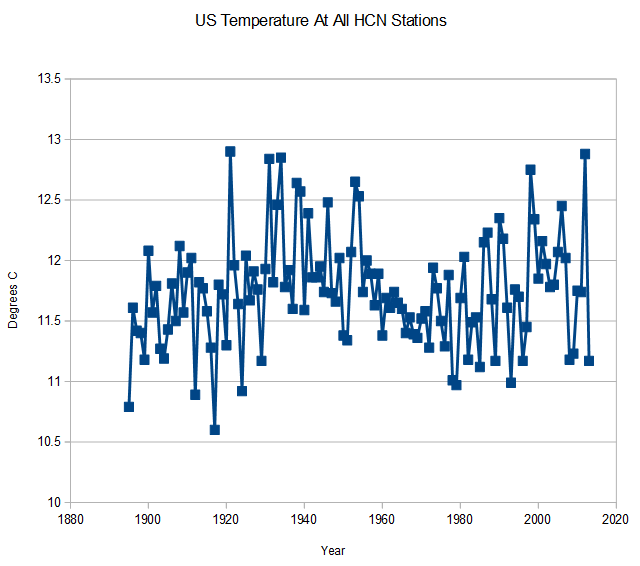
The only reason to use anomalies is if you are comparing different time periods during the year.
Obviously it would make no sense to compare absolute temperatures of January-May 2014 with January-December 1934. But comparing January-May 2014 to January-May 1934 is just fine.
Again, I am happy to debate and humiliate anyone who disagrees with this basic mathematics.
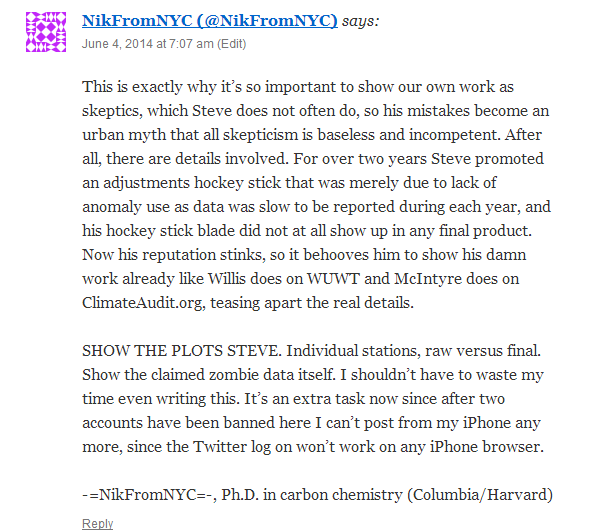
My code is posted online (the ultimate documentation) and only a mathematical idiot would believe that this has anything to do with the use of anomalies or non-anomalies. Subtracting a constant from a linear equation (Ax + B) has no impact on the slope A, which represents the temperature trend. An anomaly is a constant offset. If we change the equation from Ax + B to Ax + B – C, does the slope A change? Of course not.
The only time when the use of anomalies is important is if you are comparing different time periods during the year. Comparing full years or the same time periods during different years does not require or benefit from the use of (imaginary) anomalies.
Nik – how did you get a PhD without understanding middle school math?
My work upsets people on both sides of the debate who have a vested interest in keeping this scam alive. I’m more than happy to debate anyone who disagrees with my results. Bring it on.
I will give Nik credit for challenging me here, which puts him well above a few other people. Nik, go back and tell your whiny friends to debate me here instead of stabbing me in the back.