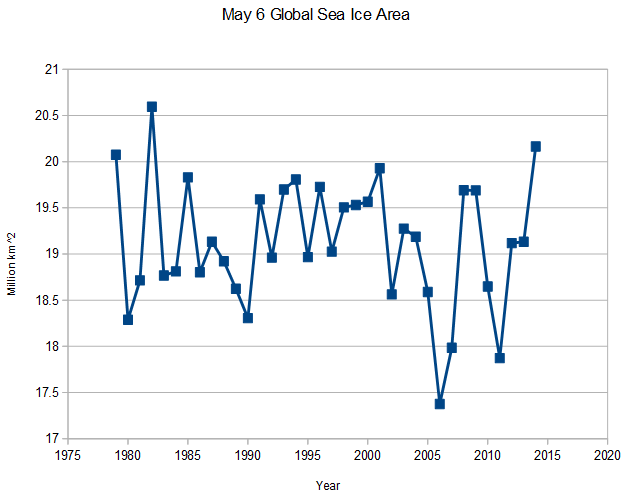
Global sea ice area is expanding rapidly, and is nearing a record high for early May. It is currently the second highest on record for the date, and the highest in 32 years.
 arctic.atmos.uiuc.edu/cryosphere/timeseries.global.anom.1979-2008
Global sea ice area is expanding rapidly, and is nearing a record high for early May. It is currently the second highest on record for the date, and the highest in 32 years.
arctic.atmos.uiuc.edu/cryosphere/timeseries.global.anom.1979-2008
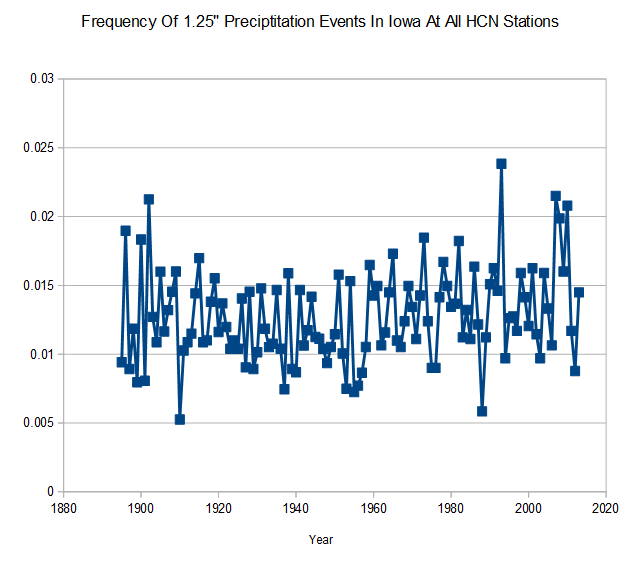
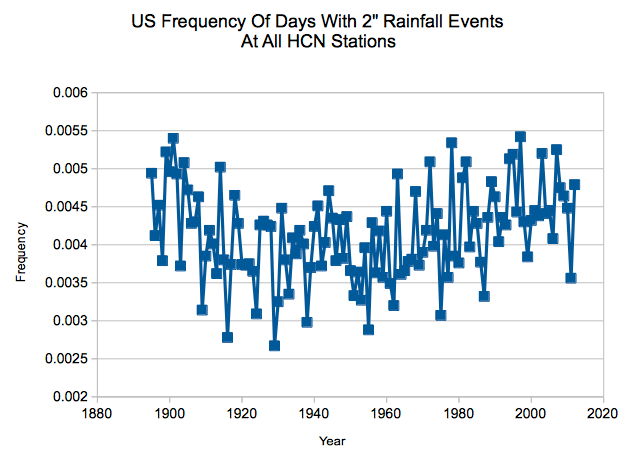
Two inch rainfalls peaked around 1900, and again in the 1990’s. The pattern is an oscillation, not a linear trend.
On a side note, we had more than an inch of rain yesterday, yet the Fort Collins weather station reported 0.00. It looks like their rain gauge is broken.
There is no question that government environmental regulations passed during the 1960’s and 1970’s were essential and very helpful.
I worked to get these regulations passed. Industry would not have cleaned up unless they were forced to.
Since they completed this important work 30 years ago – the bureaucracies have expanded into political activist organizations, and are regulating non-pollutants. They have become a huge problem for the country, and need to be defunded.
The White House failed to mention any of these things.
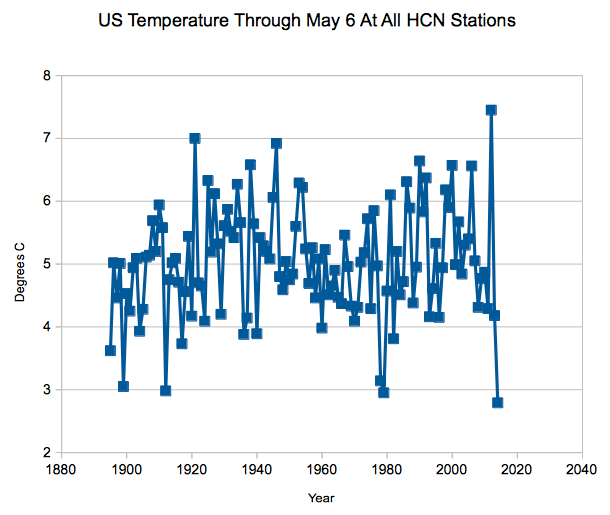
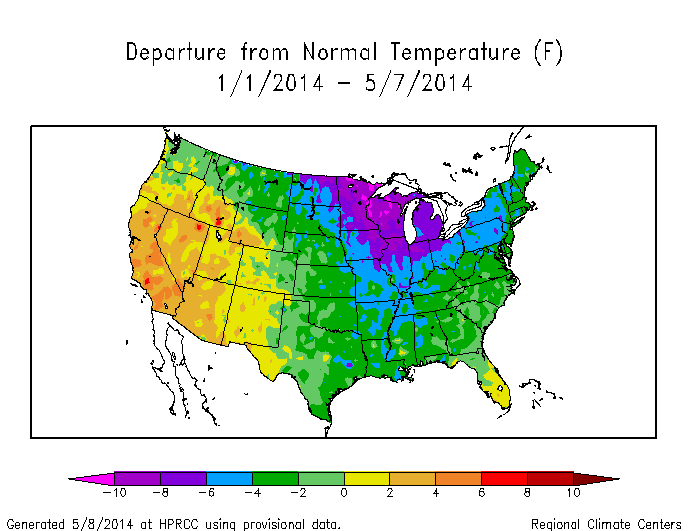
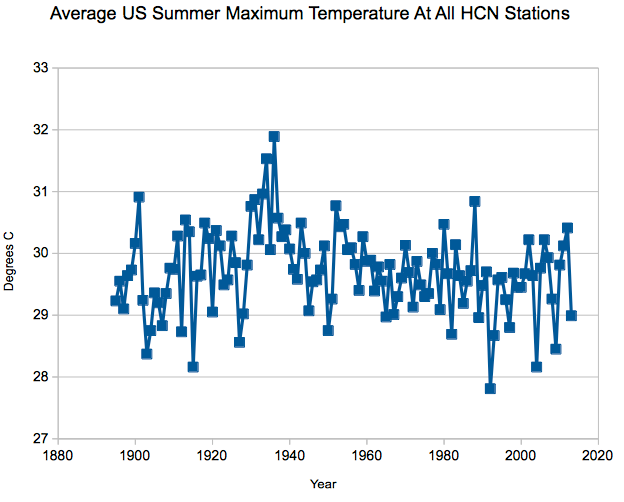
The White House claims that 2012 was the “hottest year on record in the US” based on mild winter/spring temperatures. In fact, summer afternoon temperatures were only 16th hottest, and were much cooler than the 1930’s. They of course didn’t discuss the record cold in 2014, or the summer of 2013 – which was one of the coolest on record.
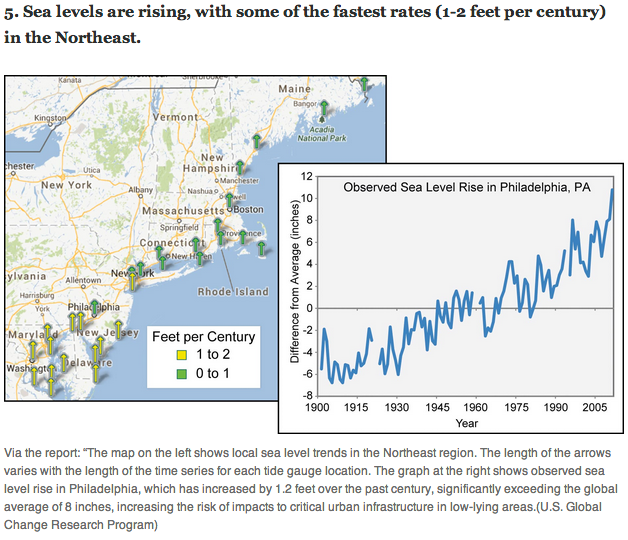
From the White House climate report
The Philadelphia sea level graph shows no acceleration since 1900, destroying their own claim that sea level rise rates have doubled since 1992. And anyone with an IQ higher than a turnip would recognize that sea level can’t rise long term at different rates in different places. The steady Northeast US trend is due to subsidence caused by glacial rebound in Canada. As Canada rises, the Northeast US sinks – like a teeter totter.
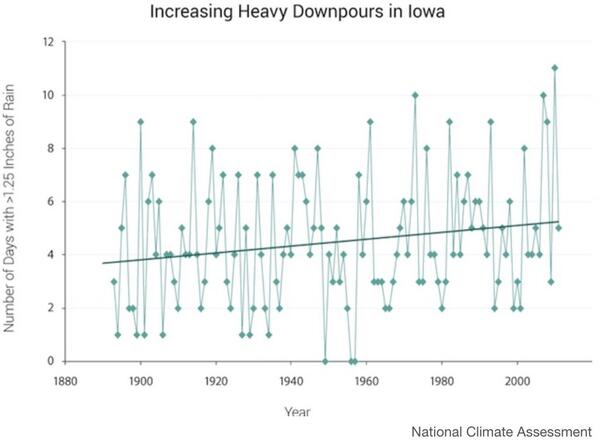
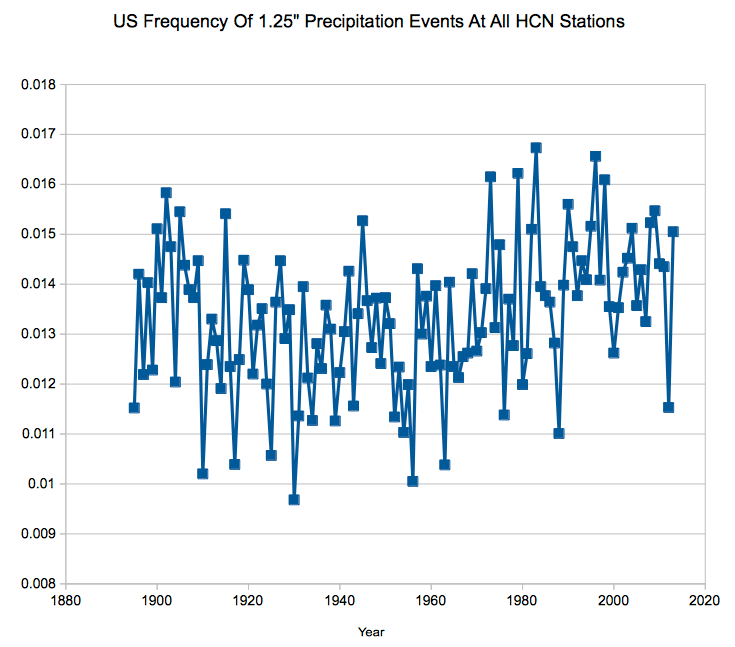
Contrary the the nonsense being spewed by the White House, there is no long term trend in heavy precipitation events in the US. It looks like a sine wave which peaked during the high ENSO years of the 1980’s and 1990’s.
The White House used this graph to make it look like heavy rainfall events are increasing
Here is the actual graph, without the last two years cut off. As usual, the White House is misleading the public. There is no trend.