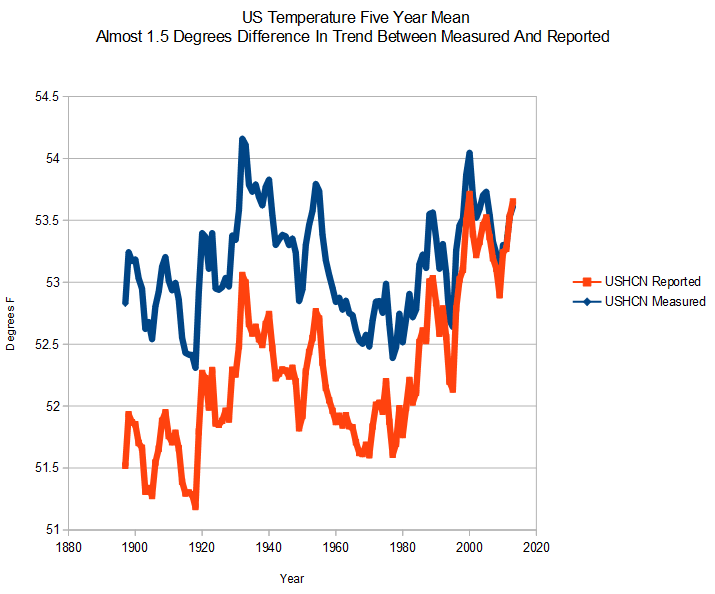
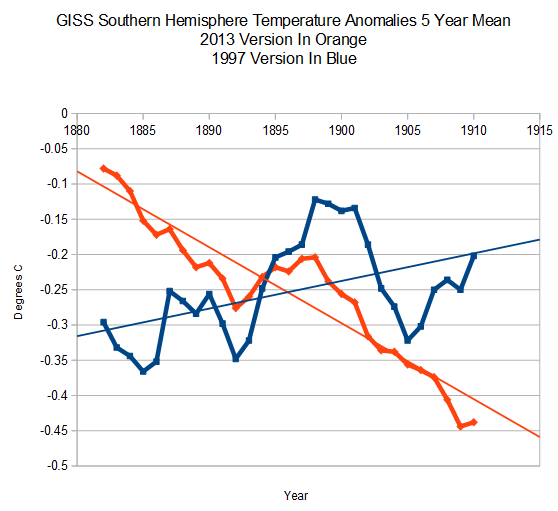
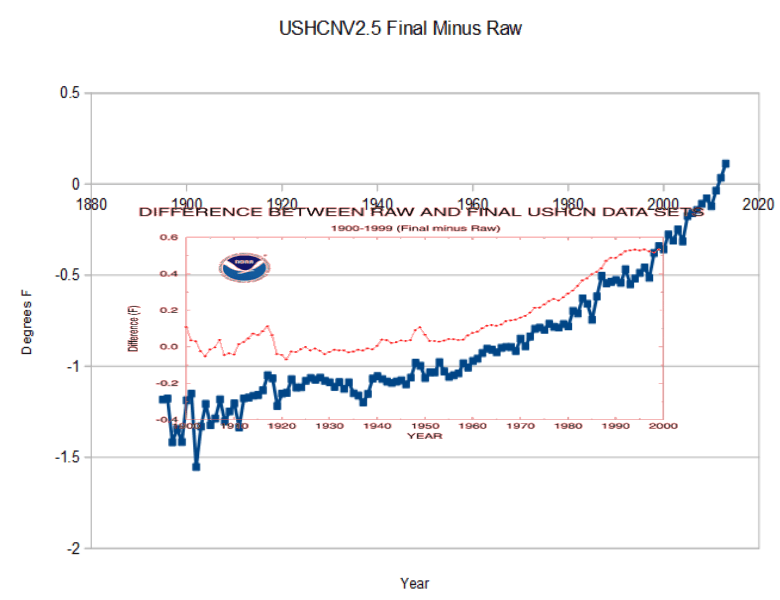
USHCN V1 had 0.5F adjustments, which went flat after 1990. The adjustments were upwards, and primarily after 1960.
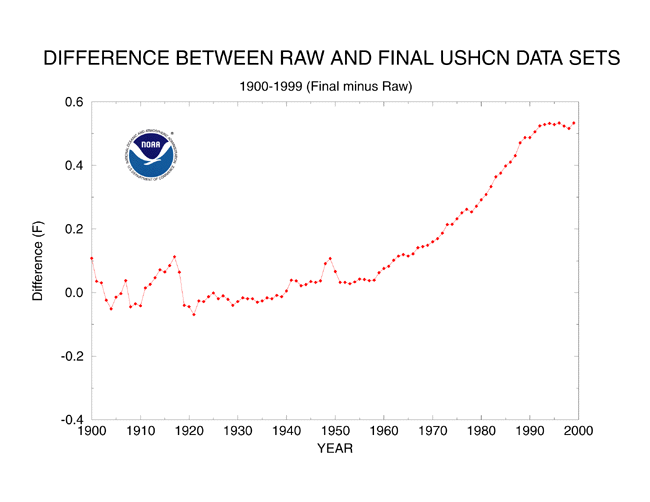
http://www.ncdc.noaa.gov/img/climate/research/ushcn/ts.ushcn_anom25_diffs_urb-raw_pg.gif
In USHCN V2.5 the adjustments are three times as large as V1, mostly downwards, and increase exponentially after 1990 – instead of going flat like in V1.
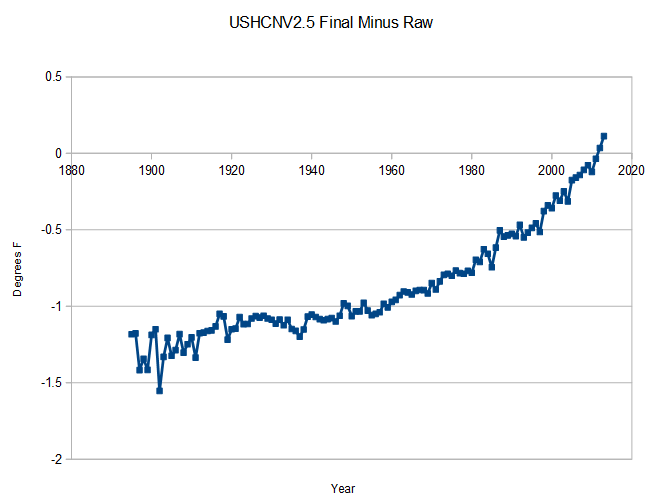
The next graph overlays both. They claim to be using the same TOBS algorithm – which is amazing considering it used to be a positive adjustment, and is now a negative adjustment.
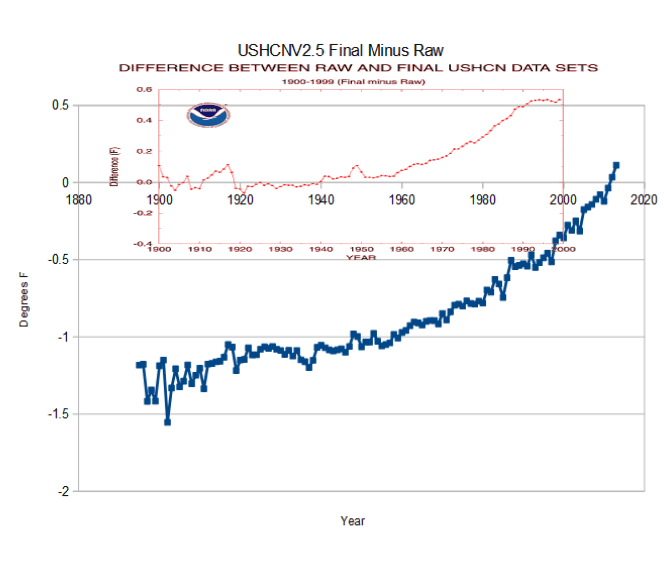
The next image normalizes the two graphs from 1960 to 1997. In this one you can see the massive discontinuity of cheating after 1997.
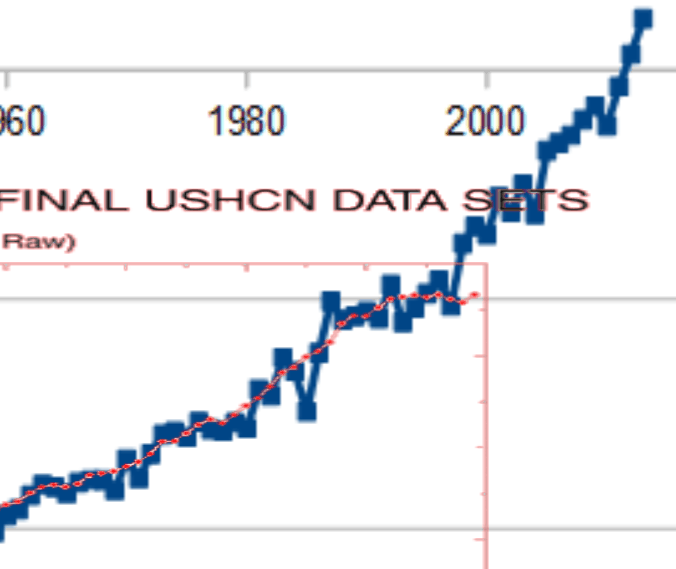
Next image is normalized to 1998/1999 and shows how they cooled the past 0.4F beyond their original V1 data tampering – in addition to all their post-1997 V2 upwards data tampering.
Settled science at its worst.