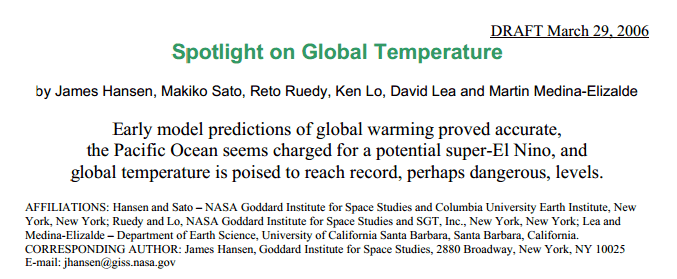
In 1988, Hansen told Congress that Scenario A was “Business As Usual”
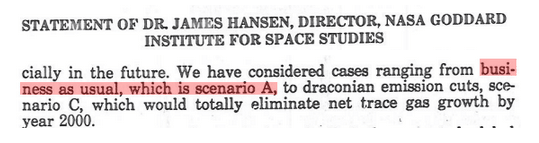
That was a disaster, so 20 years later Hansen claimed that he said something completely different..
Scenario A was described as “on the high side of reality”
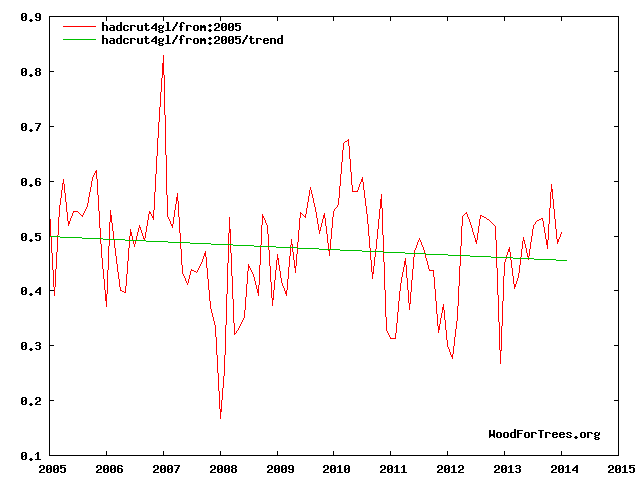
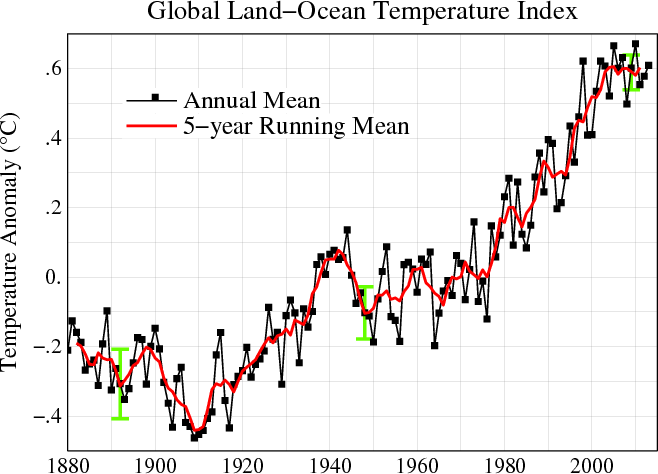
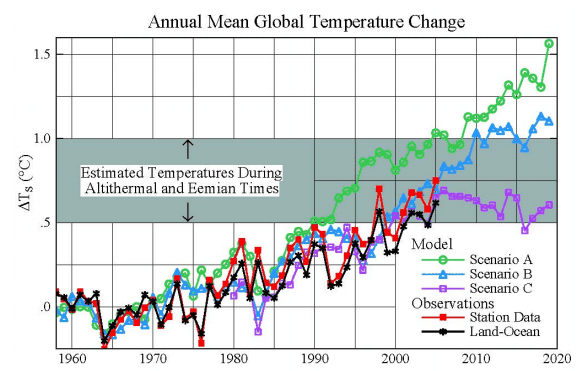
Then he tried to claim that his forecasts were accurate, when in fact they were a complete disaster. This was the graph he published :
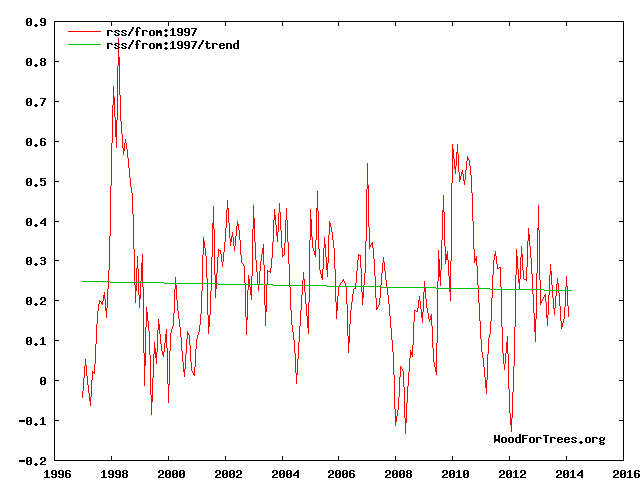
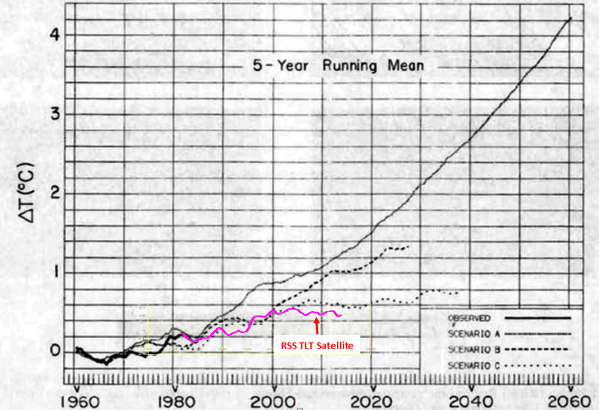
The next graph overlays RSS TLT satellite temperatures, which were created to verify the accuracy of surface data.
This is a classic study in how the team constantly tramples on the truth, in pursuit of their agenda.