If The Present Refuse To Get Warmer, Then The Past Must Become Cooler

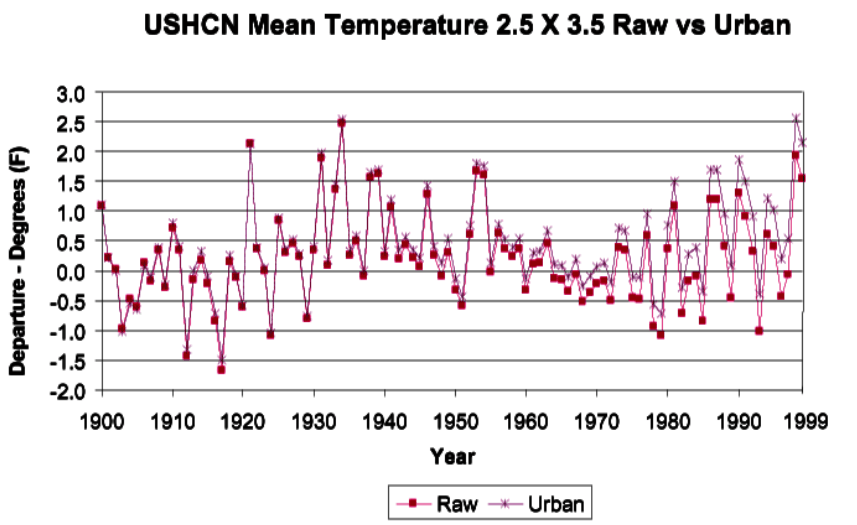
In USHCN V1, older temperatures were considered good, but recent temperatures were adjusted upwards by about 0.5F. After 1990, no further adjustments were considered necessary.

ts.ushcn_anom25_diffs_urb-raw_pg

GHCN Global Gridded Data

That wasn’t getting the global warming marketing job done, so in USHCN V2 they did the exact opposite. Older temperatures are now cooled, with a hockey stick of adjustments after 1996. The total adjustment is now about 1.5 degrees F, 300% of  the V1 adjustments.

HidingTheUSDecline

ScreenHunter_120 Jan. 20 11.28

Posted in Uncategorized | 7 Comments

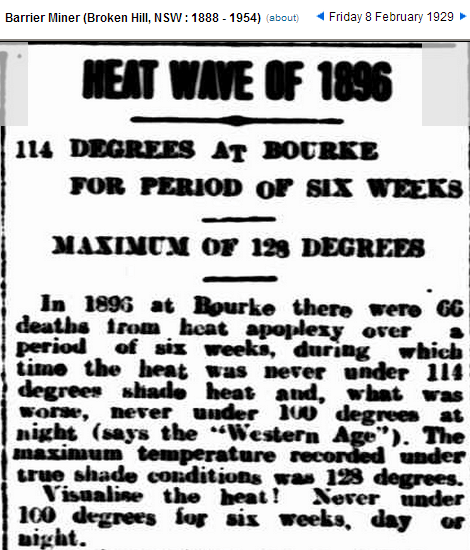
1896 – Bourke Never Dropped Below 100 Degrees For Six Weeks

Hansen says bad heatwaves were almost impossible before the dice were loaded.

BeX_rn8CcAABnfz

08 Feb 1929 – HEAT WAVE OF 1896 114 DEGREES AT BOURKE FOR PERI…

h/t to Jody

Posted in Uncategorized | 1 Comment

Hiding The Decline With The NCDC Teeter-Totter

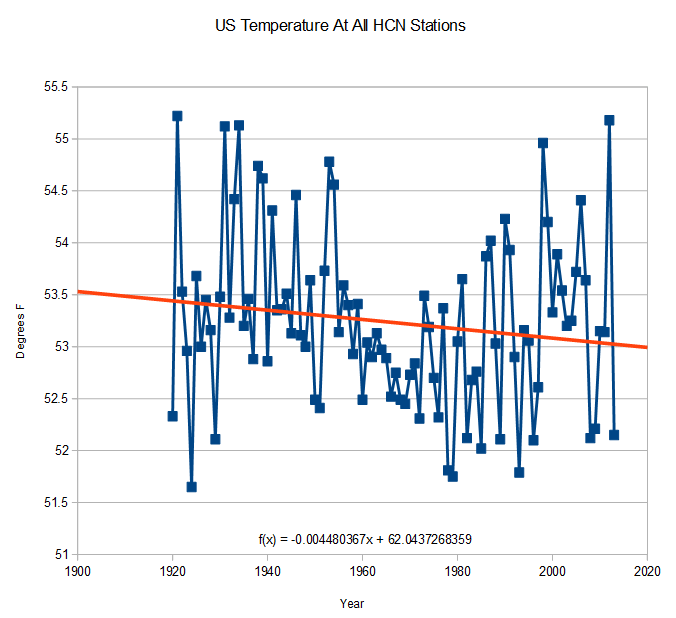
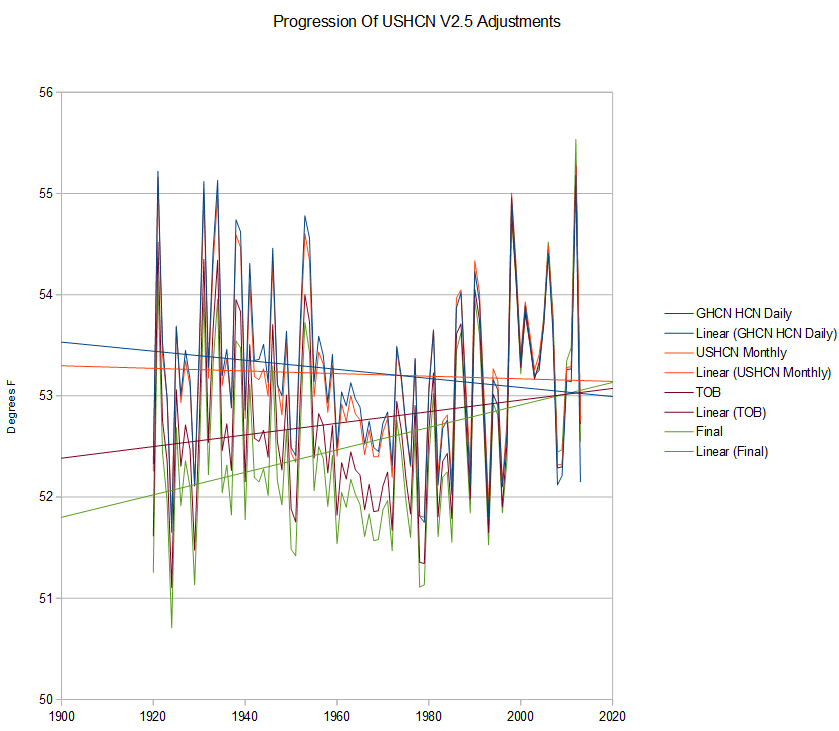
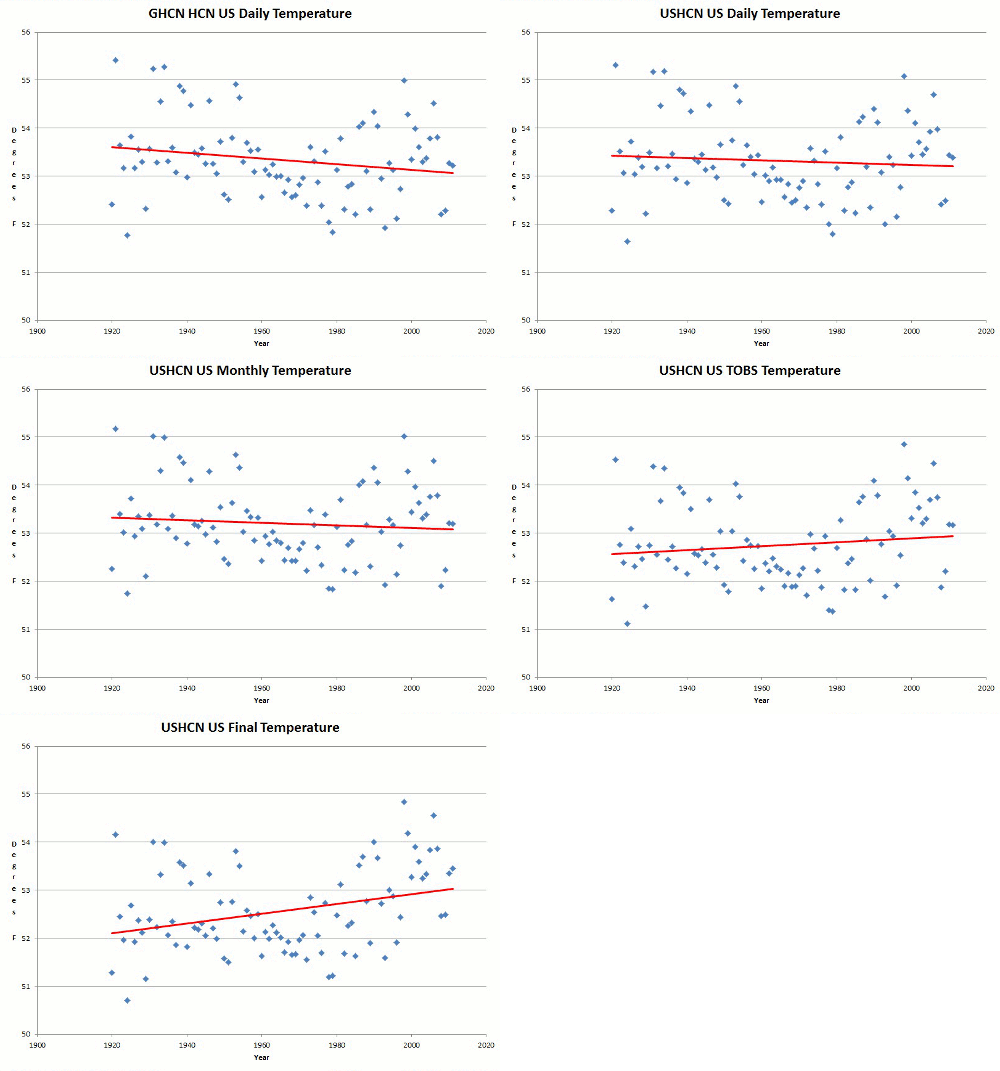
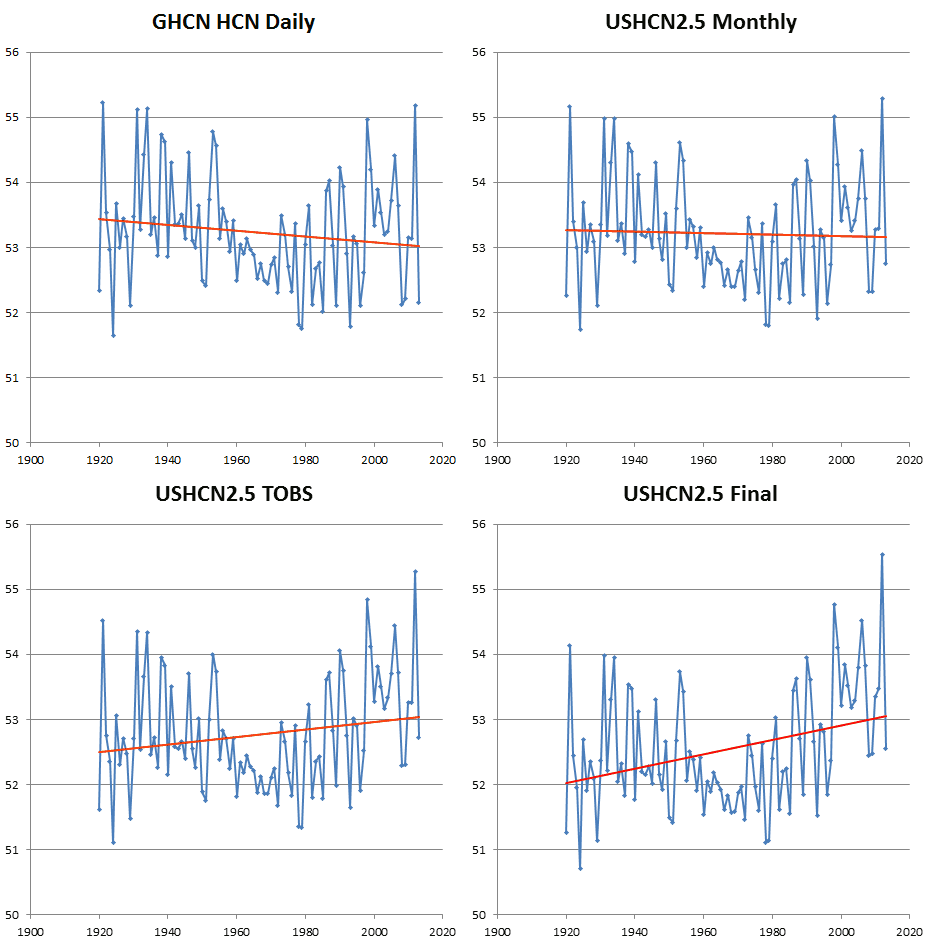
US daily temperature data shows cooling since 1920.

ScreenHunter_110 Jan. 20 10.10

Index of /pub/data/ghcn/daily/hcn/

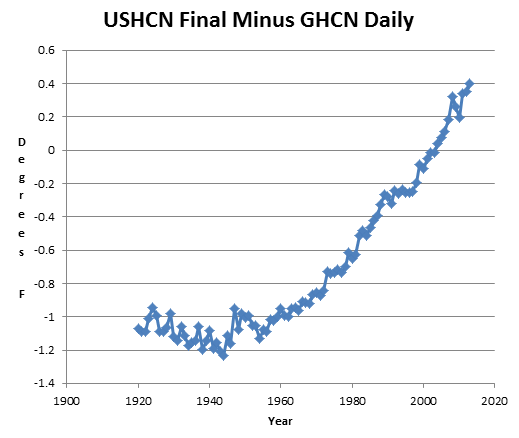
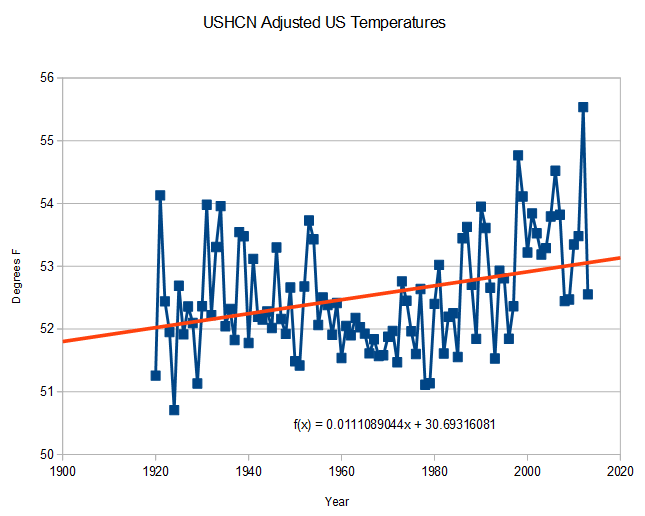
The final adjusted data released by USHCN shows warming since 1920

ScreenHunter_105 Jan. 20 09.24

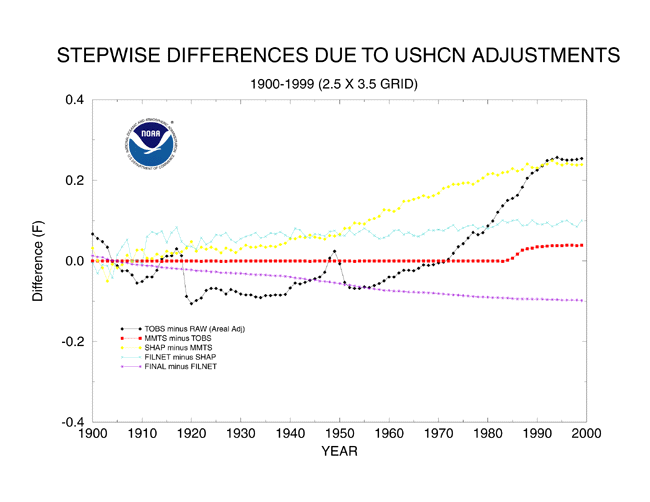
The accomplish this marvelous feat through a series of adjustment steps, each one cooling the past.

ScreenHunter_111 Jan. 20 10.10

What could possibly go wrong with a group of global warming activists successively cooling the past to turn a cooling trend into a strong warming trend?

Posted in Uncategorized | Leave a comment

Climate Scientist Brags About His Role In Nazi Style Book Burning

ScreenHunter_101 Jan. 20 06.39

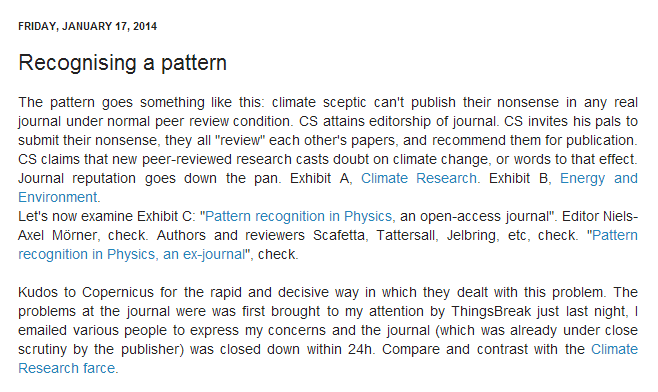
James’ Empty Blog: Recognising a pattern

They just want to have an honest debate, which means silencing any opposing viewpoints.

h/t to @Foxgoose and Marc Morano

Posted in Uncategorized | 8 Comments

UHI Made Simple

When I ride my bicycle from an open space trail to the Safeway parking lot less than 100 yards away, I frequently see 5-10 degrees difference in temperature. Asphalt and snow removal make huge differences. The USHCN UHI adjustment is about 0.1 degrees F over the last century.

ts.ushcn_anom25_diffs_pg (3)

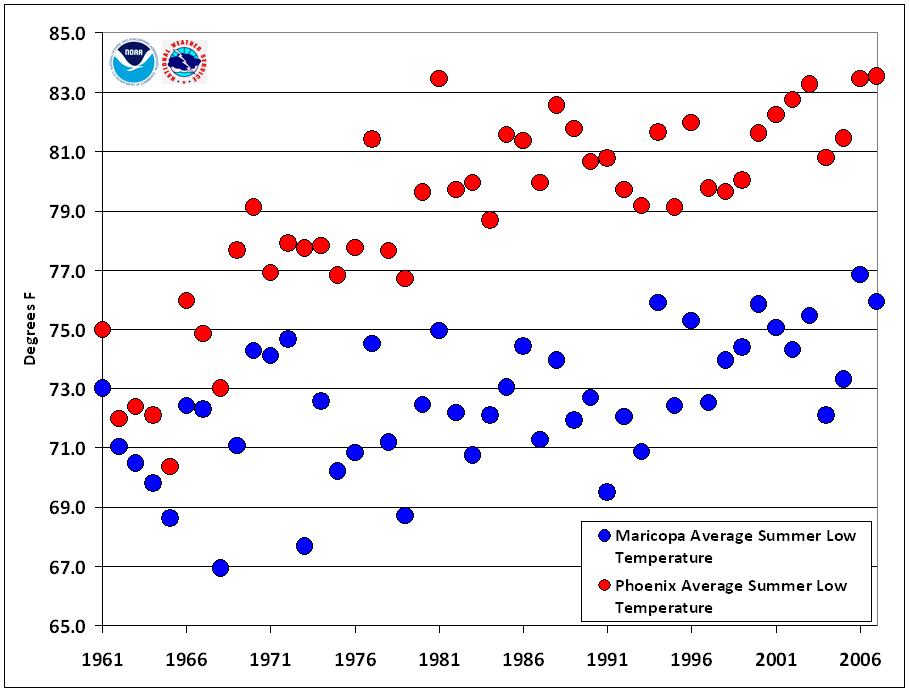
NOAA docs show 8F UHI in Phoenix, 80 times higher than what NCDC adjusts for.

UHIlows (1)

National Weather Service – NWS Phoenix

Posted in Uncategorized | 11 Comments

Broken TOBS

Ignoring a host  of other issues about TOBS, according to USHCN V2 docs the USHCN V2 TOBS adjustment is supposed to look like this – positive since 1980, and slightly negative prior to that.

ScreenHunter_78 Jan. 19 08.02

This is somewhat similar to V1 (dashed line below) except for a different offset, and a smoking gun of very different behavior after 1990.

ScreenHunter_99 Jan. 20 05.21

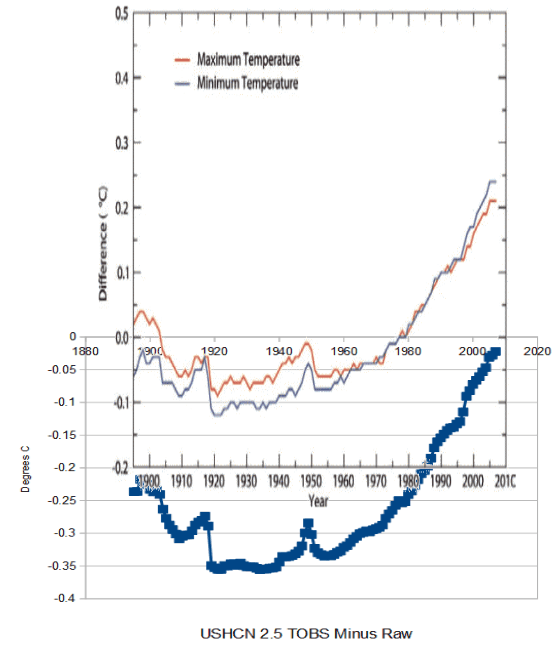
But the actual implementation of V2 TOBS (thick blue line below) is very different from the supporting docs. The actual adjustment is about 0.2C lower than the graph in the specification (red and thin blue) lines. It is abundantly clear that their code does not correctly implement the specification.

ScreenHunter_95 Jan. 19 15.14

Posted in Uncategorized | 15 Comments

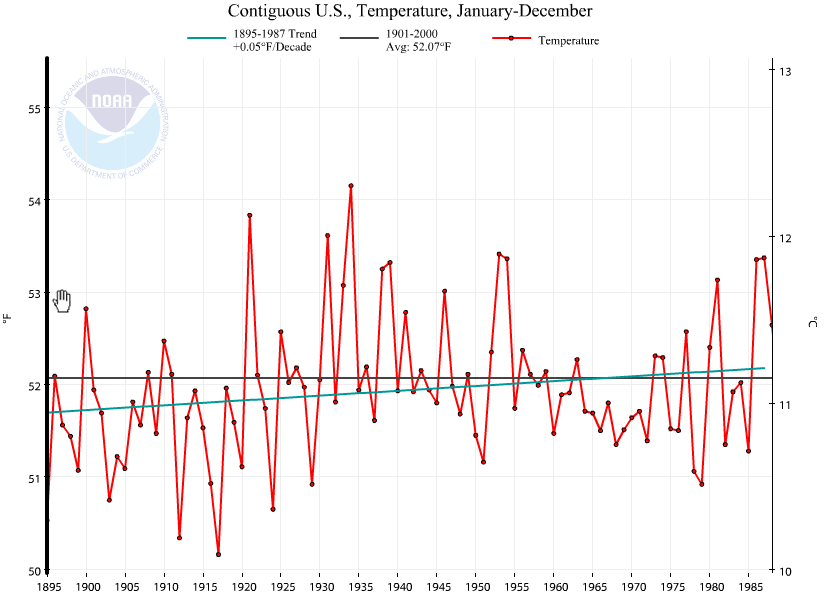
1989 : NOAA Said No Evidence Of US Warming

U.S. Data Since 1895 Fail To Show Warming Trend

By PHILIP SHABECOFF, Special to the New York Times Published: January 26, 1989

After examining climate data extending back nearly 100 years, a team of Government scientists has concluded that there has been no significant change in average temperatures or rainfall in the United States over that entire period.

The study, made by scientists for the National Oceanic and Atmospheric Administration was published in the current issue of Geophysical Research Letters. It is based on temperature and precipitation readings taken at weather stations around the country from 1895 to 1987.

U.S. Data Since 1895 Fail To Show Warming Trend – New York Times

NOAA now shows about half a degree warming during that same time period. They have rewritten their own history.

ScreenHunter_96 Jan. 19 16.59

Climate at a Glance | Time Series

Posted in Uncategorized | 14 Comments

Just Hit The NOAA Motherlode

I spent the evening comparing USHCN V1 and V2 graphs, and discovered a huge discrepancy between their V1 and V2 adjustments.

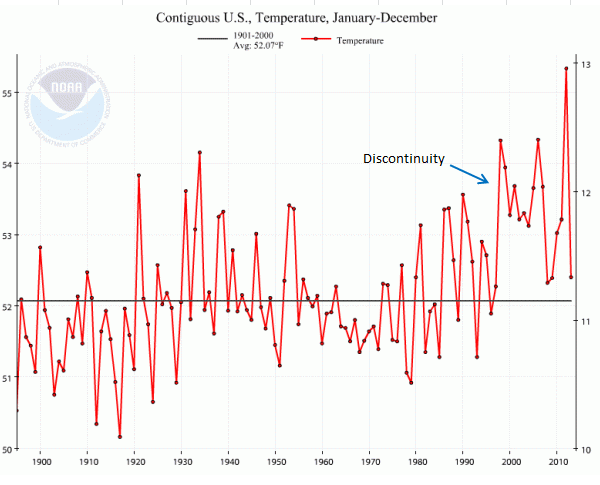
This is their current US graph. Note that there is a discontinuity at 1998, which doesn’t look right. Globally, temperatures plummeted in 1999-2000, but they didn’t in the US graph.
ScreenHunter_64 Jan. 19 00.08

Climate at a Glance | Time Series

It doesn’t look right, because they made a huge change going from USHCN V1 to V2.

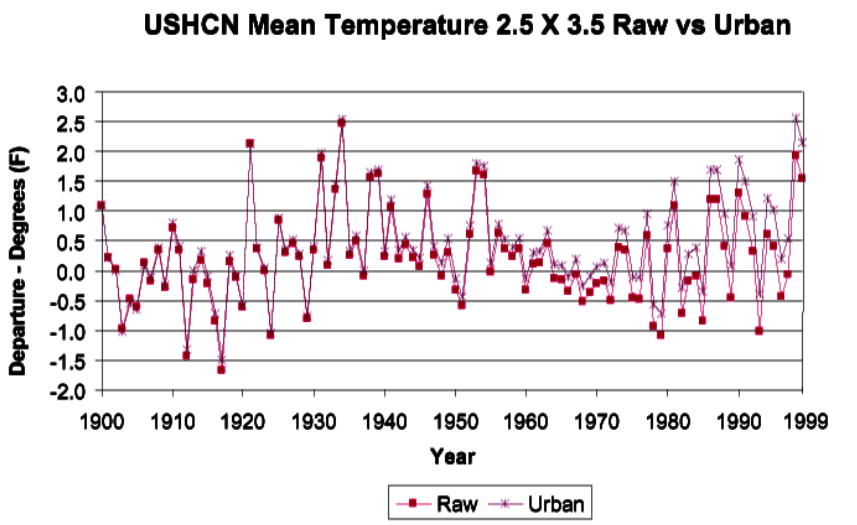
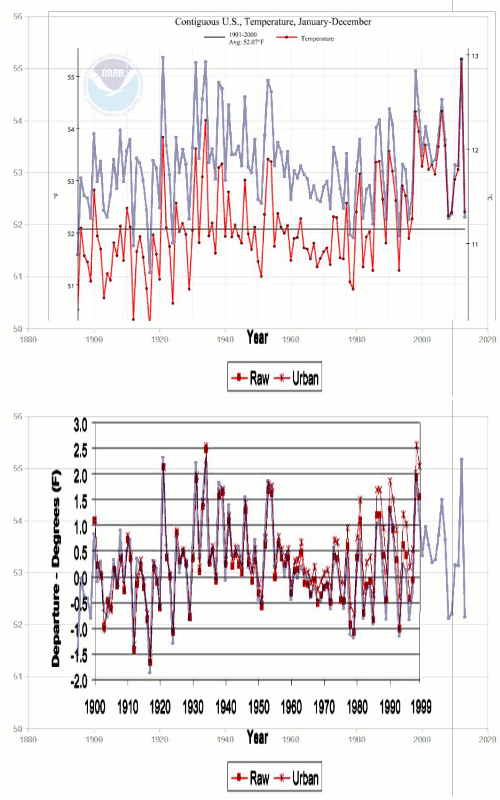
In V1 they adjusted recent temperatures upwards (thin line below) and made little adjustment to older temperatures.
ScreenHunter_48 Jan. 18 18.14

GHCN Global Gridded Data

But when they switched to V2, they started adjusting older temperatures downwards, and left post-2000 temperatures more or less intact. This created a huge jump (greater than one degree) downwards for all years prior to 2000. You can see what they did in the animation below.

Blue line is thermometer data.  Thin red line is V1 adjusted. Thick red line is V2 adjusted. Thermometer data and V2 data are normalized to the last five years, creating a small offset on the Y-axis. They created a significant warming by reversing polarity of the adjustment in the pre-2000 years. How did a peer-reviewed positive adjustment suddenly become a negative adjustment?
USHCNV1V2Error

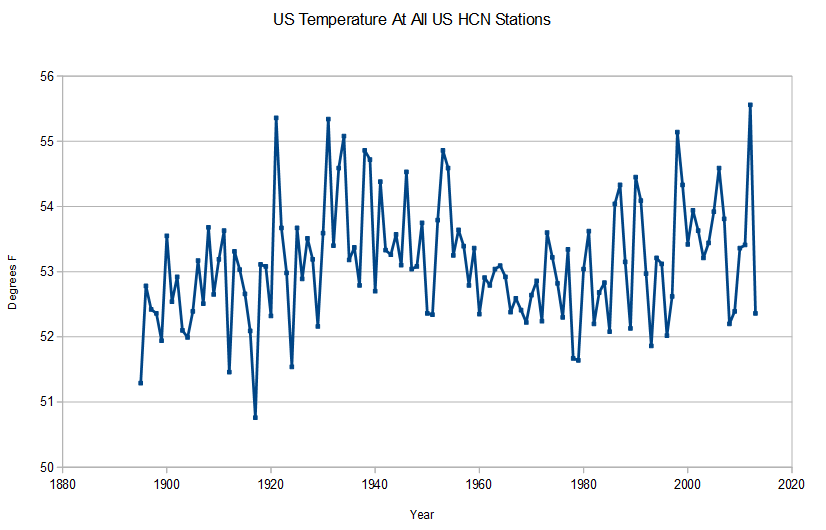
A big clue has been right in front of my eyes all along. Note that measured data below shows that by 2008, temperatures were back down to the 1989 level. But in the NCDC data, 2008 is half a degree warmer than 1989.
ScreenHunter_67 Jan. 19 00.51

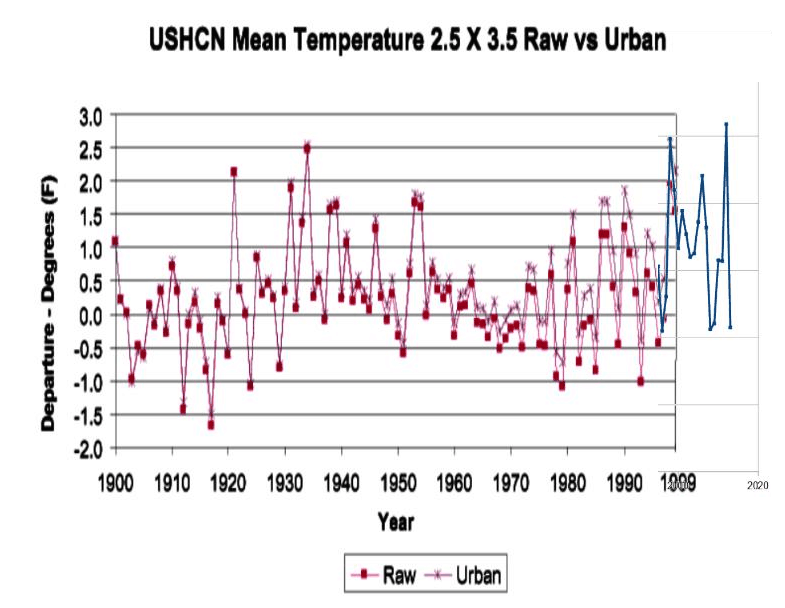
Bottom line is that there is clearly a huge error in the USHCN adjustments which has added a non-existent one degree hockey stick warming to the official US temperature record, and I now know just where to look for it in their code.

FOIA time.

This is what the adjusted temperatures would look like, without the error. Ignoring the fact that the adjustments themselves are probably not valid.
ScreenHunter_66 Jan. 19 00.37

NOAA made a big deal about 2012 blowing away all temperature records, but the temperature they reported is the result of a huge error. This affects all NOAA and NASA US temperature graphs, and is part of the cause of this famous shift.
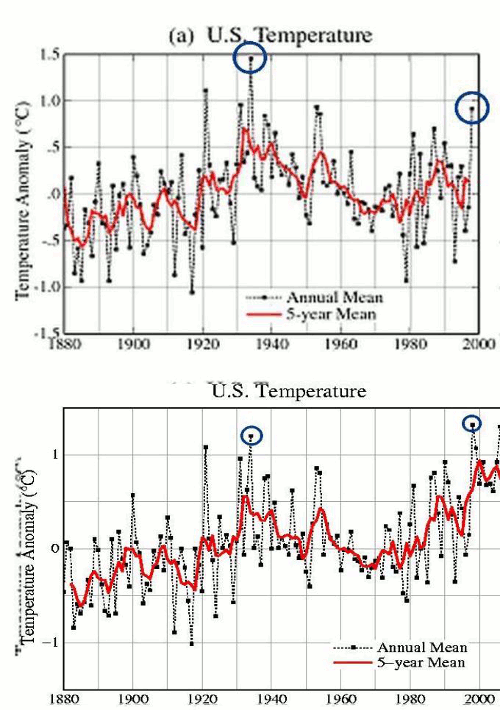
According to USHCN 1 docs, the total adjustment is supposed to be about 0.5F upwards, and flat after 1990.
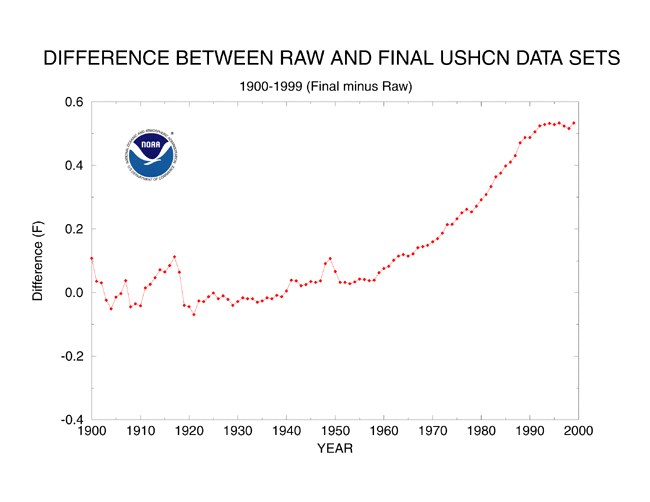
ts.ushcn_anom25_diffs_urb-raw_pg

ts.ushcn_anom25_diffs_urb-raw_pg.gif (650×502)

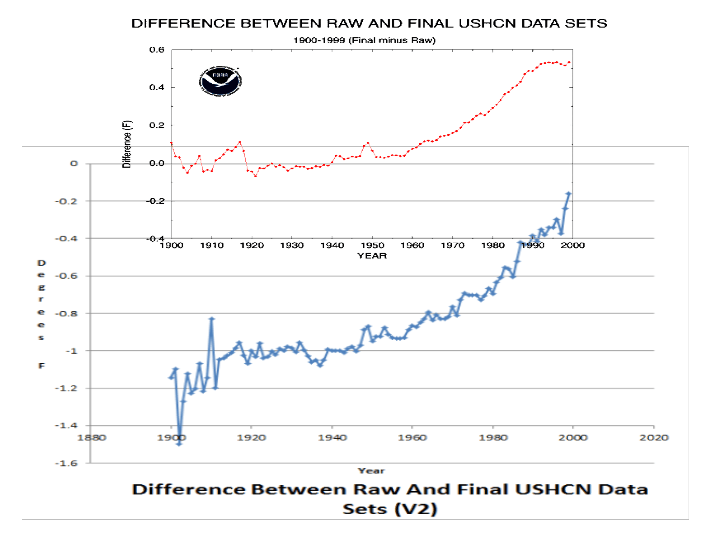
But in USHCN2, the adjustments are much larger, downwards, and actually accelerate after 1990. The USHCN2 adjustments are supposed to be similar to USHCN1, and the TOBS adjustment is supposed to be identical.

This graph shows the USHCN1 (red) and USHCN2 (blue) adjustments at the same scale and offset. Note that the adjustments went from being positive in V1 to being negative in V2. Also note that in V1, the adjustments went flat after 1990, and in V2 they rise exponentially after 1990.
ScreenHunter_189 Jan. 21 09.36

RSS satellite temperatures show that by 2008, US temperatures had cooled down below what they were during all of the non-volcano years of the 1980’s and 1990’s.
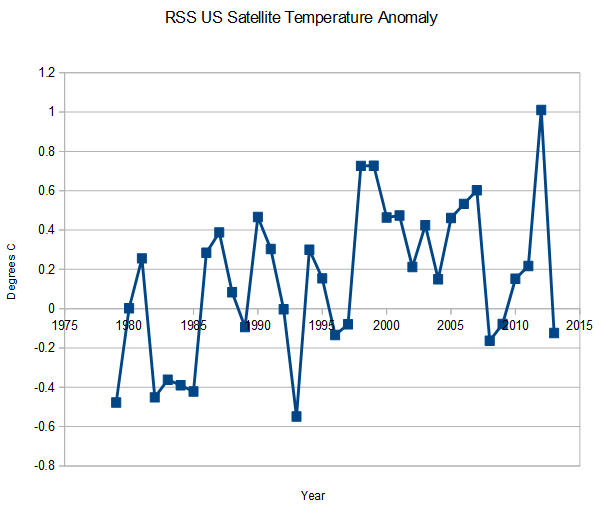
ScreenHunter_68 Jan. 19 06.51

RSS does not show the NCDC discontinuity, and NCDC is diverging from RSS at almost 1C/century
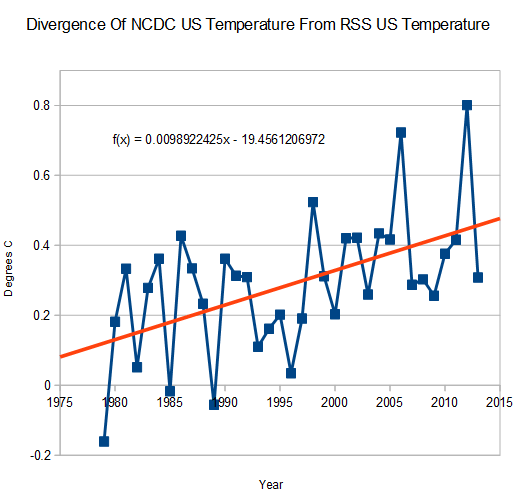
ScreenHunter_83 Jan. 19 11.50

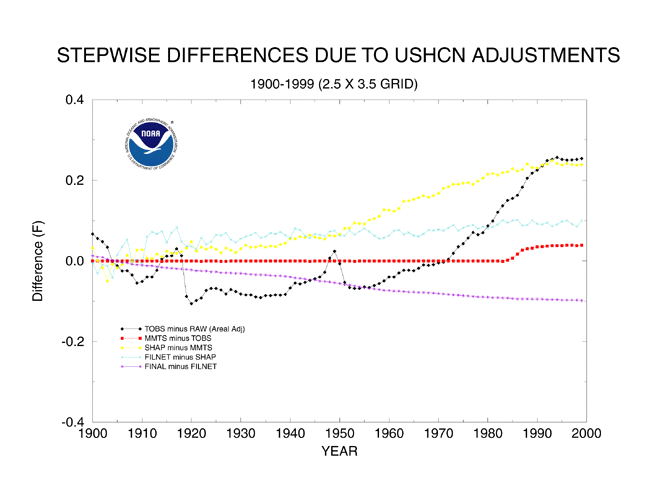
Here is an animation of the complete set of USHCN2 adjustments, which turn a 90 year cooling trend into a warming trend.
Visualizing How USHCN Hides The Decline In US Temperatures | Real Science

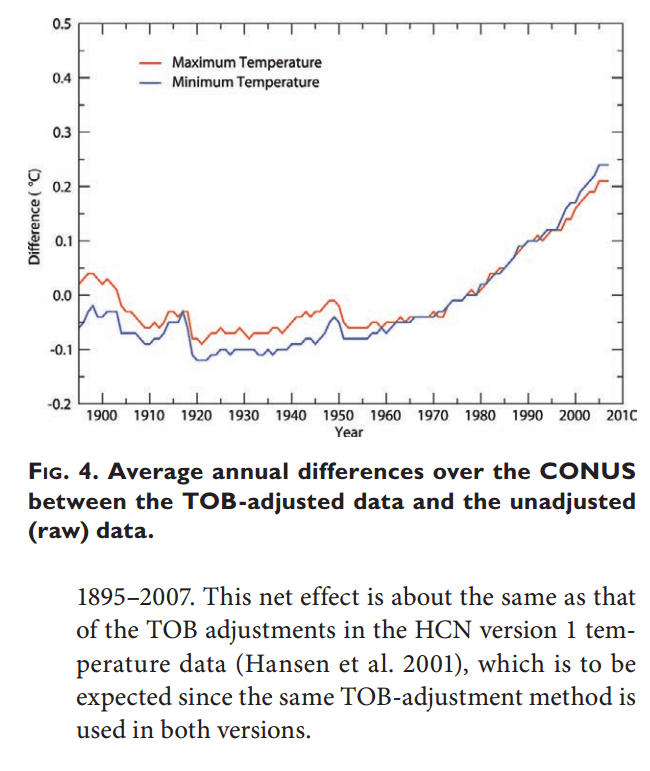
According to the USHCN2 docs, the TOBS adjustment is supposed to be almost identical to USHCN1. But in the actual data, it isn’t even close. Points to a software bug.
ScreenHunter_78 Jan. 19 08.02

ftp://ftp.ncdc.noaa.gov/pub/data/ushcn/v2/monthly/menne-etal2009.pdf

There are additional problems evident in the docs. The USHCN2 docs show TOBS continuing up after 1990, but the USHCN1 docs show TOBS going flat after 1990. USHCN1 showed 2ºF TOBS, but USHCN2 shows 2ºC TOBS.  It is supposed to be the same adjustment, and according to USHCN1 docs should have gone flat after 1990 – but is almost double the USHCN1 adjustment.
ts.ushcn_anom25_diffs_pg (1)

ts.ushcn_anom25_diffs_pg.gif (650×502)
ScreenHunter_99 Jan. 20 05.21

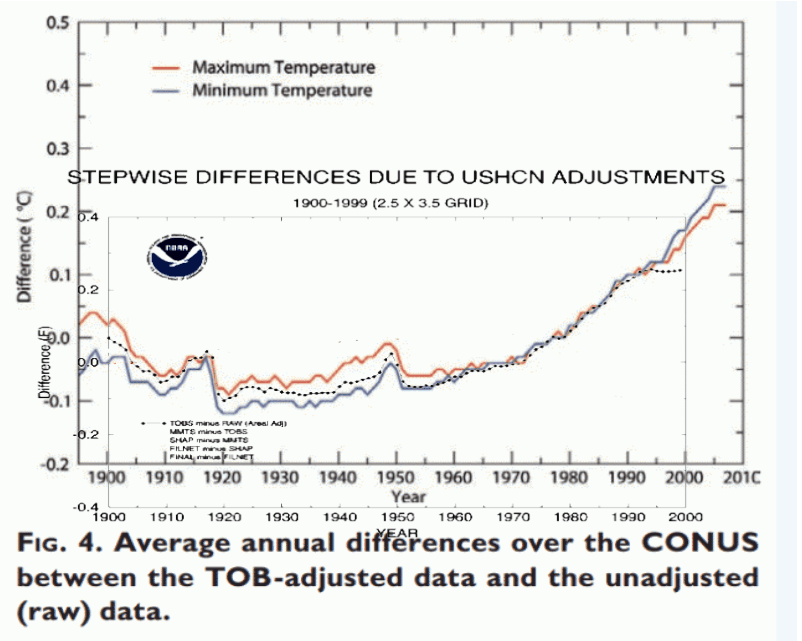
The next graph shows the actual implementation of V2 TOBS vs. the spec. The implementation (thick blue line) is offset down from the specification (thin red and blue lines) by about a quarter of a degree. How did a positive adjustment after 1980 turn into a negative adjustment? Fuzzy math?
ScreenHunter_95 Jan. 19 15.14

The actual TOBS adjustment above was calculated by subtracting  the raw temperatures ushcn.tavg.latest.raw.tar.gz from the TOBS adjusted temperatures ushcn.tavg.latest.tob.tar.gz.

Bottom line is that the NCDC US temperature record is completely broken, and meaningless. Adjustments that used to go flat after 1990, now go up exponentially. Adjustments which are documented as positive, are implemented as negative.

Posted in Uncategorized | 306 Comments

NOAA Urban Adjusted Temperatures Are Higher Than The Raw Temperatures

NOAA makes Piltdown Mann look like rocket science.

ScreenHunter_48 Jan. 18 18.14

rawurban3.5_pg.gif (712×431)

Posted in Uncategorized | 16 Comments

Obama Promises To Do The Constitution What He Did For Health Care

ScreenHunter_47 Jan. 18 17.55

Posted in Uncategorized | 6 Comments