Tough 15 Years For Jimmy

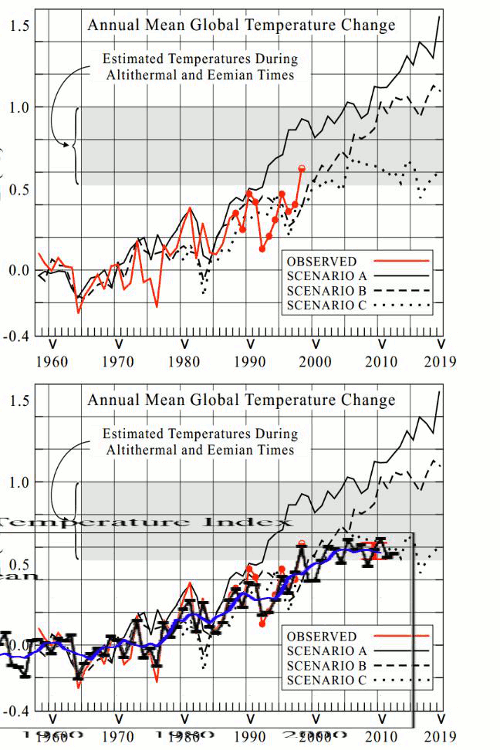
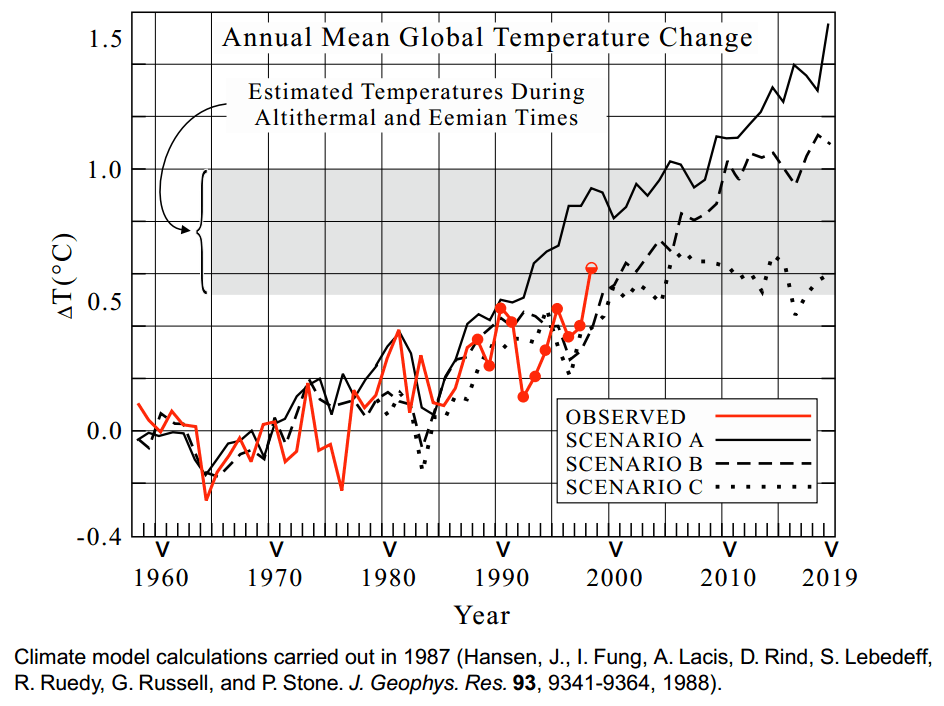
In 1998, Hansen thought he was on to something.

ScreenHunter_684 Dec. 23 17.56

PDF document

It turned out that he was wrong. Temperatures went horizontal after 1998.

ScenarioC

Most normal people would be able to figure out that they were wrong after 15 years, but Hansen simply ramped up the BS – and the data tampering.

Posted in Uncategorized | 3 Comments

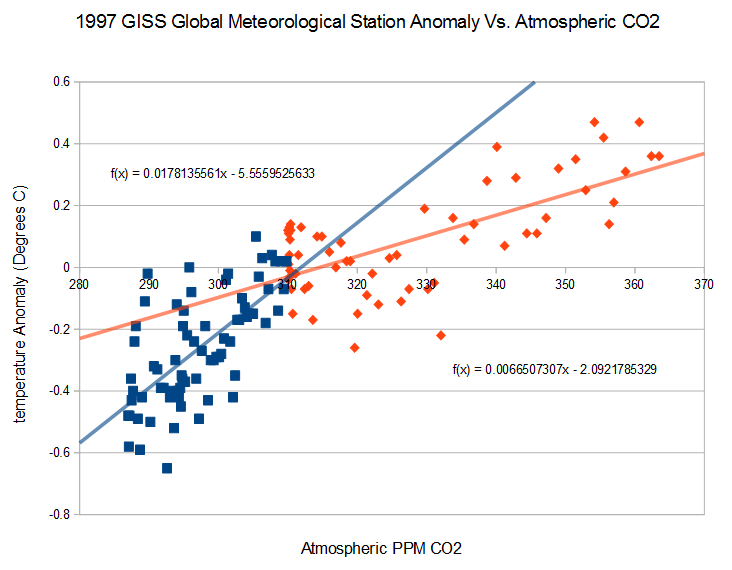
GISS 1997 Global Station Data Showed That CO2 Sensitivity Was Almost 3X Higher Below 310 PPM

According to GISS 1997 global data, temperatures responded to increases in CO2 much more rapidly below 310 PPM.

ScreenHunter_678 Dec. 23 16.37


Archived here : http://www.giss.nasa.gov/Data/GISTEMP/GLB.Ts.txt

Posted in Uncategorized | 5 Comments

Global Warming Theory Busted By Archived GISS Data

The web archive never forgets.

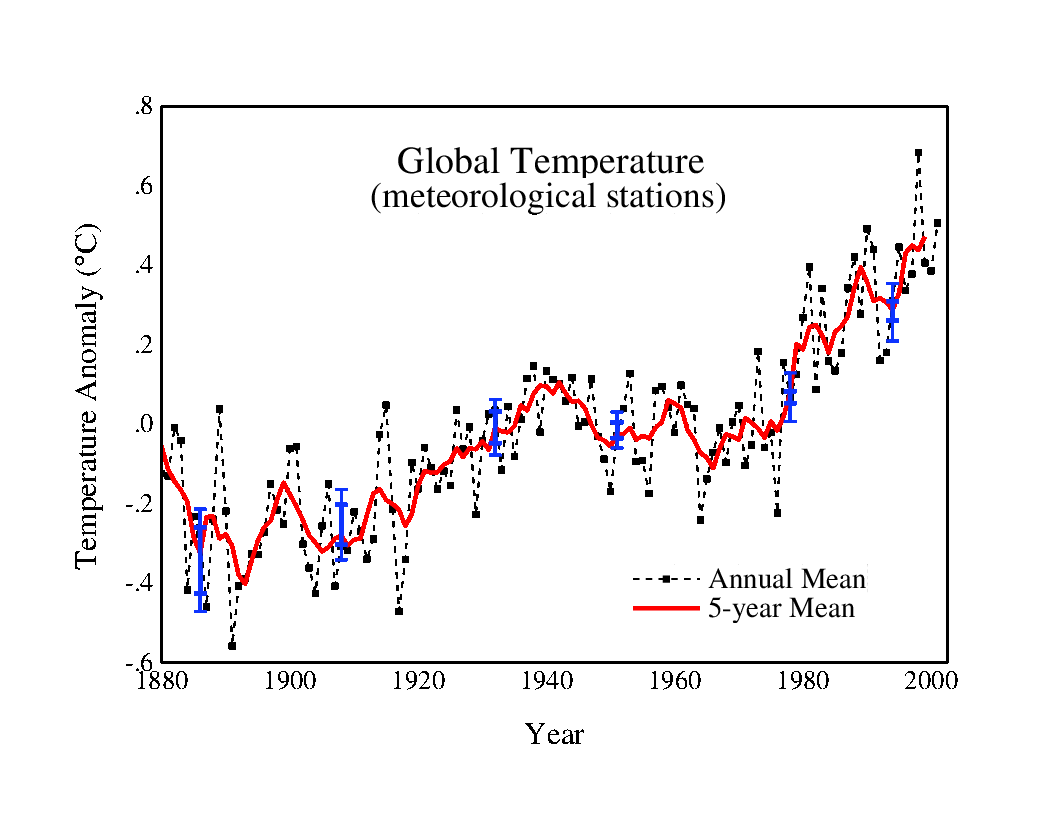
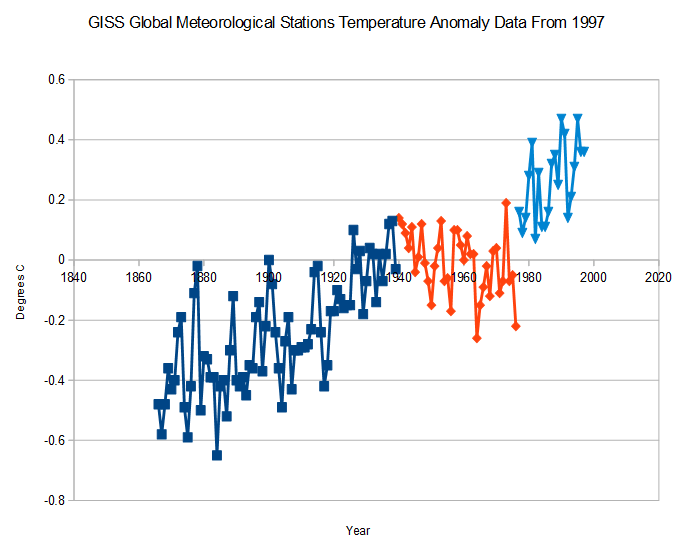
In 1997, GISS showed that about three-fourths of global warming occurred prior to 1940. In other words, global warming started before CO2 started rising significantly, and recent global warming coincided exactly with the PDO shift in 1976.
ScreenHunter_677 Dec. 23 16.23

Archived here : http://www.giss.nasa.gov/Data/GISTEMP/GLB.Ts.txt

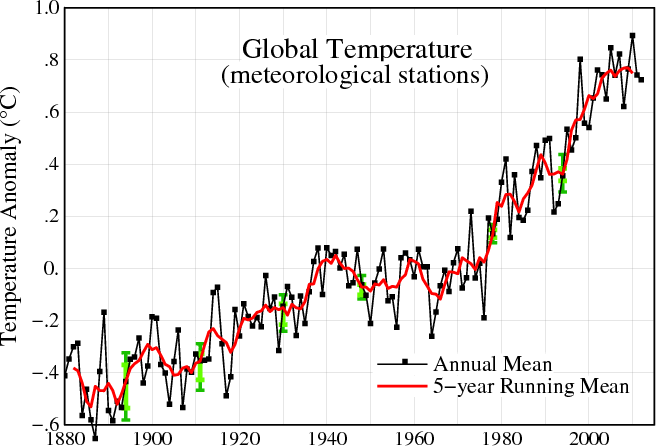
But it is worse than it seems. It turns out that 1940 to 1970 global cooling was real, before they deep-sixed it.

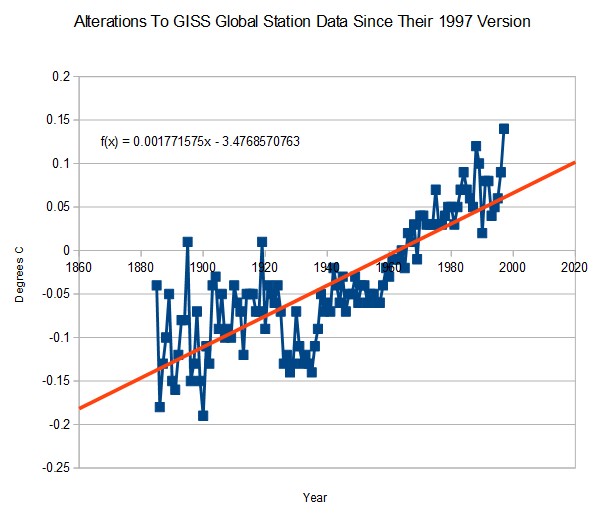
The next graph shows how GISS has altered the data since 1997.
ScreenHunter_675 Dec. 23 15.59

Current data here : data.giss.nasa.gov/gistemp/graphs_v3/Fig.A.txt

Now we know why GISS doesn’t keep their old data around. It doesn’t support global warming theory.

Posted in Uncategorized | 1 Comment

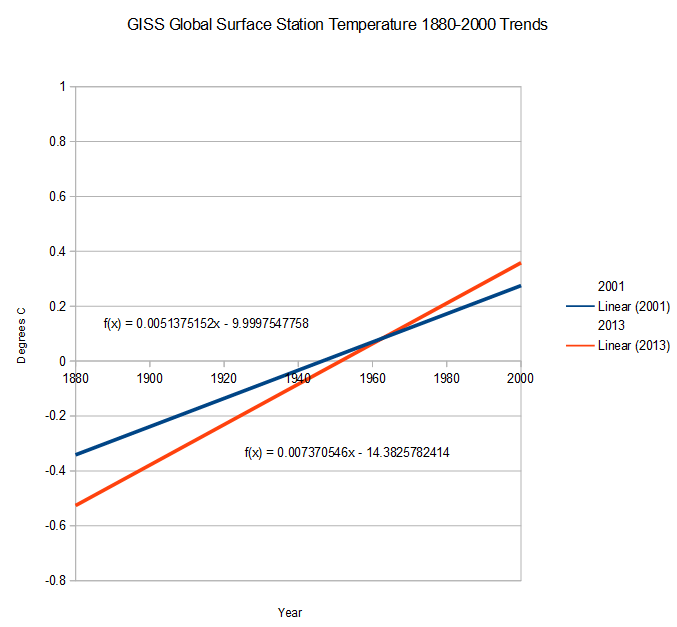
45% Of GISS Global Surface Trends Are Due To Data Tampering Since 2001

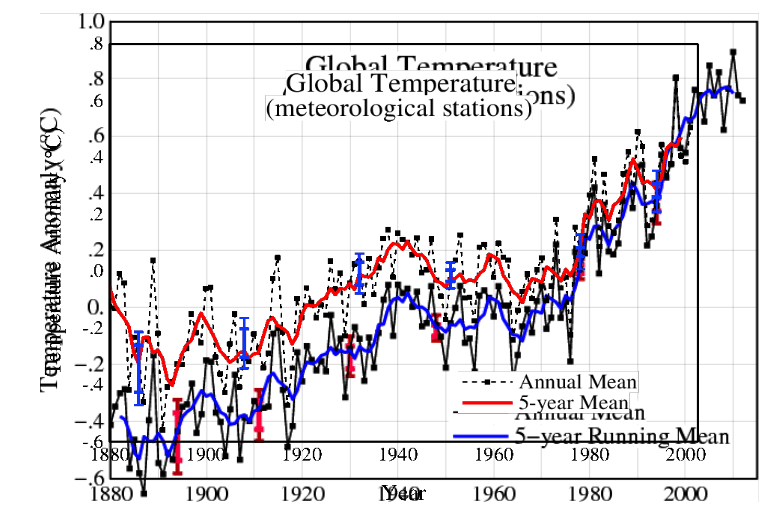
I found this 2001 version of the GISS global station graph in the web archive. Note that the 1880’s used to be just as warm as the 1960’s.

FigA.ps

NASA Goddard Institute: Surface Temperature: Graphs

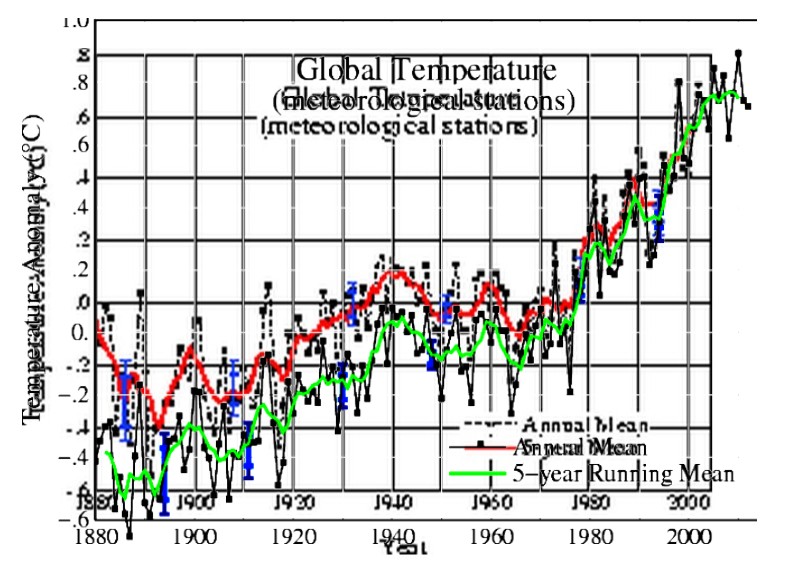
Here is the current version. Note that the 1880’s have cooled about 0.4ºC since 2001, and are now much colder than the 1960’s. (Funny how that works.)

Fig.A (2)

Fig.A.gif (656×446)

Next graph is a composite, normalized to 1998, with the 2013 version in blue.

ScreenHunter_670 Dec. 23 14.39

And finally the trend graphs, which show that 45% of all current warming is due to “adjustments” since 2001. This of course doesn’t include how much of the trend is due to tampering prior to 2001.

ScreenHunter_666 Dec. 23 12.46

2001 version : http://www.giss.nasa.gov/data/update/gistemp/graphs/FigA.txt
2013 version : data.giss.nasa.gov/gistemp/graphs_v3/Fig.A2.txt

Posted in Uncategorized | 6 Comments

Santa Obama Wants You To Spend The Last Of Your Christmas Money Saving His Ass

ScreenHunter_669 Dec. 23 14.12

Posted in Uncategorized | 5 Comments

NASA : Cooling Down The Whole World’s Past

Dave Burton sent over a bunch of archive links which have turned up some more history of NASA’s data tampering.

The graph below shows NASA’s 2004 version of global surface temperatures in red, and current version in green – normalized to 1998. Note that in 2004 the 1880’s were just as warm as the 1960’s, but they have since cooled way down. Hansen must have traveled back in time and changed the past.

ScreenHunter_650 Dec. 23 09.08

2004 version : Fig.A.gif (274×203)

2013 version : Fig.A.gif (656×446)

The next graph shows the extent of their changes. NASA has completely eliminated the hot 1880’s, when Europe set their all-time record high temperature. Thoughtful of them to go back in time and cool those poor people down.

ScreenHunter_653 Dec. 23 09.42

2001 version : http://www.giss.nasa.gov/data/update/gistemp/graphs/FigA.txt

2013 version :  http://data.giss.nasa.gov/gistemp/graphs_v3/Fig.A.txt

ScreenHunter_654 Dec. 23 09.59

NCDC: Global Measured Extremes of Temperature and Precipitation

Posted in Uncategorized | 11 Comments

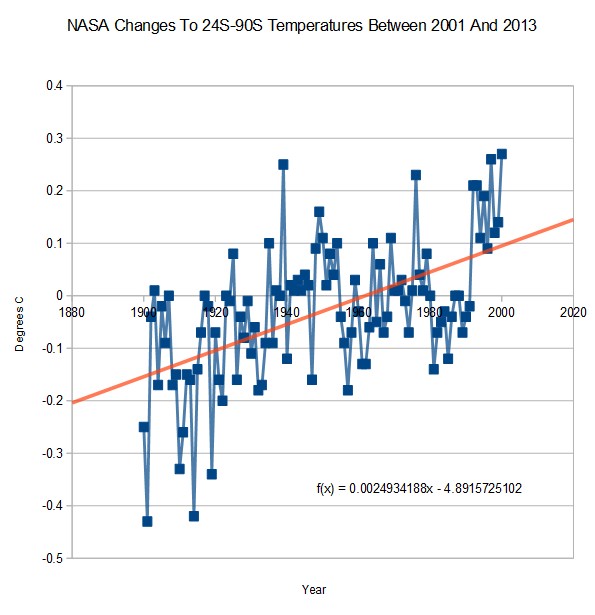
NASA : Cooling The Past Down Under Too

Prior to 1960, people all over the world always read temperatures too high. This was probably because they were very short and had to look up at the glass thermometer.

ScreenHunter_644 Dec. 23 08.00http://www.giss.nasa.gov/data/update/gistemp/graphs/FigB.txt

data.giss.nasa.gov/gistemp/tabledata_v3/ZonAnn.Ts+dSST.txt

Posted in Uncategorized | 5 Comments

Phil Shows That He Is Just As Good At Rewriting History As Jimmy And Tom

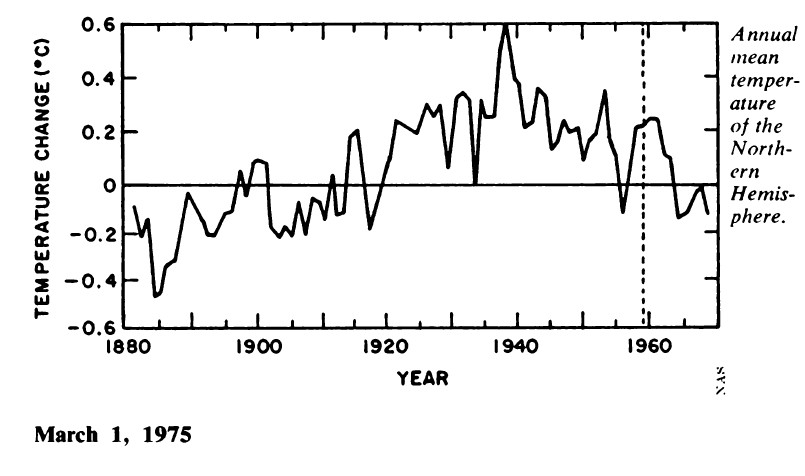
In 1975, the National Academy of Sciences showed that global cooling had erased all 1900-1940 Northern Hemisphere warming.

ScreenHunter_634 Dec. 23 06.23

CHILLING_POSSIBILITIES

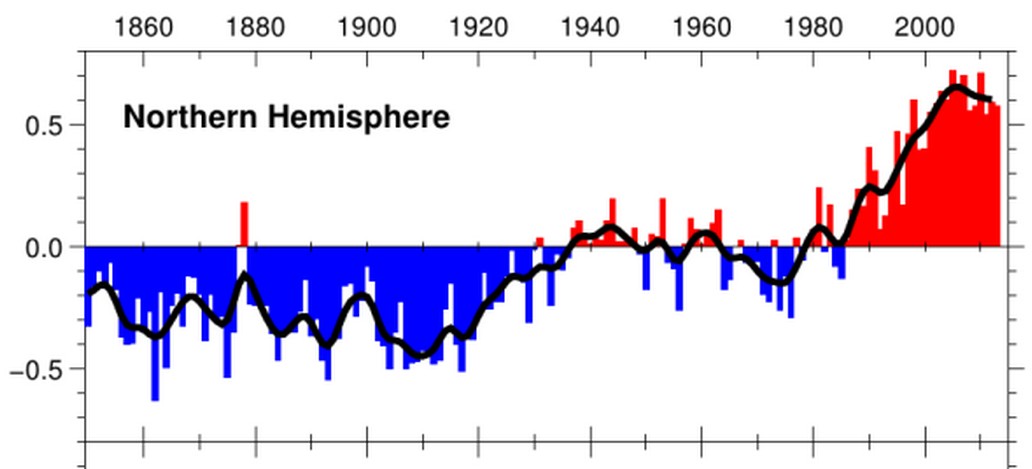
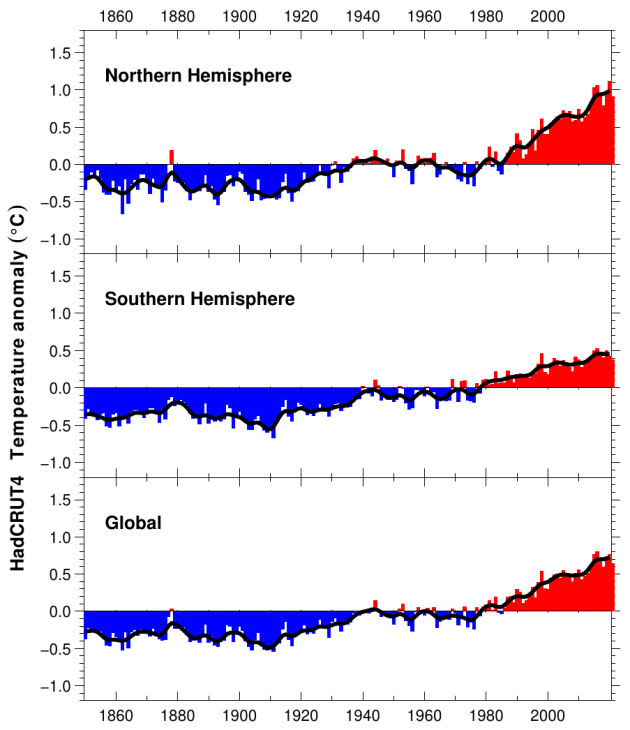
That didn’t make for a very good story, so Phil Jones erased half of the 1910-1940 warming.

ScreenHunter_633 Dec. 23 06.21

HadCRUT4.png (630×730)

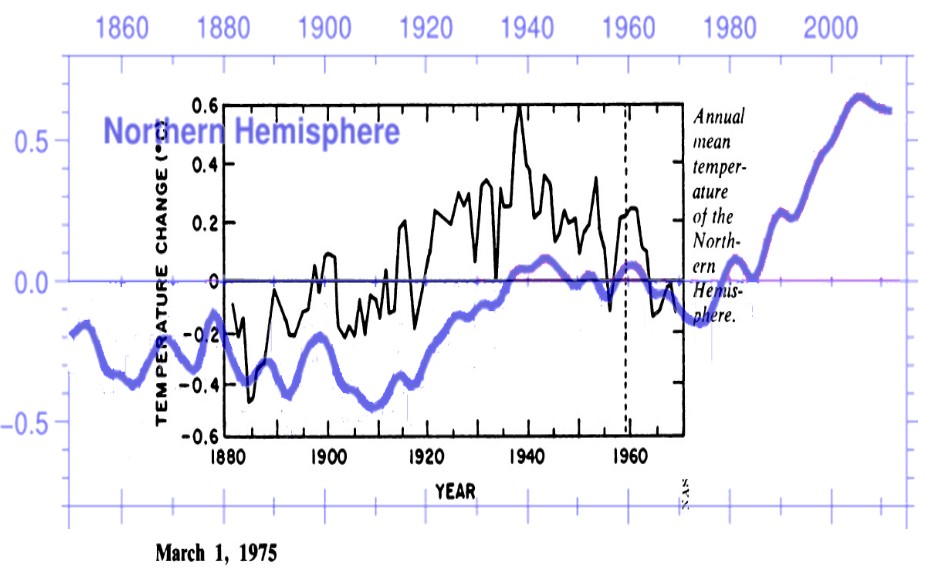
Next graph shows Phil’s handiwork in blue, overlaid on the 1975 NAS graph.

ScreenHunter_639 Dec. 23 06.35

Posted in Uncategorized | 2 Comments

1986 : Leading Experts – 6 Degrees Warming By 2010, Eight Degrees By 2030, With 4.5 Feet Of Sea Level Rise

Average global temperatures would rise by one-half a degree to one degree Fahrenheit from 1990 to 2000 if current trends are unchanged, according to Dr. Hansen’s findings. Dr. Hansen said the global temperature would rise by another 2 to 4 degrees in the following decade.

While the effect of small increases in global temperature is now unclear, Andrew Maguire, vice president of the World Resources Institute, a Washington research and policy group, said that the doubling of atmospheric carbon dioxide that is foreseen would cause a rise of 3 to 8 degrees in temperature by the 2030’s. He said this would devastate agriculture in the United States and elsewhere, and would cause a rise in sea level of some 4.5 feet as polar ice melted.

SWIFTER WARMING OF GLOBE FORESEEN – NYTimes.com

Posted in Uncategorized | 3 Comments

1982 : Global Warming To Bring Lions And Elephants To England, And Drown Major Cities

Dr. Hansen said the probability was that a warmer climate would make some places wetter while others were likely to be drier than today, but that it was too early to say which effects any given region would experience. Several specialists have noted that a pronounced warming trend could raise sea levels sufficiently to inundate many of the world’s major cities. There has already been a small rise in sea level simply because of expansion of the warmer surface waters of the ocean, Dr. Hansen said.

Hermann Flohn of University of Bonn said warming effects on the climate would be small at first, but, through the next century, might give the planet its warmest spell since an interglacial period 125,000 years ago. In that period, he noted, lions, elephants and other warm-climate animals roamed what is now England.

WARMING OF WORLD’S CLIMATE EXPECTED TO BEGIN IN THE 80’S – NYTimes.com

Posted in Uncategorized | 4 Comments