NOAA is reporting more than double the wind speed which is being measured on the ground.

WunderMap® | Interactive Weather Map and Radar | Weather Underground
NOAA is reporting more than double the wind speed which is being measured on the ground.
WunderMap® | Interactive Weather Map and Radar | Weather Underground
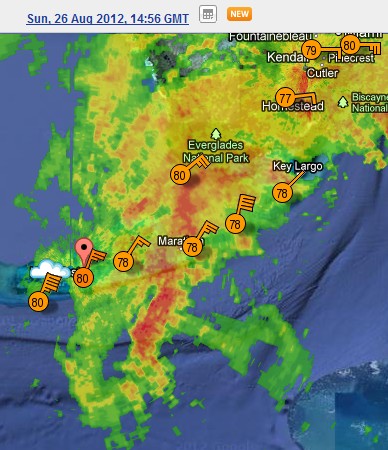
Issac is about to cross the Florida Keys. NOAA reports 65 MPH, which is 15 MPH higher than any station is recording.
After almost losing their last few games, Roberto Mancini has finally decided to start Balotelli instead of waiting until the last 20 minutes to bring him in and save the match.
A reader has been spamming the site today with claims that Greenland is rapidly losing mass, which was based on a spectacularly incompetent study out of the University of Texas
Climate Change: Are the Polar Ice Caps Melting Slower Than We Thought?
Those are scary numbers, but a new study published in the September issue of Nature Geoscience suggests that the true melt rate might be much slower than that. (Access a PDF of the study here.) A joint team of American and Dutch scientists took another look at the GRACE data and found that Greenland and West Antarctica may be melting just half as fast the earlier studies estimated. As researcher Bert Vermeersen, a professor at Delft University of Technology in the Netherlands, told the AFP, the earlier estimates failed to account for glacial isostatic adjustment—the rebounding of the Earth’s crust after the end of the last Ice Age:
http://science.time.com/2010/09/09/climate-change-a-slowdown-on-polar-melt/
The experts who did the original study should be banned from future publication.
As Issac approaches Florida, I will be tracking NOAA to see how much they are exaggerating the wind speeds. Current top wind speed is 30 MPH

http://www.wunderground.com/wundermap/

Key West up to 47MPH

Where do these people come up with this crap? The last 13 months has been barely above average, and almost half a degree cooler than 1998

NSIDC wants us to believe that satellite measurements began in 1979.

But satellite records go back much further, and showed ice gain in the 12 years prior to 1979. Paul Homewood found this quote from the CRU Director HH Lamb
Kukla & Kukla (1974) report that the area of snow and ice, integrated over the year across the Northern Hemisphere, was 12% more in 1973 than in 1967, when the first satellite surveys were made.
HH Lamb–“Climate: Present, Past & Future–Vol 2”–In Review–Part II « NOT A LOT OF PEOPLE KNOW THAT
From 1974 to 1979, the IPCC showed another large gain
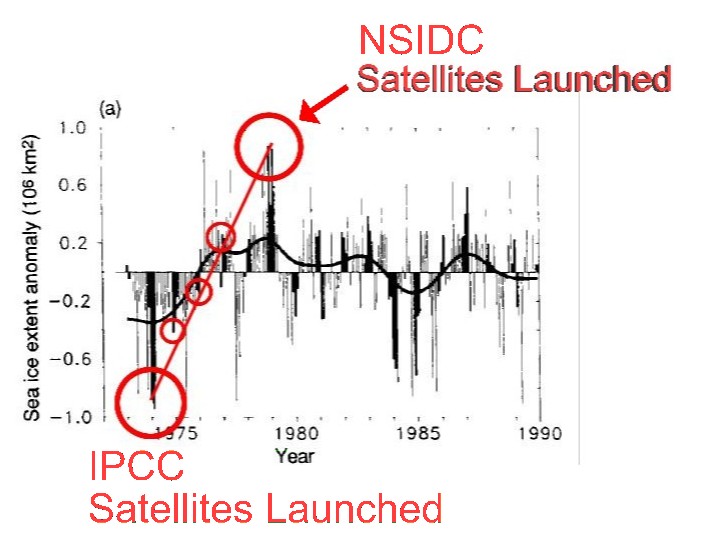
www.ipcc.ch/ipccreports/far/wg_I/ipcc_far_wg_I_full_report.pdf
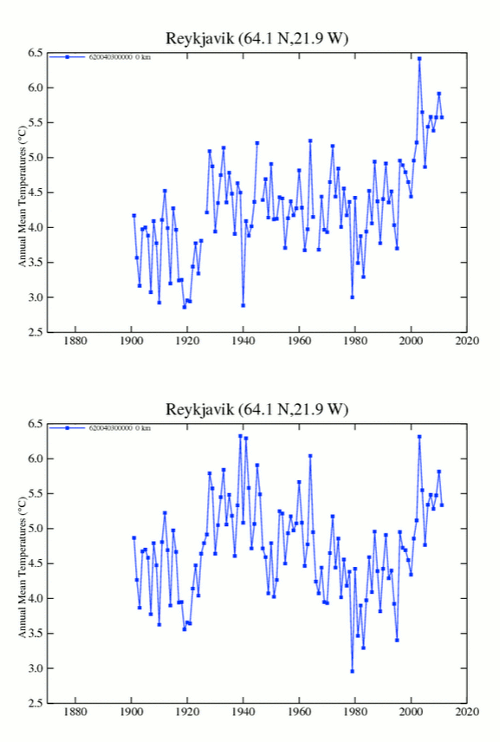
If NSIDC showed the complete satellite data set, people would know that Arctic behavior was cyclical, as we can see in the original GISS temperature graph from Iceland

Data.GISS: GISS Surface Temperature Analysis
Hansen of course didn’t want us to know about this cyclical behavior either, so he got rid of it. You can do that when you are an activist, who also controls the data.
You have to see this movie.
I saw it tonight. It is a very serious in depth, academic look at Obama’s background. Anyone who votes for him after seeing this movie, is insane.
Obama thought he was off camera when he said this to Dmitri Medvedev.


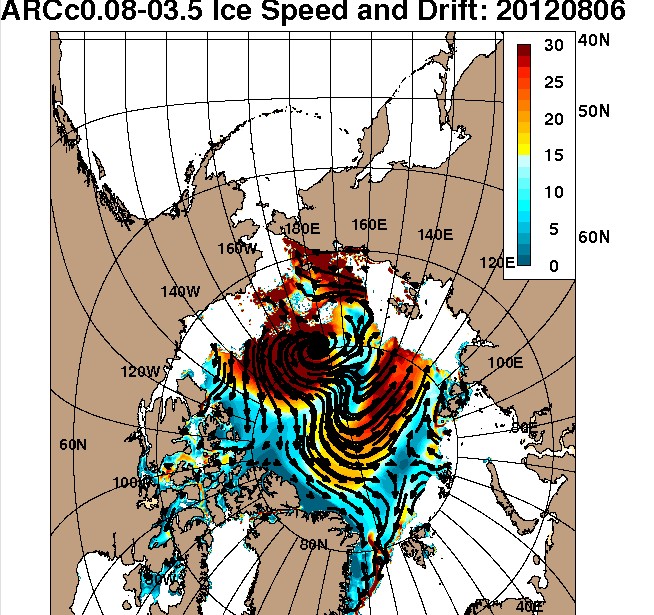
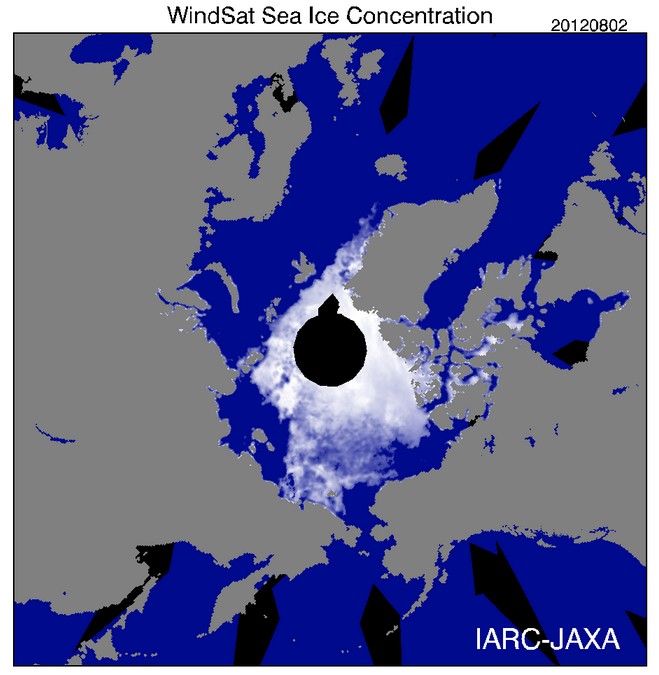
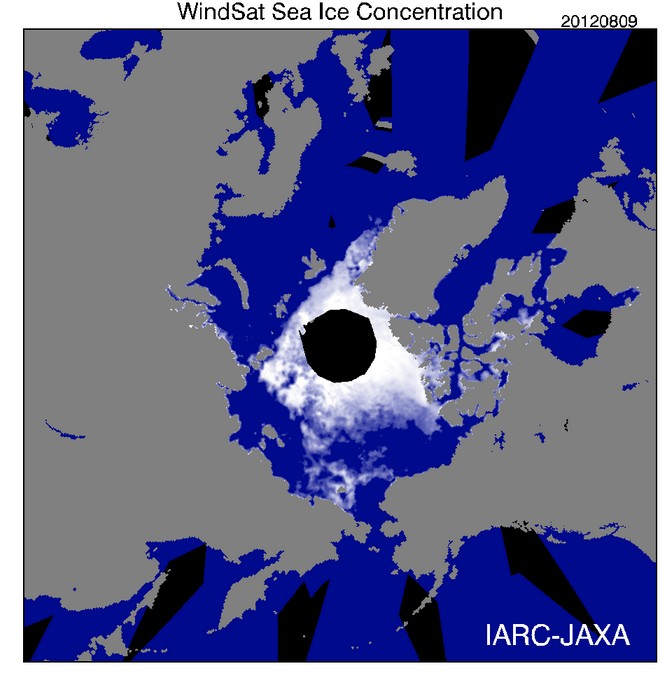
I made a post explaining the drop in extent over the last few days, as being due to wind out of the Kara and Laptev Seas compressing the ice.


This offended the religious sensibilities of “Jak” who sees the second coming of the 2007 minimum as a sacred and holy icon to be worshipped. So he launched into this lunatic rambling diatribe.
jak says:
Steven,
You and I may have disagreed several times over various subjects; and my respect for you is quite limited, because you are such an incorrigible and transparent liar.
But I would like to say this. You really are beginning to grow in my respect, because, although you must clearly be able to see that your position is completely untenable, still you perservere.
There is something genuinely noble in your stance. IMHO, your war on reality, as defined by anybody who has the slightest idea of what they’re on about, is not going well.
But we both know this. And you have kept to your post.
Elsewhere on the conservative/demented side of the climate debate, a deathly hush.
As the data has poured in from the North this year, nothing from WUWT – two weeks now – Delingpole, last seen charging at windmills – Jo Nova – well, its all to do with the Northern Hemisphere – does the North Pole exist?
I imagine that you might find this hurtful… to be abandoned here, without a leg to stand on, in the last ditch. But there is something almost noble about it. The 12 year olds that died in Berlin in 1945 for Adolf… the Japs that only surrendered in 1963.
You are clearly mad; but you are not a pathetic snivelling coward, like several other leading conservative commentators.
Indeed, you are the last man standing. A worthy champion of the Romney/Ryan position on science.
No, Jak. It is about the wind in the Laptev Sea compressing the ice. Get a grip.
Mark Serreze fooled a lot of people in 2007, and then tried to back of it.
“In hindsight, probably too much was read into 2007, and I would take some blame for that,” Serreze said. “There were so many of us that were astounded by what happened, and maybe we read too much into it.”
Tricky Sea Ice Predictions Call for Scientists to Open Their Data | Wired Science | Wired.com
He is back doing the exact same thing in 2012.
“I don’t think the big storm that we have earlier this month had much of an effect,” said Mark Serreze, the NSIDC director. “The rapid loss of ice we’ve seen over the past few weeks has been in the East Siberian Sea (north of Eastern Siberia) and this ice was already posed to melt out, with or without a storm.”
Arctic Sea Ice Record Now Could Be Set in August | Climate Central
The ice loss was mainly in the Chukchi Sea, where the storm was. The storm brought warm water to the surface. How could a scientist suggest that the storm did not affect the minimum?