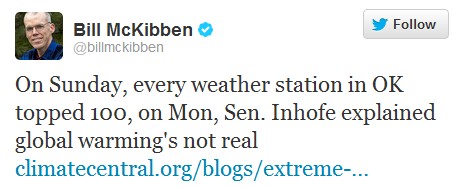
McKibben Believes That CO2 Turned Him Into A Newt

Twitter / billmckibben: On Sunday, every weather station …

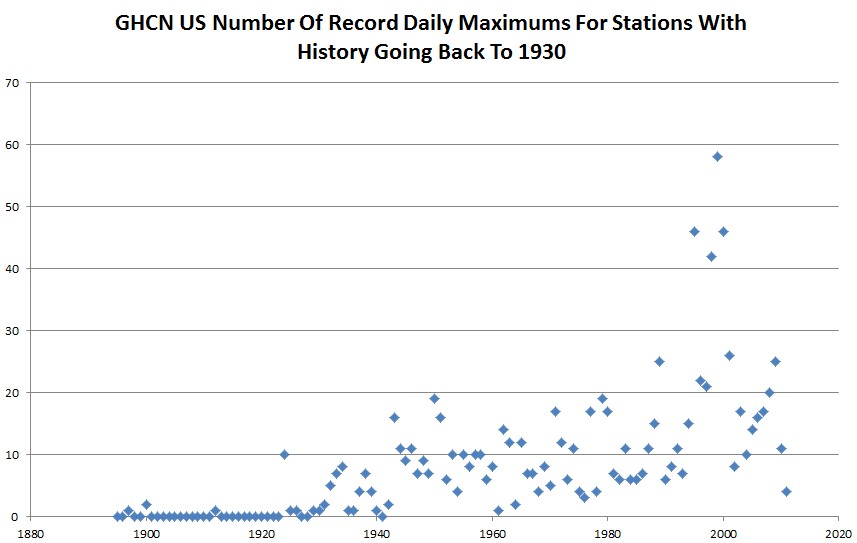
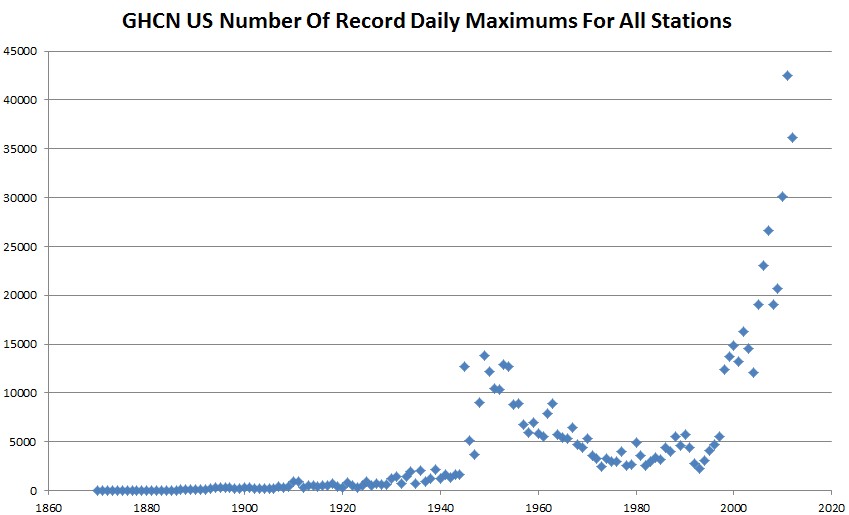
On July 31, 1934 all of the weather stations in Oklahoma topped 100, and most topped 110.  The table below shows recorded high temperatures for all of the USHCN weather stations in Oklahoma on July 31, 1934. It appears that Oklahoma has cooled considerably since 1934.

109 103 108 110 105 112 109 107 111 110 109 110 110 109 110 107
115 106 108 111 107 108 106 111 110 106 107 110 110 110 106 110
110

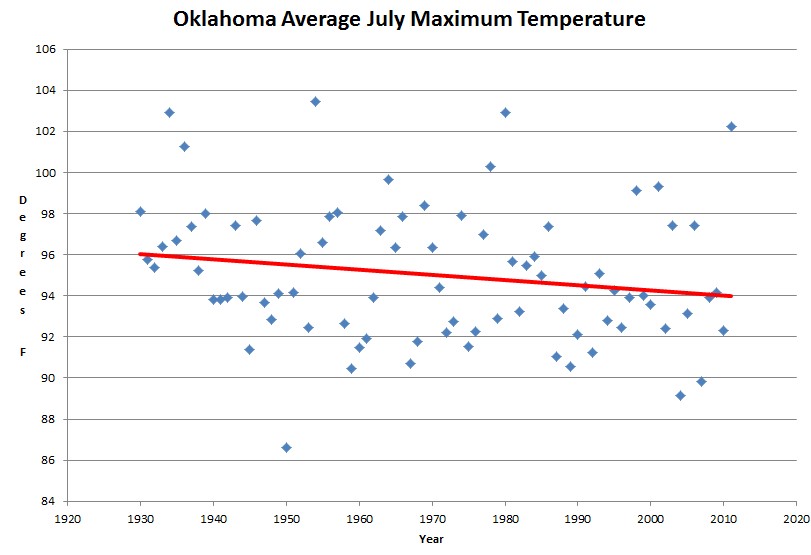
Oklahoma July maximum temperatures have dropped by two degrees since the 1930s, according to the recorded daily maximum temperatures from USHCN
McKibben likely also believes that CO2 weighs the same as a duck. It has always been hot in Oklahoma in July. McKibben is a fraudster spreading mindless superstition.
Posted in Uncategorized | 6 Comments

How The US Hockey Stick Was Built

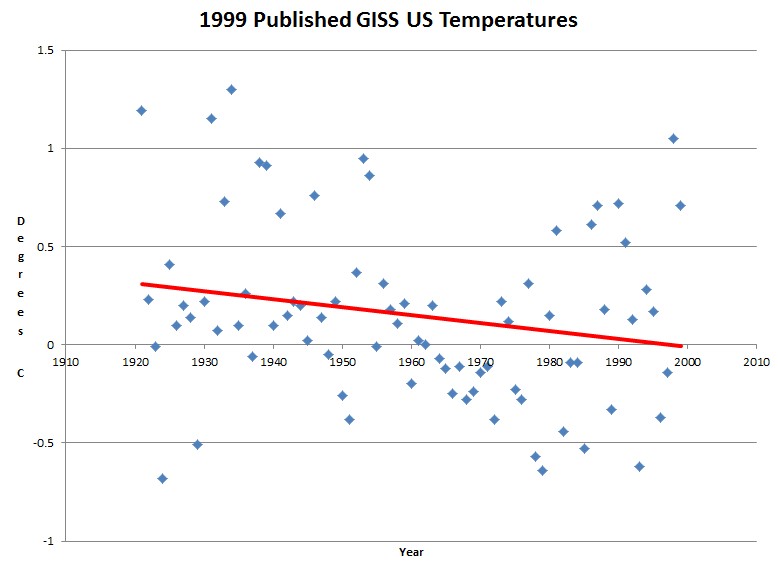
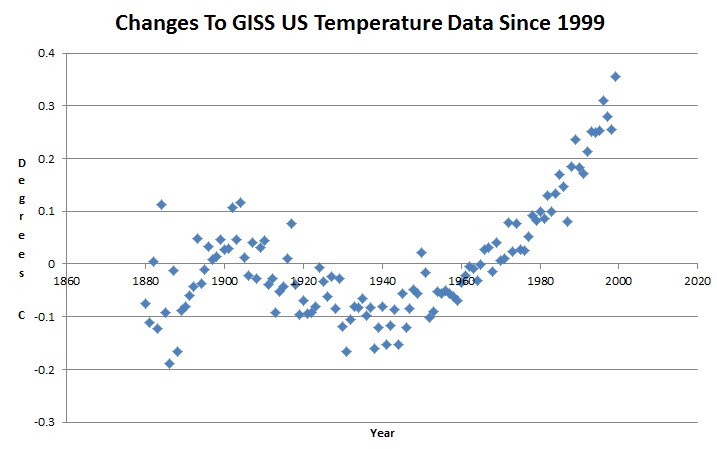
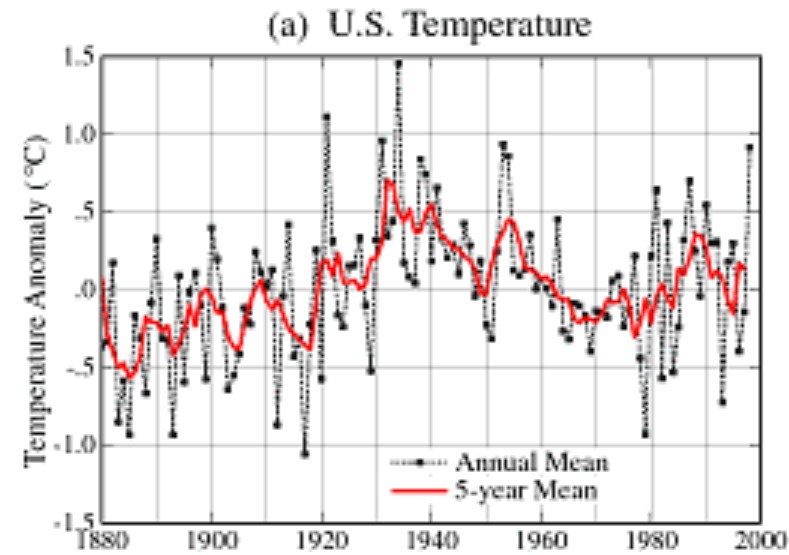
As of 1999, there wasn’t any warming in the US for 80 years.

Hansen made these remarkable comments in 1999 :

Empirical evidence does not lend much support to the notion that climate is headed precipitately toward more extreme heat and drought. The drought of 1999 covered a smaller area than the 1988 drought, when the Mississippi almost dried up. And 1988 was a temporary inconvenience as compared with repeated droughts during the 1930s “Dust Bowl” that caused an exodus from the prairies, as chronicled in Steinbeck’s Grapes of Wrath…..

in the U.S. there has been little temperature change in the past 50 years, the time of rapidly increasing greenhouse gases — in fact, there was a slight cooling throughout much of the country

NASA GISS: Science Briefs: Whither U.S. Climate?

At that time, GISS US temperature data showed an 80+ year decline in US temperatures, with 1934, 1921 and 1931 being the three hottest years

This data has been deleted from the GISS web site, but originally resided at this URL

gistemp/graphs/FigD.txt

It has been archived here :

www.john-daly.com/usatemps.006

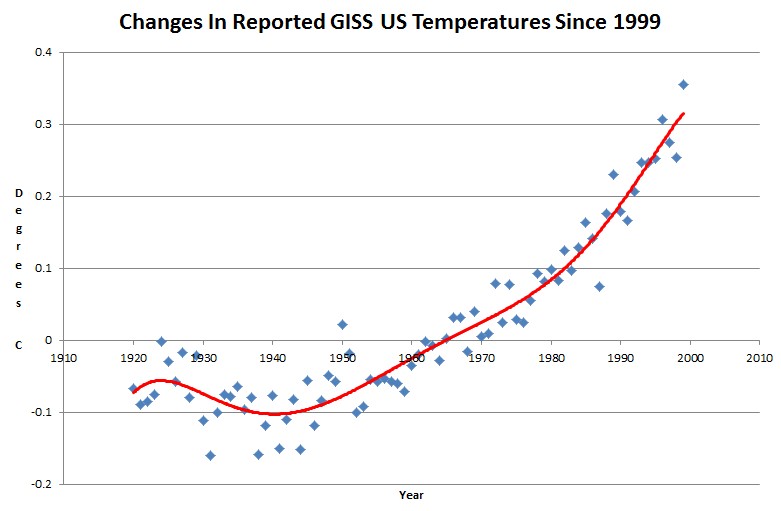
The next graph shows the 1920-1999 changes which Hansen made to the US temperature record since 1999 – in GISS version 3.

gistemp/graphs_v3/Fig.D.txt

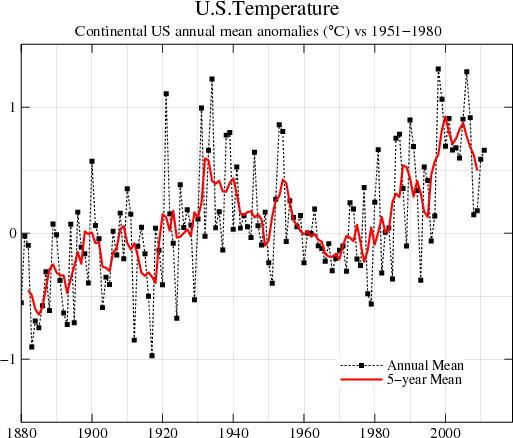
After adjustments, the GISS US temperature graph looks like this

Fig.D.gif (513×438)

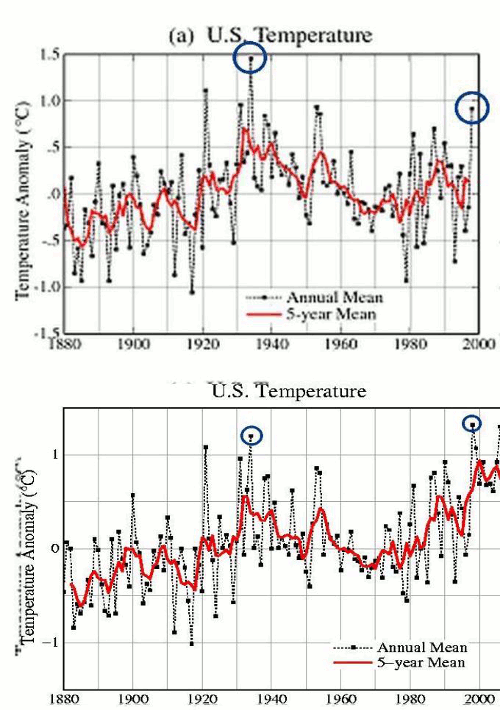
The next blink comparator shows the changes that were made to the US temperature data since 1999. The year 1998 was promoted from #4 to #1.

Hockey sticks are indeed man-made – by climate activists pretending to be scientific heads of government agencies.

Posted in Uncategorized | 12 Comments

GHCN : Messing With Texas – And Everybody Else

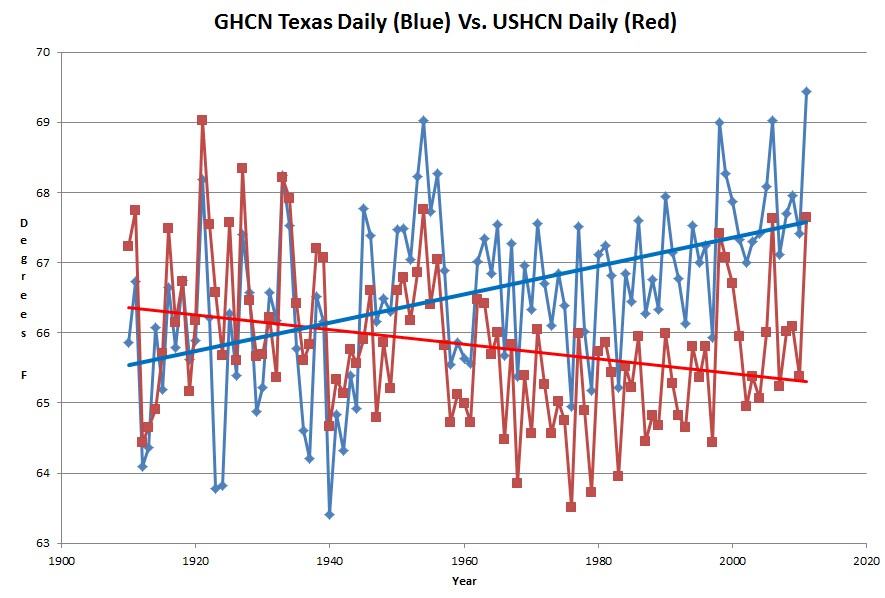
More evidence that the temperature record isn’t worth the toilet paper it was written on. The daily USHCN temperatures for Texas show a strong cooling trend, while the daily GHCN temperatures for Texas show a strong warming trend.

Somehow out of this spectacular mess we are supposed to believe that climate scientists can pin down a fractional century trend?

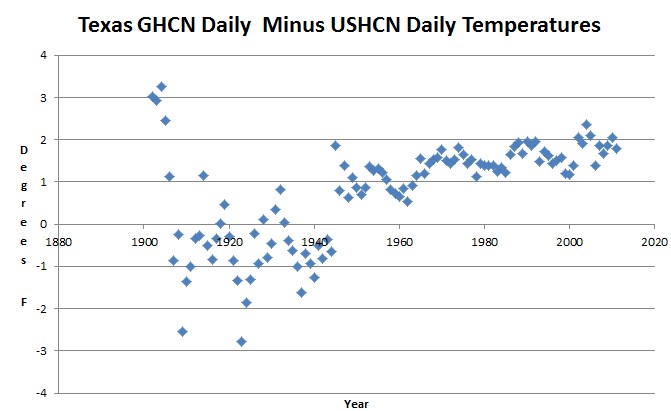
Below is the divergence between GHCN and USHCN daily temperatures in Texas.

Posted in Uncategorized | 8 Comments

“It’s hard to tell exactly what they’re doing at this point”

Many skeptics take issue with what they call systemic data manipulation. For example, climate blogger Steve Goddard told FoxNews.com that “adjustments” made in the past to climate data have merely conflated the problem Watts uncovered.

“They started making what they called corrections after the year 2000, which turned the U.S. temperature trend from completely flat to fairly steep warming. That’s what Anthony was questioning. The corrections were changing the temperature record,” Goddard said.

Several large adjustments hadn’t been documented at all, boosting readings by as much as 1.5 degrees over older measurements.

“It’s hard to tell exactly what they’re doing at this point,” he said.

Weather station temperature claims are overheated, report claims | Fox News

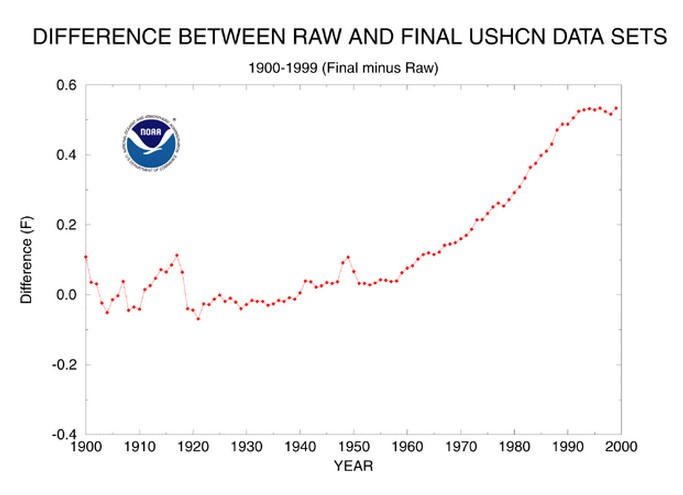
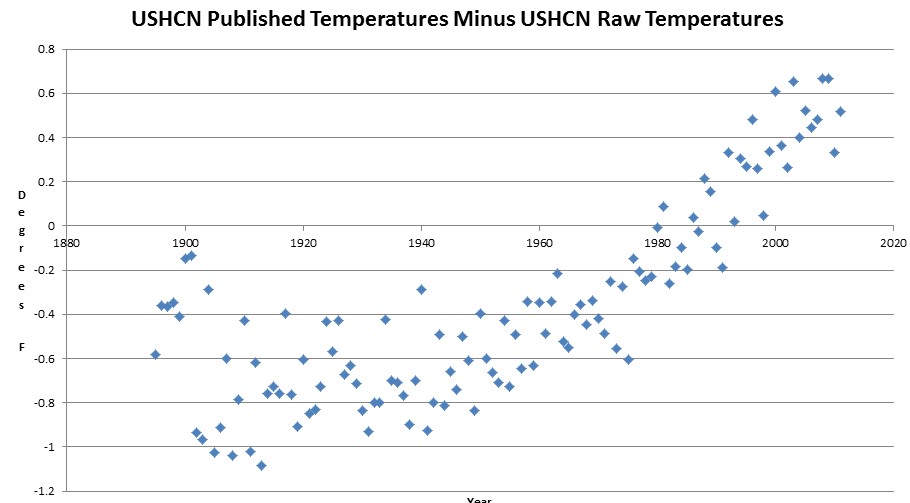
The published USHCN correction graphs show about 0.5F of data tampering, but I see closer to three times that amount.

ts.ushcn_anom25_diffs_urb-raw_pg.gif (650×502)

Whatever they are doing now, the adjustments are much larger than what they show in the graph above.

1999 Version

2012 Version

Posted in Uncategorized | 11 Comments

Now We Know Why Obama Won’t Release His Academic Records

Apparently he is unable to do simple mathematics

the Navy is spending $27 a gallon for fuel. The Air Force is spending $59 per gallon for biofuels.

And again, it takes more oil to create that biofuel than is produced in the process. So not only are they spending far more money, they’re wasting oil in order to spend that higher amount. Brilliant!

Vilsack: High Corn Prices Bad for Livestock, but Don’t Curb Ethanol

h/ to Dave G

Posted in Uncategorized | 21 Comments

The Devastation In The Aftermath Of Greenland Meltdown II

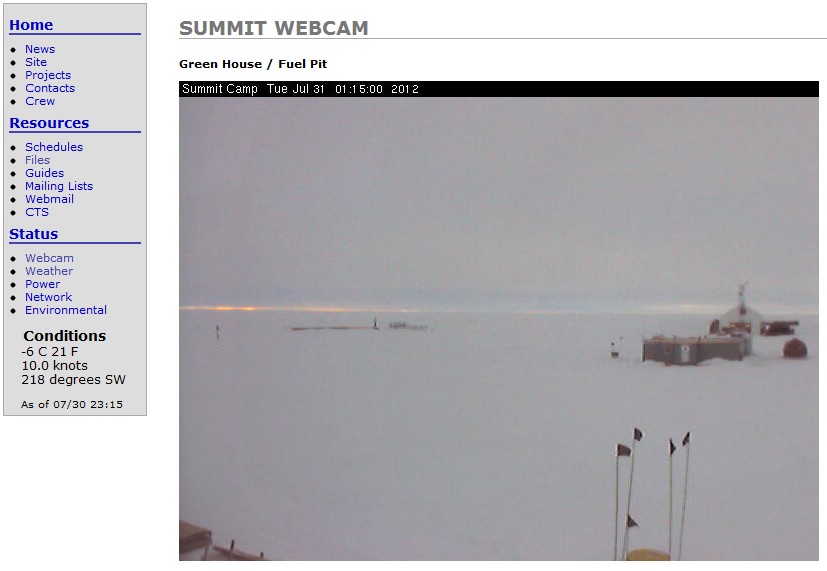
Temperatures got up close to freezing over the weekend, and several new inches of snow accumulated. This can only mean one thing in the eyes of NASA – civilization is doomed.

.

summit:status:webcam

Posted in Uncategorized | 11 Comments

Joe Bastardi Weighs In On The Watts-Muller Scuffle

Guest post by Joe Bastardi

———————————————————————————

My take on the  Muller- Watts situation.

1) Mullers niche was to sound at times skeptical of all this,so he trashed Manns study,making people say see.That leaves him to grab the reigns and appear to be the above board arbitrator of the AGW debate

Manns mistake, is he should have focused on open debate to defend what his study had.. come out swinging with his science not at people.   He shoul d confront the ideas that lead his detractors to question him. The courage of conviction would at least have him battling. Warriors  fight in battle, there is no battle without an antagonist standing on the other side of the mat.

That is not to say Mann would have won, but its what I wanted to see him do, defend his work. Sensing the void,  Muller trashed it, and took advantage by conducting his own study, but not with the baggage Mann acquired.  By appearing to be on the other side,  he was the cowboy in the white hat riding in to  settle the whole mess.

My position is we have the test in front of us, the way to measure it. As the leveling became apparent when the tandem of warm amo and pdo could no longer add heat, I made a forecast when the PDO flipped that a jagged retreat would start ( triple crown of cooling) and via objective satellite temps, we return to levels  seen in the late 70s by 2030. One thing, there is no rise to IPCC levels on the way in my scenario, and so far they are wrong, I am not

Continue reading →

Posted in Uncategorized | 40 Comments

GHCN Is Catastrophically Bad Data

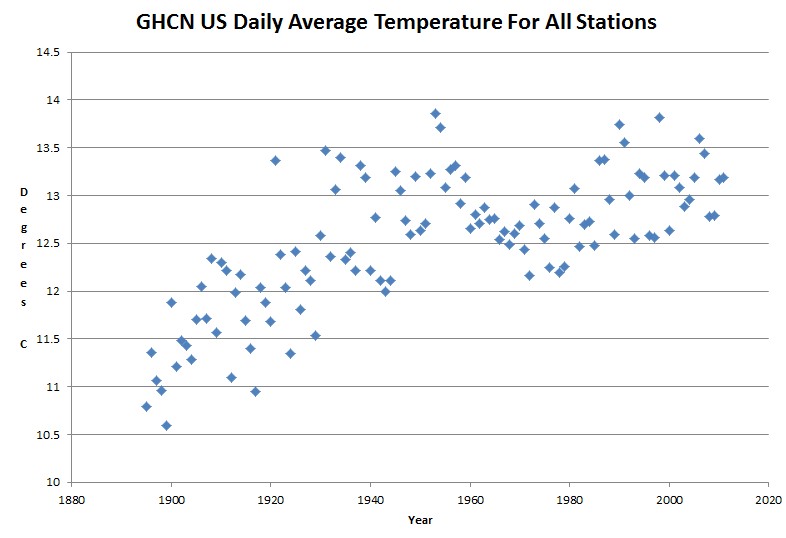
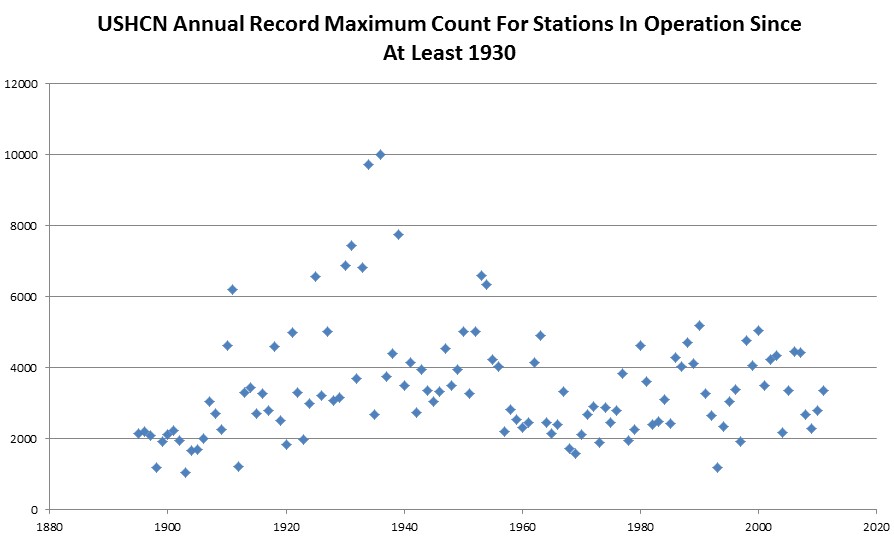
The GHCN US database has all the telltale signs of being complete garbage.  Check out these graphs. The 1930s never existed.

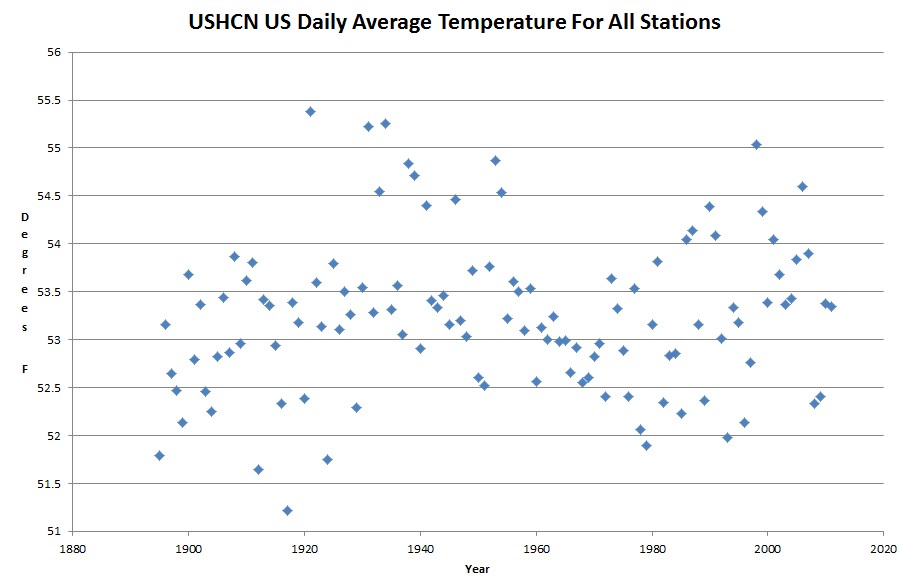
Now compare vs. the raw USHCN data, which show the 1930s as being the hottest decade.

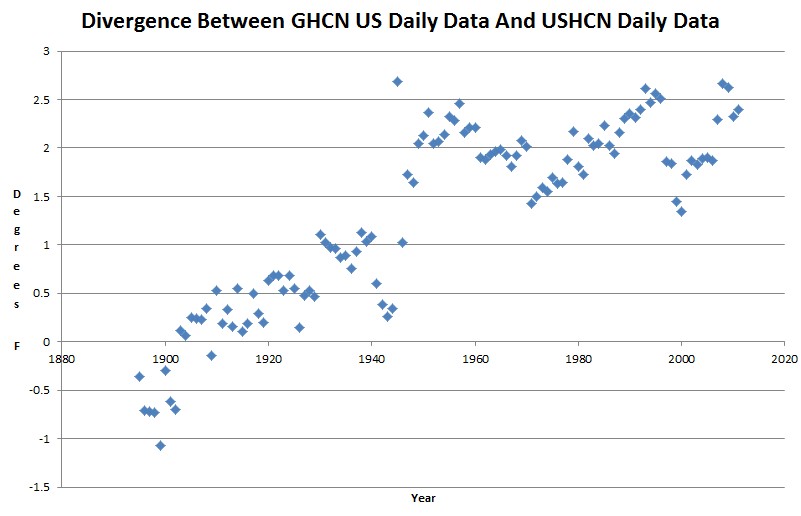
The divergence between GHCN US stations and USHCN US stations is massive.

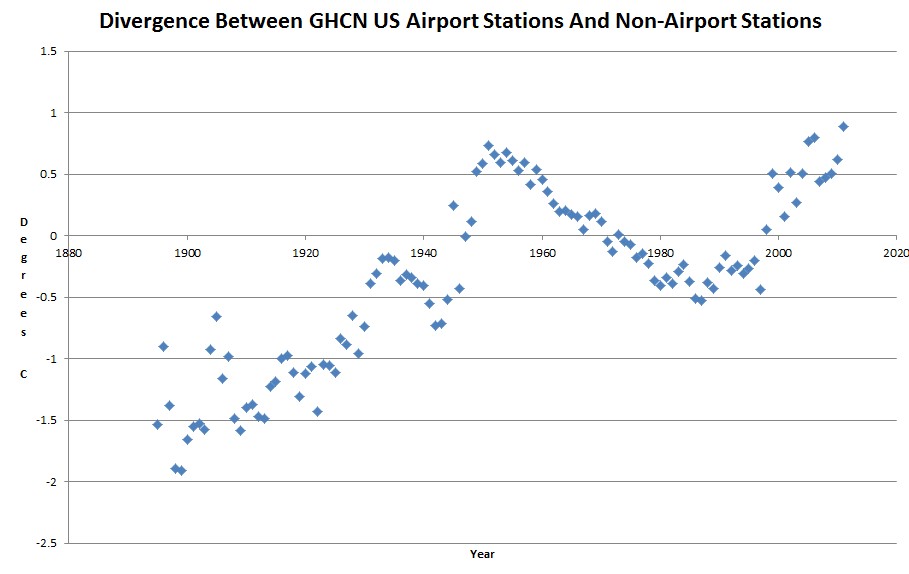
But the real kicker for me is the divergence between airport and non-airport stations. This has all the telltale signs of intentional data tampering in the GHCN database. Patterns like that with sharp inflection points can not happen accidentally. Did the physical  properties of airport stations radically change in 1950 and 1988? Something is seriously wrong with GHCN – which forms the basis of GISS.

Posted in Uncategorized | 15 Comments

New Reference Page

Your one stop shopping page for US Government climate data tampering

https://realclimatescience.com/data-tampering-at-ushcngiss/

Posted in Uncategorized | 1 Comment

Being Too Conservative?

I think Anthony’s paper was very conservative.

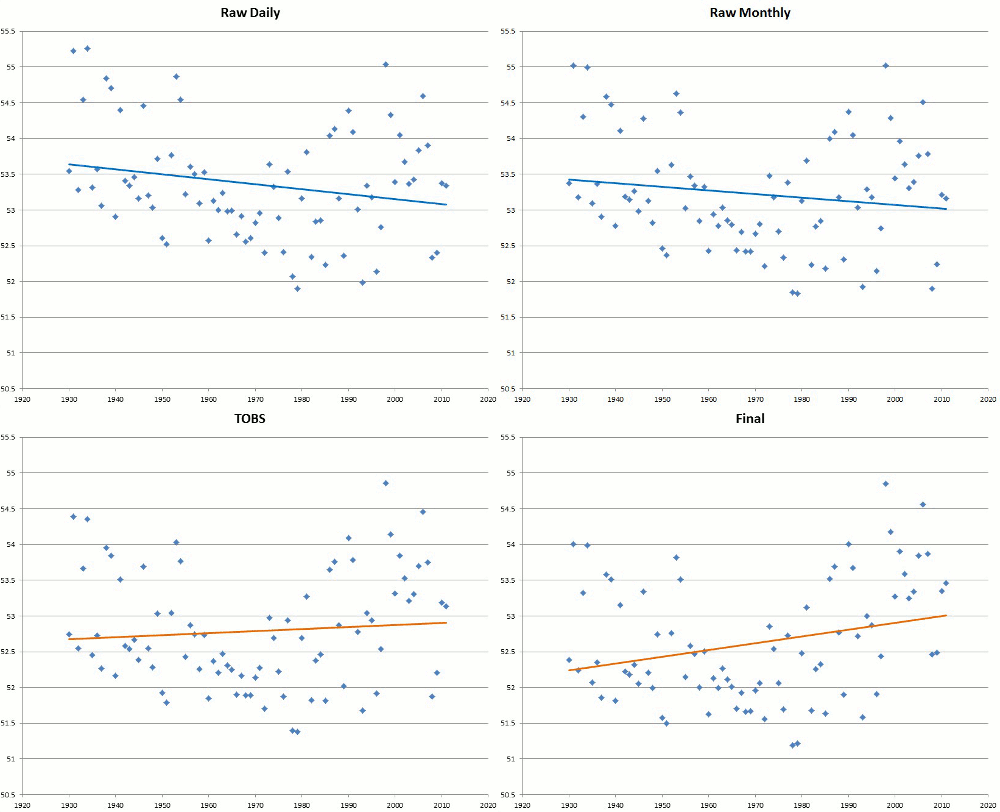
USHCN data tampering is much worse than he  indicated.  By messing with the data, the USHCN trend since 1930 is actually reversed from a measured cooling trend – to a warming trend.

Posted in Uncategorized | 12 Comments