Preparing For The Big NCDC July Fraud Event

The climate history deniers at NCDC are about to defile US history and announce that July was the hottest ever in the US – despite the fact that July, 1936 was much hotter.
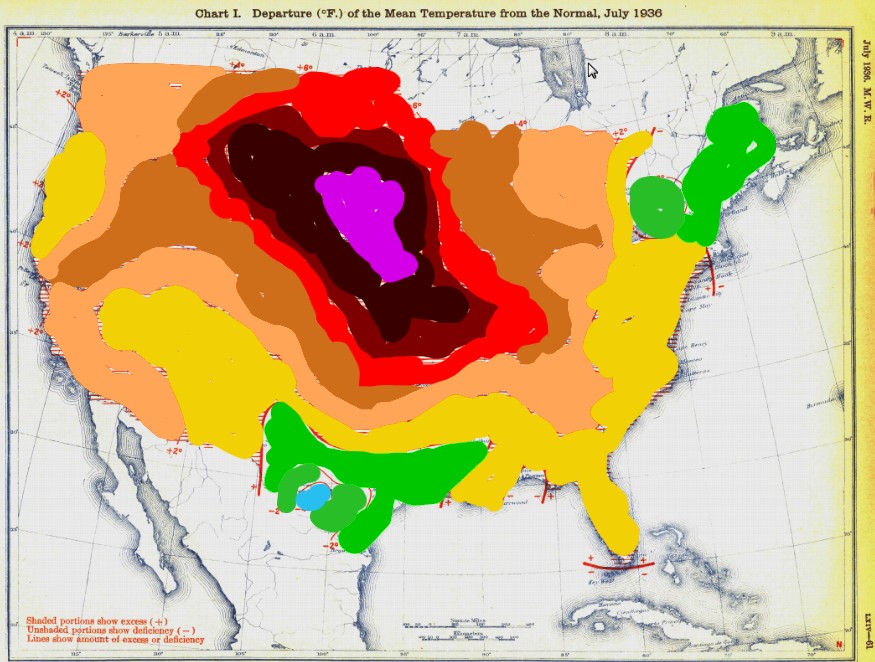
docs.lib.noaa.gov/rescue/mwr/064/mwr-064-07-c1.pdf

Compare the area of above normal temperatures

Deviation    1936    2012
+12            5%      0%
+10           10%     ~0%
+8            15%     <1%
+6            25%     15%
+4            65%     60%
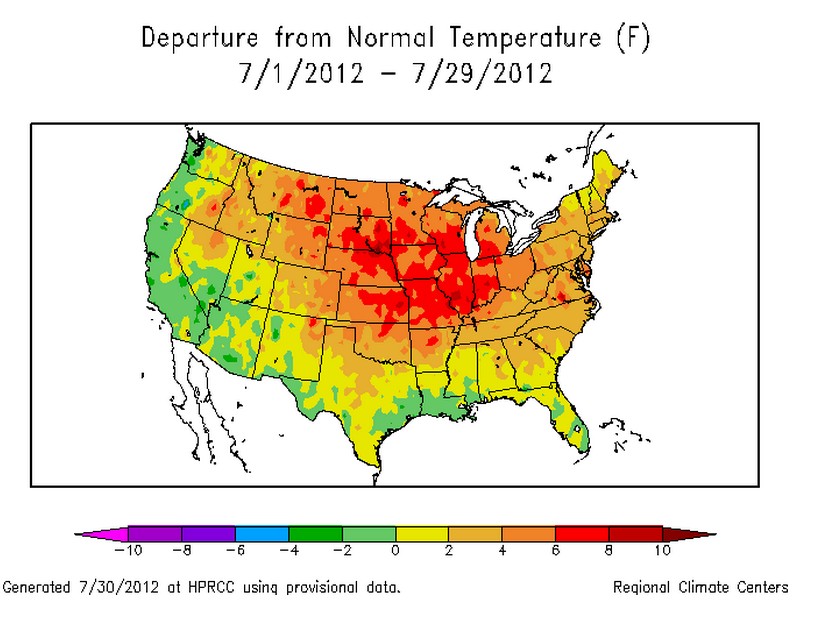
MonthTDeptUS.png (688×531)

This is pretty solid evidence that their data tampering has severely corrupted the temperature record.
Posted in Uncategorized | 11 Comments

Alarmist Mental Health Report Card : F–

During the last two weeks they went hysterical over a cyclical event which happens every 153 years in Greenland, and a claim by a “former skeptic” who told Huffington Post last year that he never was a skeptic.

Bottom line – these people are irrational and neurotic.

Posted in Uncategorized | 4 Comments

Extreme Weather Update : July Was The Quietest On Record For Both Hurricanes And Tornadoes

SUMMERTIME, AND THE TWISTERS ARE MISSIN’
JULY HEADS FOR A RECORD-LOW TORNADO COUNT
Bob Henson | July 24, 2012 • Heat and drought are punishing much of the United States right now, but there’s actually some good weather news to report. This month is on track to produce fewer tornadoes than any July on record, and by a long shot.

Summertime, and the twisters are missin’ | UCAR

There were also no hurricanes or tropical storms in the Atlantic during July.

Posted in Uncategorized | 9 Comments

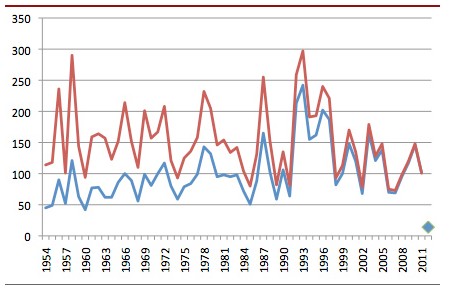
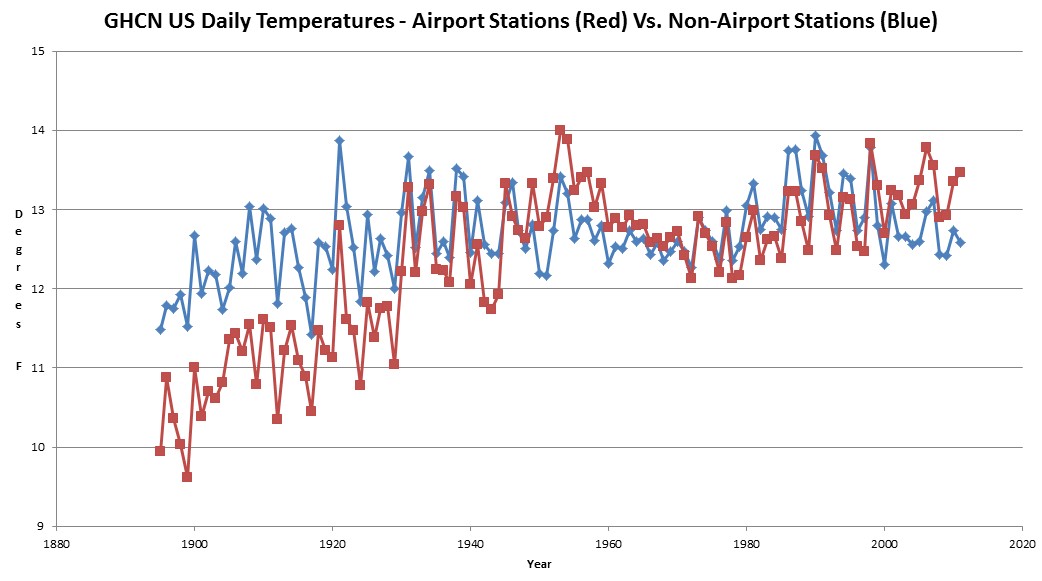
Airport Vs. Non-Airport US GHCN Stations Indicates UHI Contamination

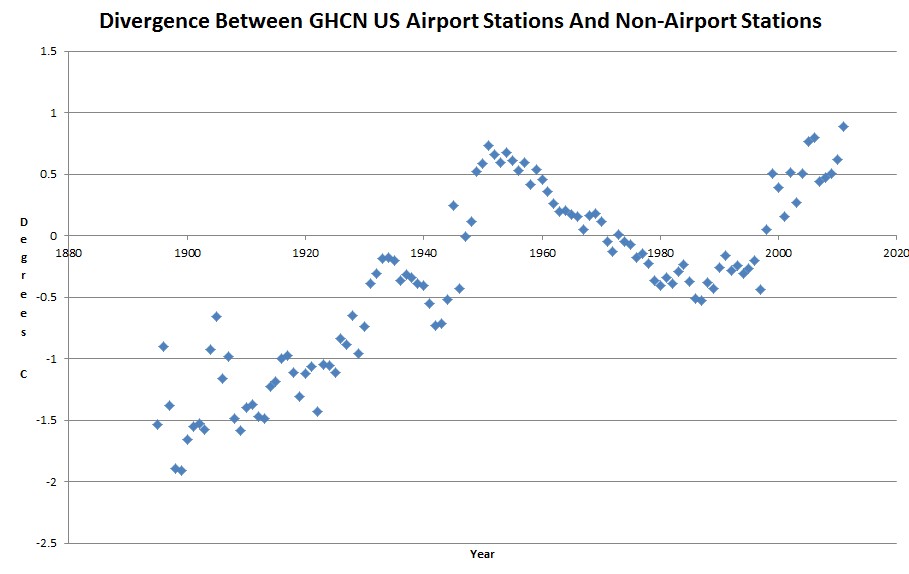
The GHCN US temperature record shows a large divergence between temperatures taken at airports, and those taken at the rest of the stations. This is most likely due to the introduction of pavement.

The first airplane flight was in 1903, so we can probably assume that most of the airport stations were very rural at the time – thus the much lower temperatures. As asphalt and pavement was added, the temperatures rose.

Next, look at the systematic divergence between the two data sets. What happened after 1990???

h/t to Michael D Smith for the suggestion.

Posted in Uncategorized | 15 Comments

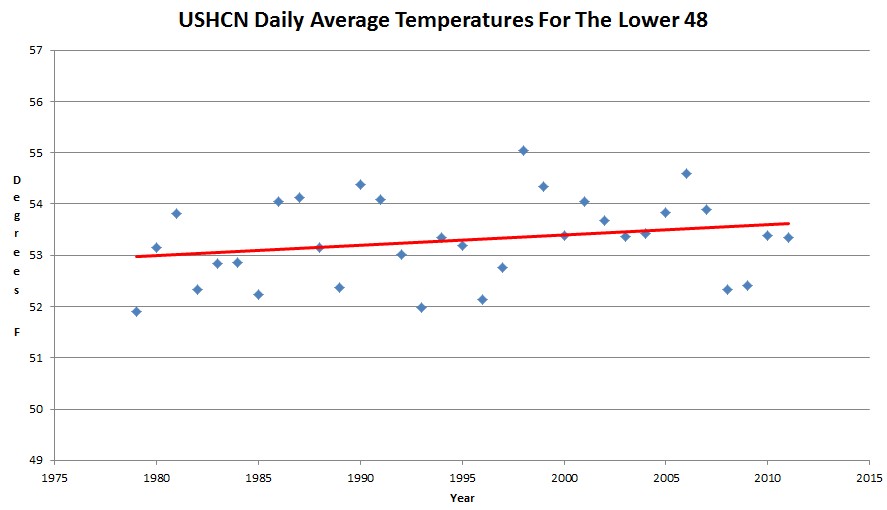
Raw USHCN Daily Data Shows 0.11 C Warming Per Decade Since 1979

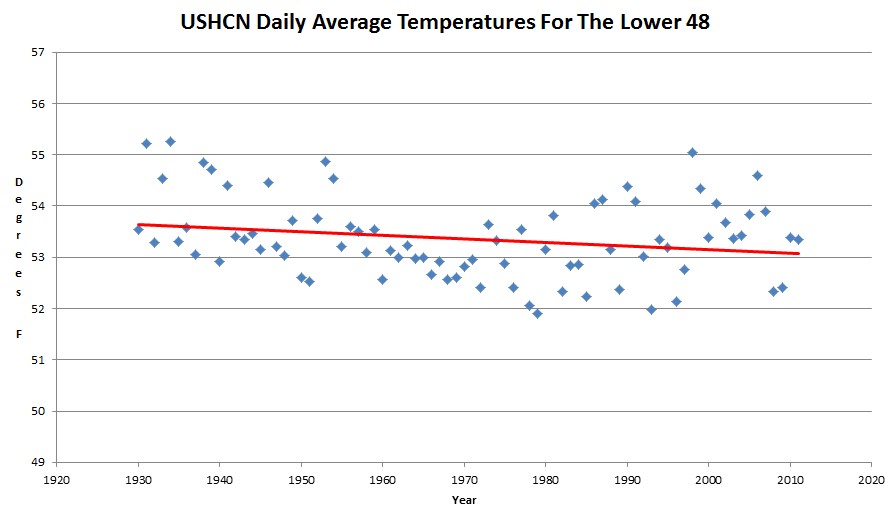
Starting in 1979 make no sense though, because it was the coldest year since 1924. If we start in 1930, the US is cooling.

Posted in Uncategorized | 12 Comments

Shock News : Anthony Reports That The Temperature Record Sucks – Mosher Disagrees

Posted in Uncategorized | 37 Comments

Times Atlas Vs. NASA

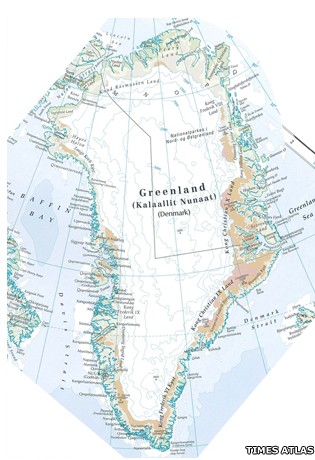
The Times Atlas got in trouble last year for publishing this bogus map of Greenland.

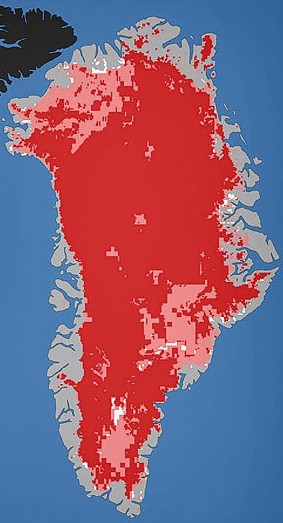
It turns out that they showed far too much ice. Recent maps from NASA indicate that all of the ice has melted.

NASA reports strange, sudden massive ice melt in Greenland

Published: Tuesday, July 24, 2012

Posted in Uncategorized | 3 Comments

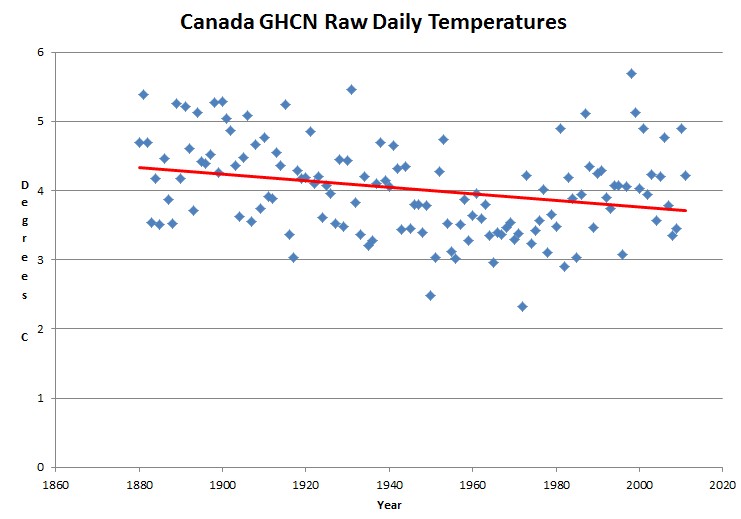
Global Cooling In Canada

GHCN raw daily data shows a cooling trend in Canada since 1880. Unlike the US, only a small percentage of the GHCN stations are located at airports.

Posted in Uncategorized | 11 Comments

Has The Freezing Point Of Water Changed?

I have found hundreds of news stories describing the melting of the Arctic between 1900 and 1940, as well as abundant evidence that Arctic ice expanded during the 1970s.

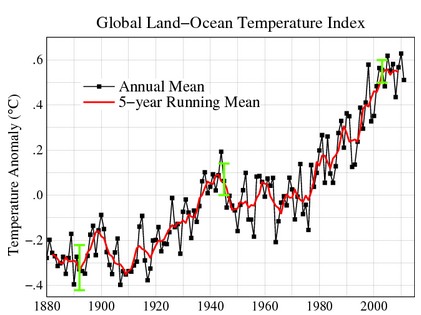
Unless the freezing point of water has changed, the earlier period must have been warmer. Yet when we look on Hansen’s graphs, it appears that the period from 1900 to 1940 was much colder than the 1970s.

Data.GISS: GISS Surface Temperature Analysis: Analysis Graphs and Plots

It doesn’t matter how beautiful your theory is, it doesn’t matter how smart you are. If it doesn’t agree with experiment, it’s wrong. Richard P. Feynman

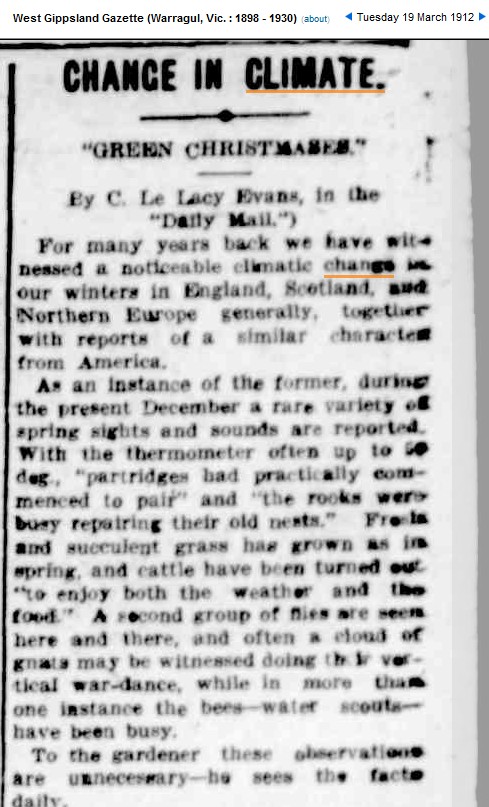
Hansen shows 1912 as being one of the coldest years on record, but people who were living at the time saw a world which was completely different from Hansen’s fantasy graphs.

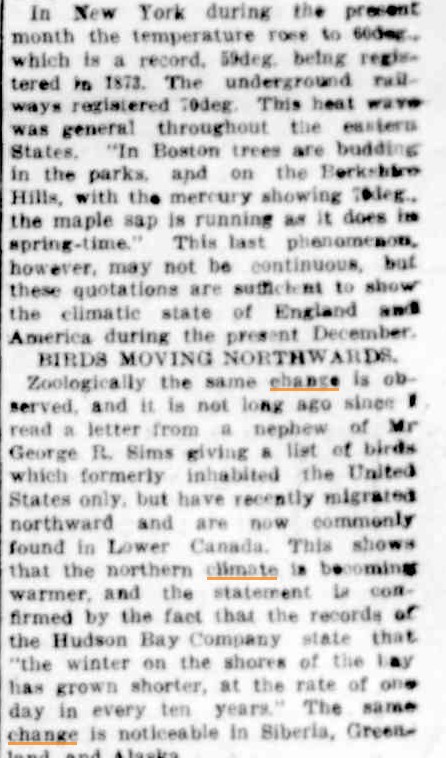
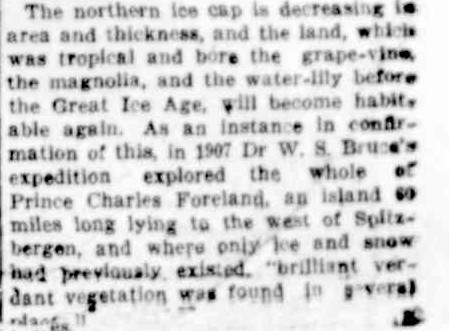
19 Mar 1912 – CHANGE IN CLIMATE. “GREEN CHRISTMASES.”

Posted in Uncategorized | 30 Comments

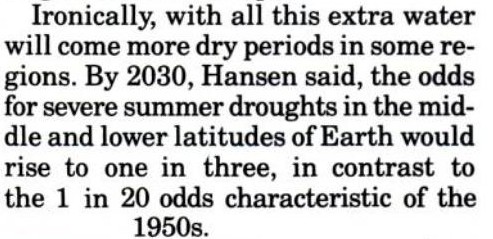
Hansen: Incompetent At Elementary School Math

Popular Science – Google Books

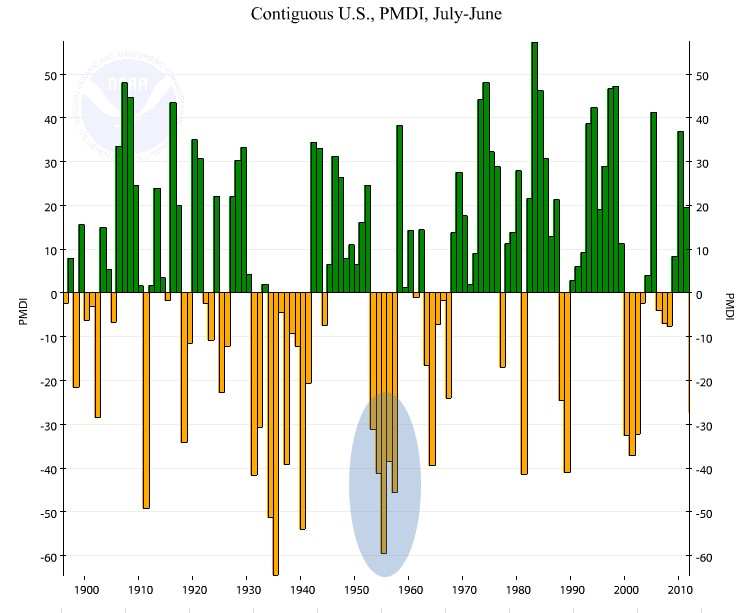
Half of the years in the 1950s had severe droughts. Hansen was off by a factor of ten in his calculation.

Contiguous U.S., Palmer Modified Drought Index (PMDI), July-June 1896-2012

The Guardian calls him the world’s greatest climatologist – because he is spectacularly incompetent.

Posted in Uncategorized | 14 Comments