1931 : Third Hottest Year In US History – Before The Data Was Tampered With

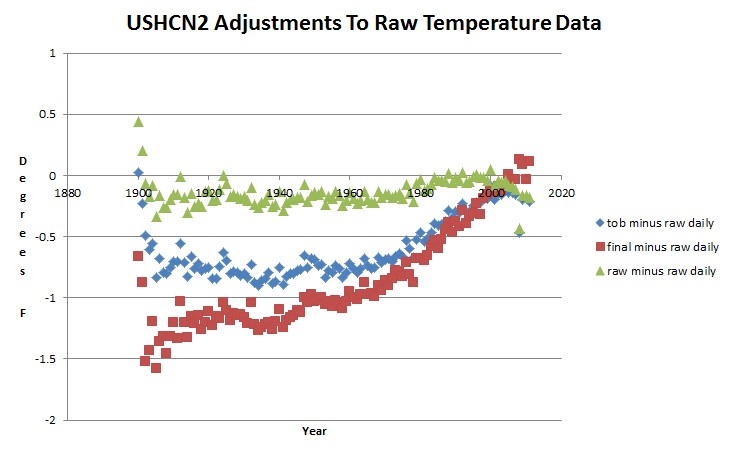
According to the thermometers in the USHCN database, 1931 was the third hottest year on record in the US – after 1921 and 1934.

USHCN then adjusts 1931 temperatures downwards by a remarkable 2.51 degrees, before they publish it. The year 1931 had 708,317 valid thermometer readings, but somehow Tom Karl and James Hansen have recently determined that this huge body of data averaged 2.51 degrees too high. (This is the same James Hansen who can precisely calculate the temperature in the high Arctic, without a single thermometer reading  north of 80N.)
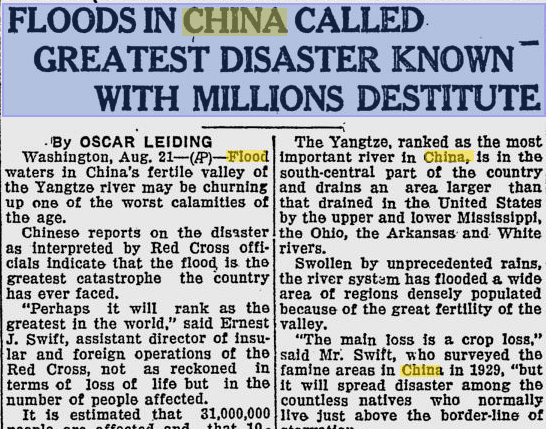
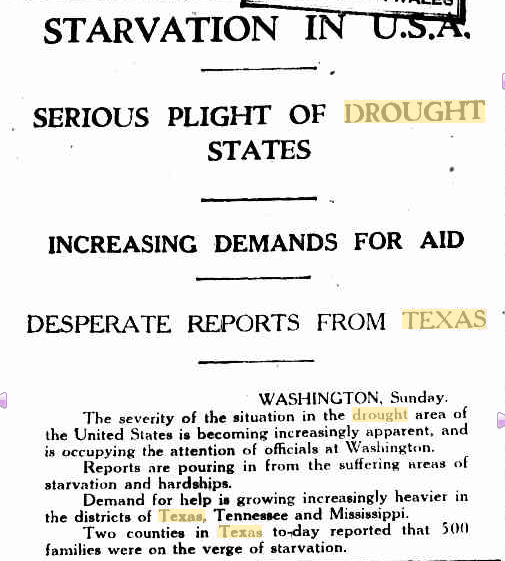
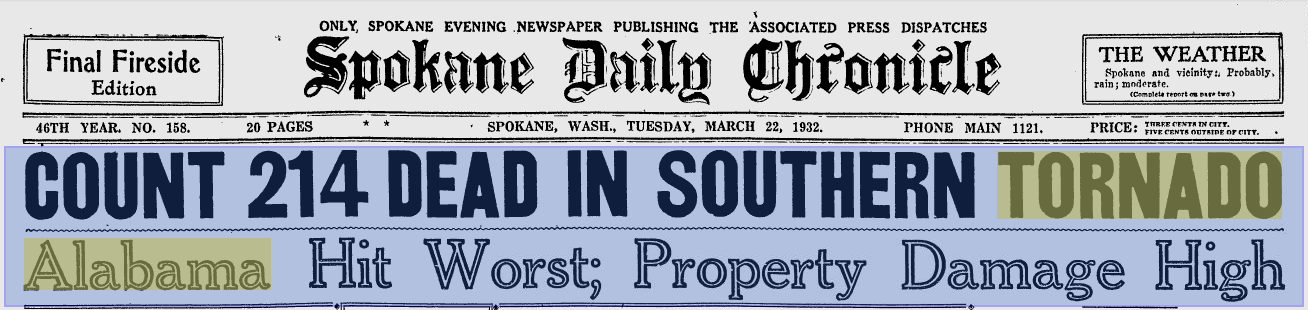
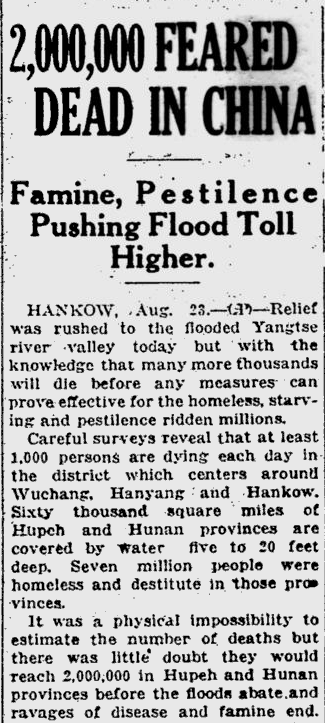
So what else was going on in 1931?

 Below350.org

 Below350.org

http://news.google.com/newspapers
 Below350.org

 Below350.org

http://trove.nla.gov.au/

 Below350.org

 Below350.org

http://news.google.com/newspapers
 Below350.org

http://news.google.com/newspapers
Continue reading →

Posted in Uncategorized | 5 Comments

Proof That We Need To Accept A Primitive Lifestyle And A Totalitarian World Government

Lots of comments coming from people pointing out the obvious to me.

This summer has seen some hot weather in places, as well as thunderstorms, a tree blowing over in front of the Capitol Building,  and a 30 degree drop in Maryland temperatures in a few hours.

How much more evidence could I possibly require to voluntarily go back to the dark ages?

Posted in Uncategorized | 16 Comments

Boris Listens To Piers – Forecasts Olympic Washout

Do you really want to know what the augur Corbyn foresees for the Opening Ceremony of the Olympic Games? Brace yourselves. “We’re very confident that there will be a lot of rain – a deluge, really – during the entire Olympic period, and we are 80 per cent sure that the Opening Ceremony itself will feature heavy rain, including hail and thunder.”

To avoid the Olympic weather forecast, please look away now – Telegraph

Boris used to be a warmist – apparently the  near 100% failure rate of the Met Office has turned his head.

Posted in Uncategorized | 5 Comments

USHCN Springtime Adjustments

A reader wrote :

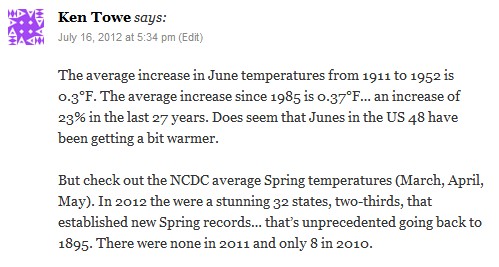
July 16, 2012 at 5:34 pm

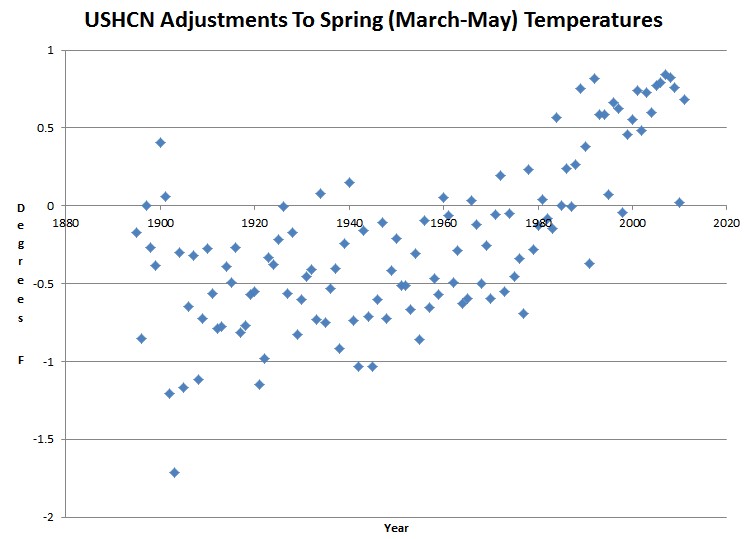
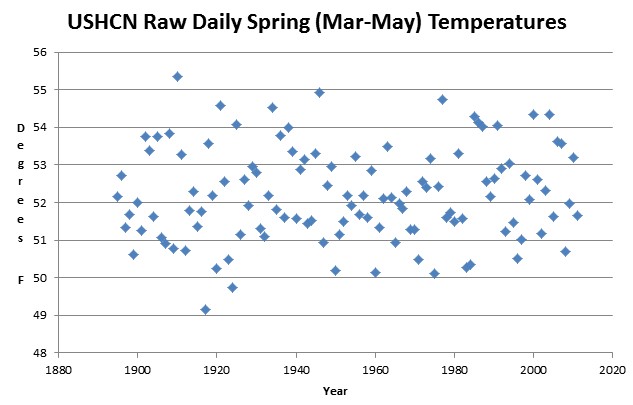
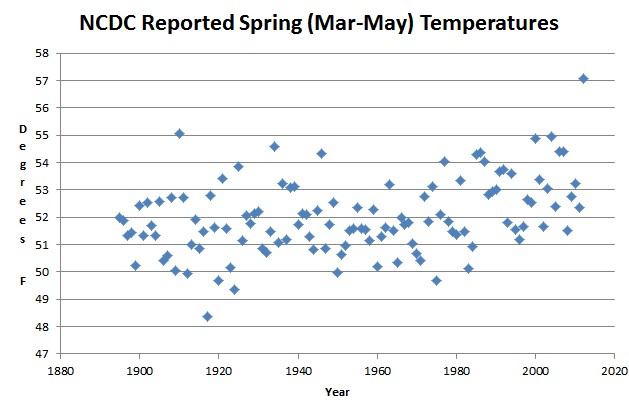
This got me interested to see what USHCN was doing to springtime temperatures.  The graph below is what NCDC reports.

So I calculated the adjustments they did through 2011 vs. the raw daily data. Stunning indeed! They added about two degrees on to recent temperatures relative to 100 years ago.

The spring of 1934 was probably just a warm as spring 2012, but the data has been so severely altered, that the NCDC graphs are meaningless garbage

The raw graph (calculated from daily data) is shown below. 2012 is not included because that data is not available yet.

Note the similarity between the adjustment graph, and Hansen’s temperature graph in the article below this one.

Raw data below :

Continue reading →

Posted in Uncategorized | 8 Comments

Hansen Correctly Identifies Himself As The Cause Of Global Warming

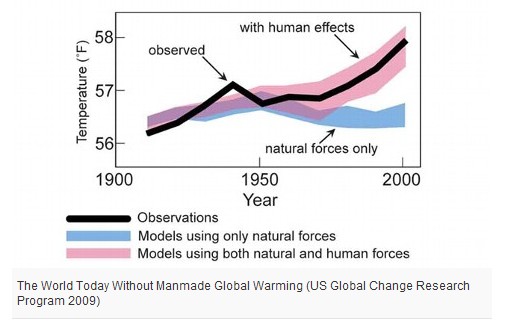
It’s Simple: Global Warming Is Causing the Extreme Weather – ABC News

The human effects in the graph above are largely Hansen adjusting the data.

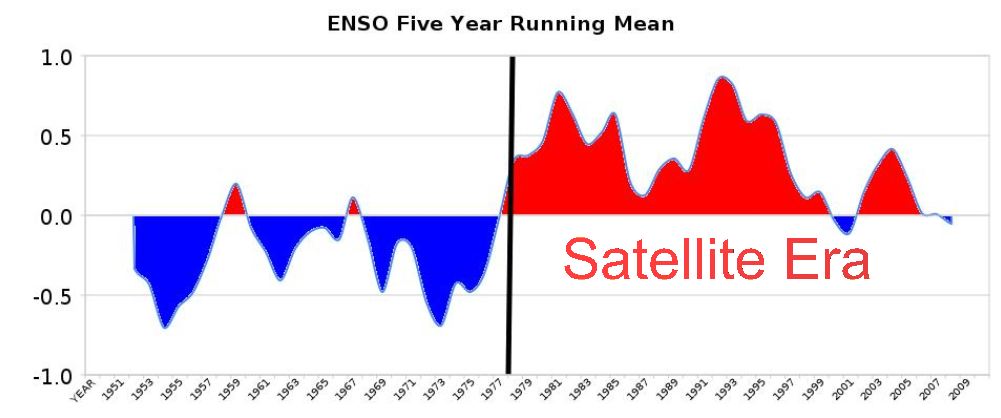
As far as the natural forces go, Dr. “Super El Nino Hansen tells us every year that El Ninos make the world hot, then he fails to recognize that the high ENSO values from 1977 to 2007 were the cause of the warming which did occur.

Hansen science seems to have become 100% confirmation bias and spin.

Posted in Uncategorized | 5 Comments

NOAA Tampered Data Vs. Raw Data

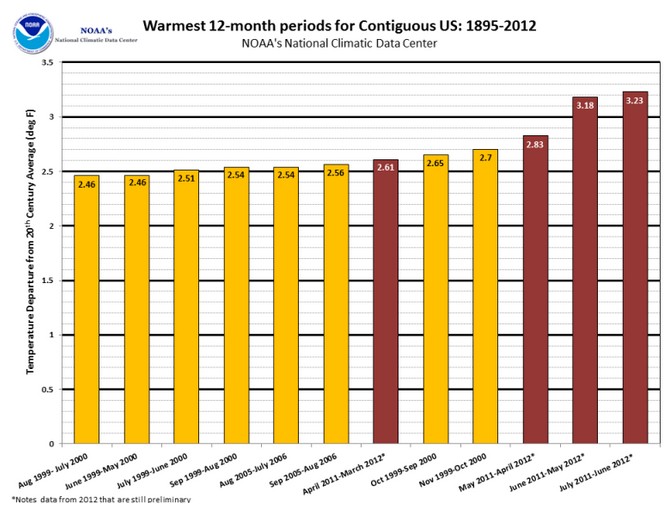
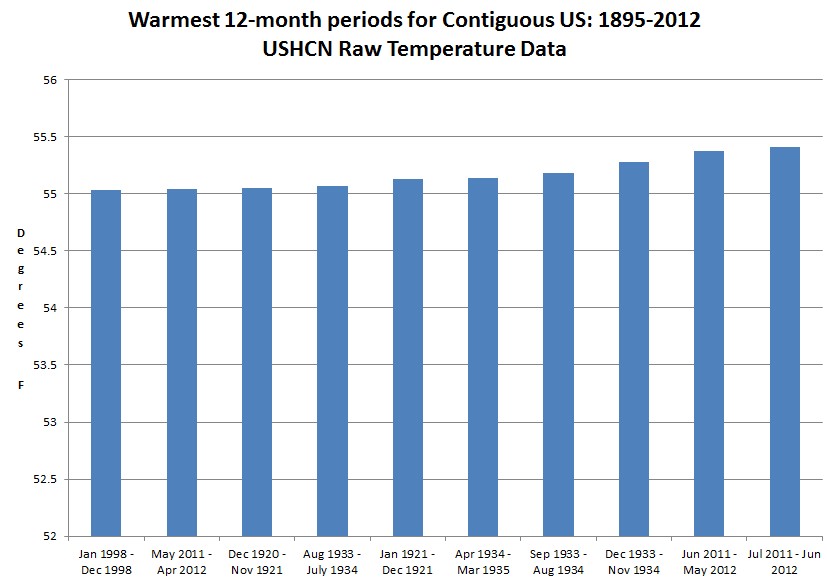
The graph below is the NOAA propaganda version, generated from massively adjusted temperatures.

June 2012 National Overview | Supplemental Material | Warmest 12-month consecutive periods for the CONUS

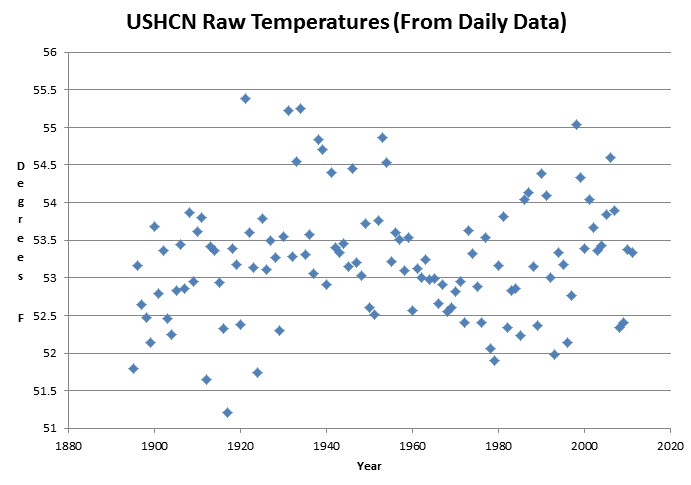
The next graph is what the actual USHCN thermometer data shows – a completely different story.

The recent data is upwards adjusted by 300% of the signal they are claiming to detect, indicating a signal to noise ratio of about 0.3 – i.e completely worthless data which no respectable scientist would use.

Posted in Uncategorized | 3 Comments

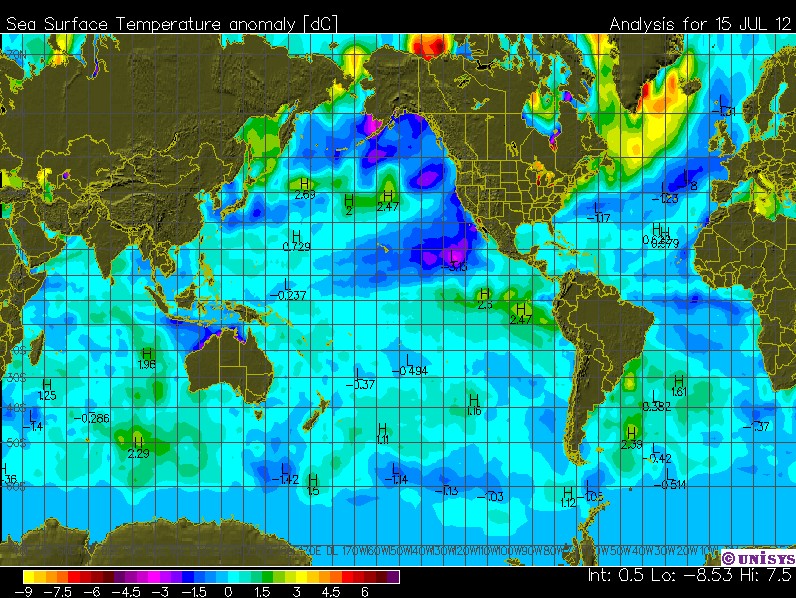
Stillborn El Nino?

The 2012 El Nino is looking pretty sickly at this point.

sst_anom.gif (800×600)

Posted in Uncategorized | 12 Comments

Top Twenty USHCN2 12 Month periods

The USHCN2 “raw” monthly temperature data shows that the period ending June, 2012 is the hottest twelve month period on record in the US, beating 1934 by a little over 0.1 degrees.

This may be bogus, because the 1930s USHCN2 monthly “raw” data is about 0.2 degrees lower than the daily raw data.” For example, the monthly data shows 11/1934 as 55.281, but the daily data shows it as 55.4316  – which would make the period ending 11/1934 the hottest 12 month period on record.

Most of the hottest 12 month periods in the USHCN2 database occured during the 1930s. USHCN2 only goes back to 1895, and does not include the 1884/1885 warm period which the daily temperature records show was the hottest.

With cooler temperatures prevailing now, it is unlikely that the raw full year 2012 will beat 1934.

Month	 Year	 Temperature 
6	2012	55.4049
5	2012	55.3776
11	1934	55.281
8	1934	55.1797
3	1935	55.1331
12	1921	55.1261
7	1934	55.0692
11	1921	55.0463
4	2012	55.0413
12	1998	55.0358
10	1934	54.9995
1	1932	54.999
12	1934	54.9941
12	1931	54.988
5	1934	54.9688
10	2000	54.9686
2	1932	54.939
2	1935	54.9334
4	1999	54.9253
6	1934	54.9238
Posted in Uncategorized | 5 Comments

The 50 Hottest 12 Month Periods In Illinois History

Month   Year    Temperature												
9	1921	56.604														
5	1932	56.5879														
12	1921	56.4855														
6	1932	56.4764														
8	1921	56.4331														
2	1932	56.4313														
8	1932	56.382														
11	1921	56.3732														
1	1932	56.3582														
7	1932	56.3444														
7	1921	56.2751														
4	1932	56.187														
10	1921	56.1813														
3	1932	56.1789														
12	1931	56.1366														
1	1939	55.8532														
1	1922	55.8125														
9	1932	55.7769														
6	1921	55.7655														
3	1935	55.5998														
4	1954	55.5075														
2	1922	55.5068														
11	1931	55.4315														
5	1921	55.3695														
9	1954	55.3597														
10	1932	55.3459														
12	1938	55.3423														
4	1935	55.3042														
12	1998	55.3014														
1	1947	55.2904														
3	1942	55.2253														
4	1942	55.1974														
8	1954	55.1777														
7	1954	55.1751														
2	1954	55.1458														
2	1939	55.1436														
11	1934	55.1234														
12	1946	55.1227														
1	1923	55.1187														
5	1954	55.0905														
10	1954	55.0703														
11	1953	55.0563														
11	1938	55.0488														
4	1921	55.0466														
2	1992	55.0254														
10	1953	55.0228														
11	1998	55.0182														
6	1954	55.0114														
8	1934	54.9915														
12	1953	54.9867
Posted in Uncategorized | 7 Comments

The US Was Much Hotter In The Past

We have been bombarded this week with claims that the last 12 months were the hottest on record in the US. I can’t verify that claim yet, but I did calculate the same metric through the end of 2011.

The table below shows the top 25 hottest twelve month periods in the USHCN daily raw temperature database, through the end of 2011, which is the last date available. Records only get counted if they have valid data for the previous 12 consecutive months.

All of the 25  hottest twelve month periods occurred before 1936, except for one in 1998.

Month   Year    12 Month Average Temperature
1	1885	55.778
11	1934	55.4316
12	1884	55.3907
8	1934	55.3385
11	1884	55.3222
10	1884	55.2937
3	1935	55.2907
2	1885	55.2879
12	1921	55.2135
7	1934	55.2126
10	1934	55.1559
12	1934	55.1296
11	1921	55.1279
12	1931	55.1152
1	1932	55.1064
5	1934	55.1029
3	1885	55.0813
2	1935	55.071
6	1934	55.0658
2	1932	55.0404
9	1934	55.0215
12	1998	55.0111
5	1932	54.9886
9	1921	54.9852
4	1935	54.9837
Posted in Uncategorized | 2 Comments