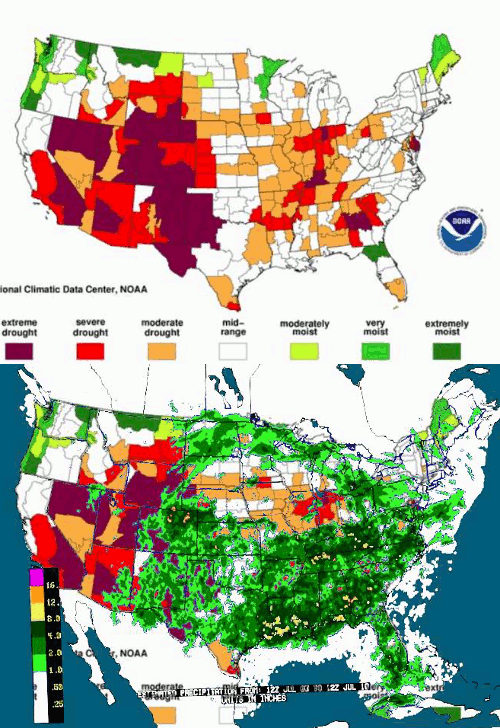
One thing we know for sure – is that political activists posing as scientists have tampered with the temperature database.
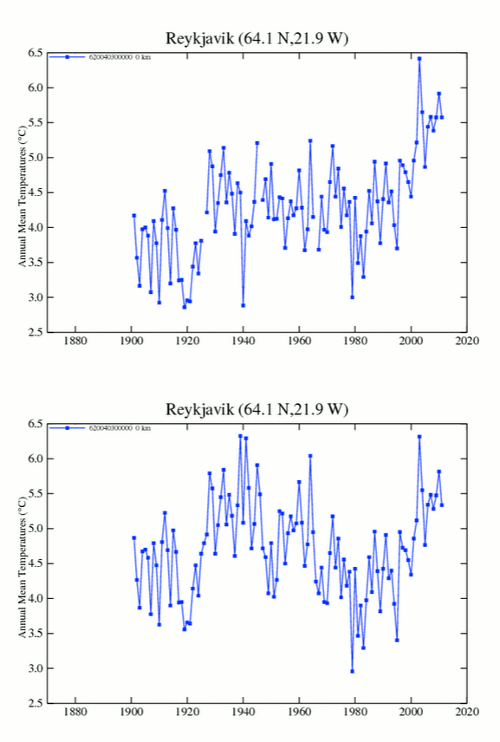
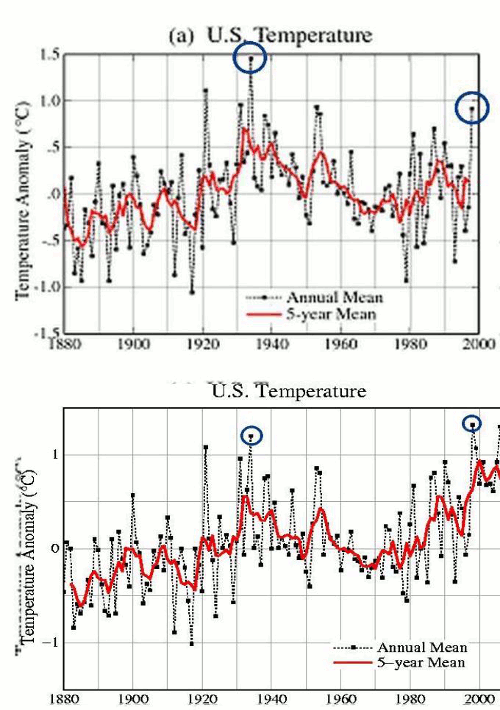
One thing we know for sure – is that political activists posing as scientists have tampered with the temperature database.

During the last ice age, temperatures were below normal for 1,200,000 months in a row. The odds of this happening randomly are 2 raised to the 1200000 power, or some phenomenally large number.
Thank you climate experts for opening up a whole new world of junk statistics.
From team climate moron, comes this news – being touted by two of Texas’ most clueless.
U.S. heat over the past 13 months: a one in 1.6 million event
U.S. heat over the past 13 months: a one in 1.6 million event | Planet3.0
The way the statistical midget calculated this was by assuming that the odds of each month were one out of three, so he raised 3 to the thirteenth power and came up with 1.6 million.
Now I am going to apply the same math to the ice age scare of the 1970s. In 1974, the CIA reported that Eastern Canada had been below normal for 19 months in a row.

www.climatemonitor.it/wp-content/uploads/2009/12/1974.pdf
The odds of being below normal are one out of two. So if we raise two to the nineteenth power, we can conclude that the global cooling of the 1970s was a one in 524,288 event, colder than the last three or four ice ages! No wonder Hansen had to erase it!
These folks are dumber than a sack of rocks.
Alarmists like Jeff Masters have been touting the useless statistic of the ratio of record highs to record lows as a sign of global warming. The graph below shows why it is useless.
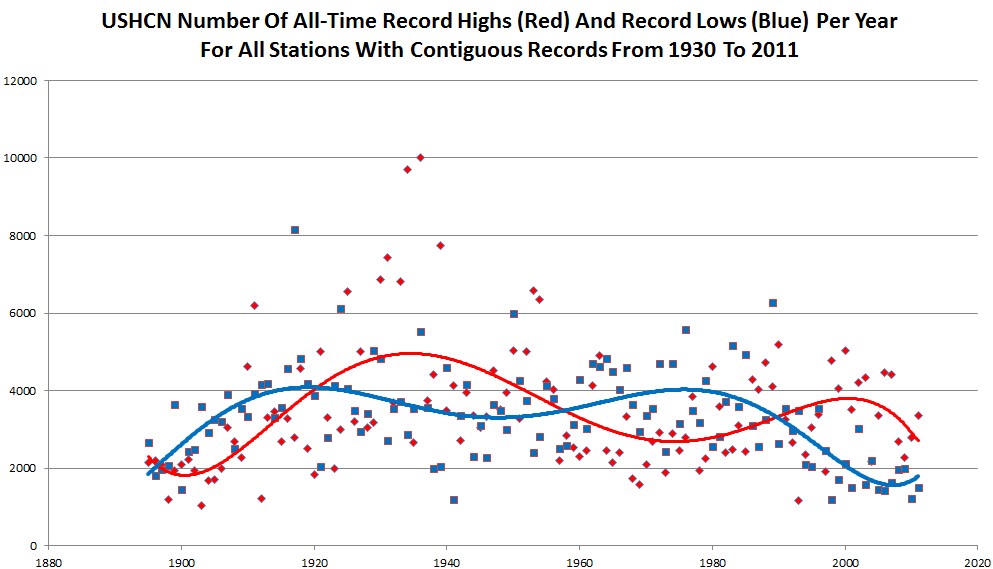
The graph plots yearly counts of all of the daily all-time record highs and lows in the USHCN database, for all stations which were operating in both 1930 and 2011. A station is marked as having a record if it has the highest temperature reported for any year, or tied for the highest temperature.
The lines are sixth order fits. The first thing that stands out is that the number of record maximums and minimums has tailed off markedly in the last 70 years. Also, the signals are very noisy, and appear to be cyclical and converging.
It is a testament to how poor the science is, that experts would take one small set of data points from one small geographical location, without any historical context, and draw conclusions about “global warming.”
These people are more ignorant and more superstitious than the witch burning crowd in The Holy Grail.
“. . . [Presently] we’re breaking high temperature records much more frequently than by chance. And, by some estimates, the ratio of that exceedance of breaking highs compared to what you would expect by chance would lead to us say to that there’s about an 80 percent chance that the record high you experienced was due to climate change.
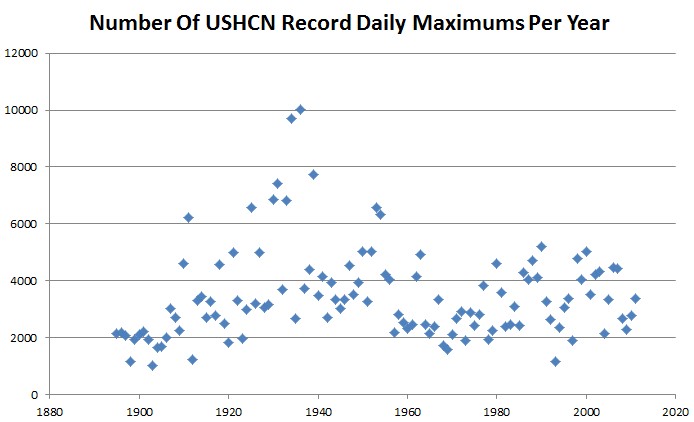
Complete nonsense. According to USHCN temperature records, the 1930s holds a wide lead for all-time daily record maximums in the US. There is zero evidence that “climate change” has increased the probability of setting temperature records.
During the week of July 8 through July 14, 1913, high temperatures averaged 129 degrees at Greenland Ranch, California. On July 10 the temperature reached 134 degrees.
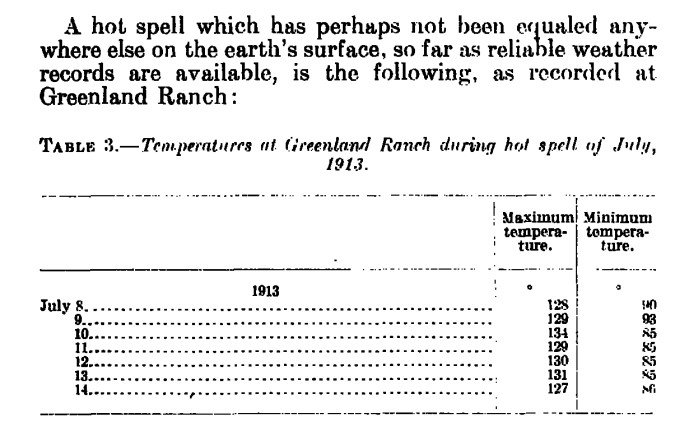
docs.lib.noaa.gov/rescue/mwr/050/mwr-050-01-0010.pdf
August, 1913 also had the hottest daytime temperatures in Oklahoma history, with an average high temperature of 106.4 at Oklahoma City for the month.
Meeker Oklahoma USHCN Temperatures
Month    Year   Average Max   Mean   Average Min
August   1913         106.4   89.5          72.2
August   1936         105.8   90.1          73.7
July     2011         101.9   89.0          75.6
Experts tell us that 100 degree temperatures in 2012 would be impossible without global warming.
NOAA claims that Oklahoma during July 2011 was the “hottest month in US history.”
Turns out it wasn’t even the hottest July in Oklahoma history. The raw data shows that both July 1936 and July 1956 were hotter than July 2011.
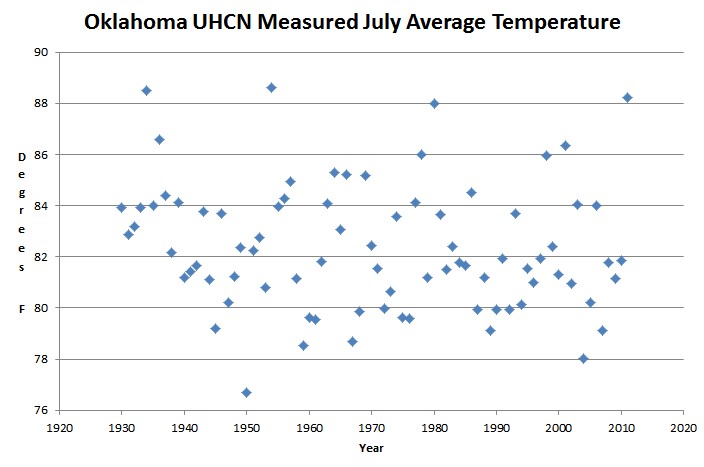
http://cdiac.ornl.gov/ftp/ushcn_daily/state34_OK.txt.gz
But it is worse than it seems. August 1936 was also hotter in Oklahoma than July 2011.
NOAA’s hottest month in US history was actually beaten by at least three months which occurred when CO2 was below 320 ppm. They are using garbage data to prove a garbage theory.
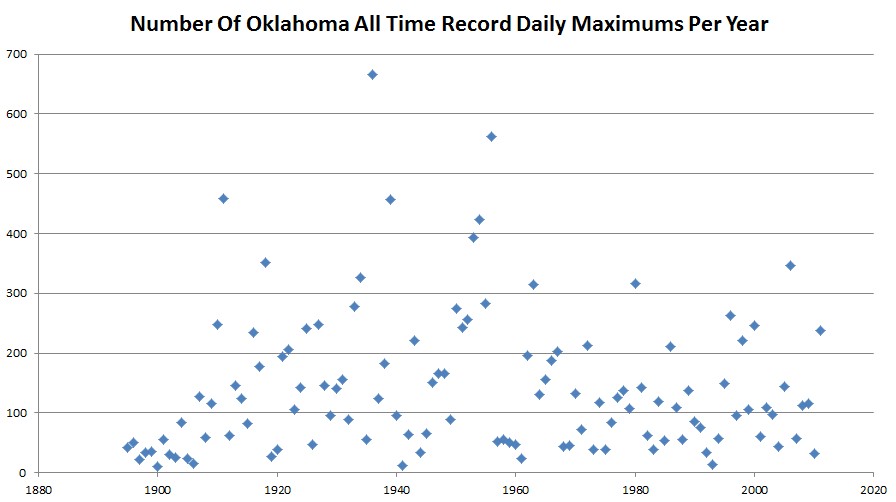
http://cdiac.ornl.gov/ftp/ushcn_daily/state34_OK.txt.gz
The two biggest years for Oklahoma all-time record maximum temperatures were 1936 and 1956. By contrast, 2011 was not much above average.
All years which share a record maximum get counted in the graph above, so there is no bias in either direction.
Like almost all the other states, USHCN has been progressively cooling the past and warming the present. This allows them to turn an inconvenient cooling trend into a warming trend.
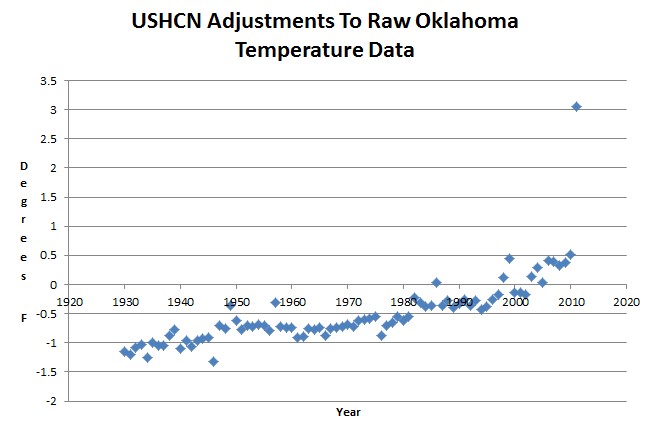
2011 has more than three degrees added on to it. This is actually not as bad as it seems. The reason for the big jump is that they lost several stations after March, and as a result had an excess of winter temperatures relative to summer temperatures.