The Great Oklahoma Fraud Of 2011

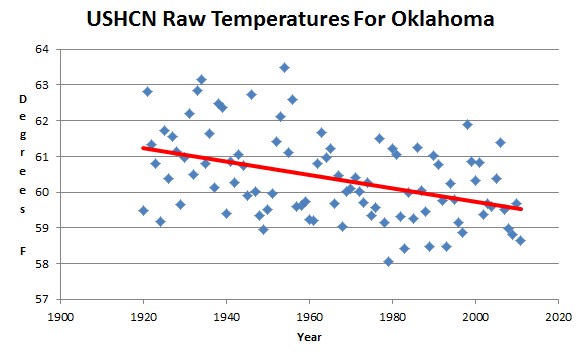
Last year we were told that Oklahoma was the hottest place ever recorded in the US.

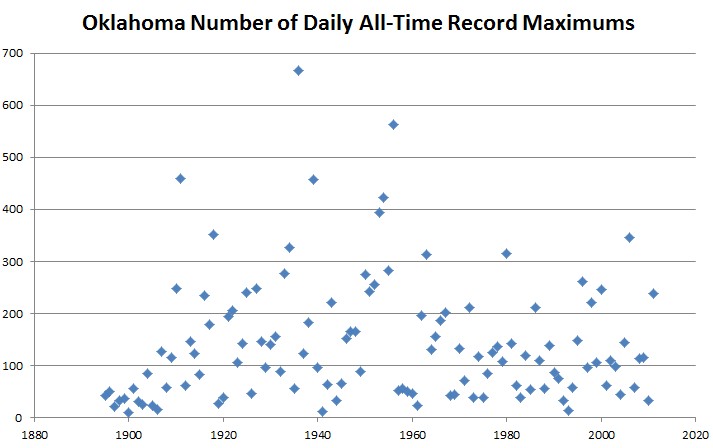
It turns out that the raw USHCN data for Oklahoma shows that it was the fifth coldest year on record, and that record maximums didn’t even rank in the top ten.

http://cdiac.ornl.gov/ftp/ushcn_daily/state34_OK.txt.gz

Posted in Uncategorized | 3 Comments

Texas 2011 Revisited

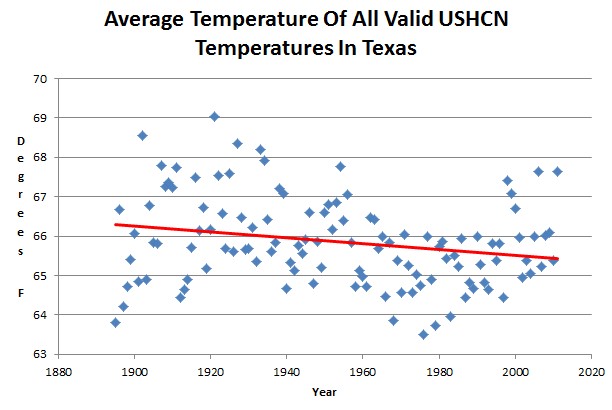
The mass media hysteria about Texas in 2011 was absurd. Average temperatures didn’t rank in the top ten.

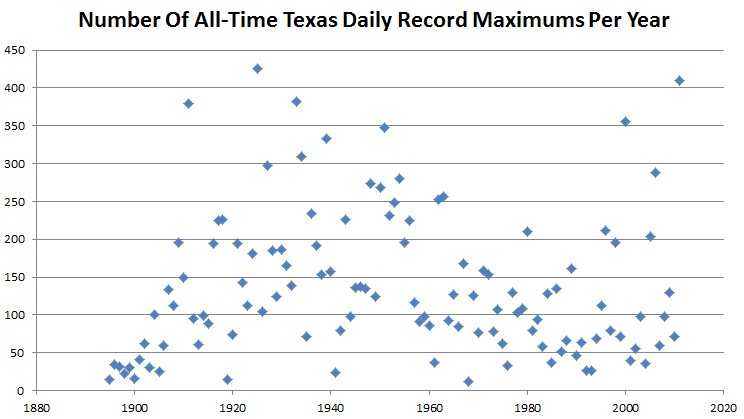
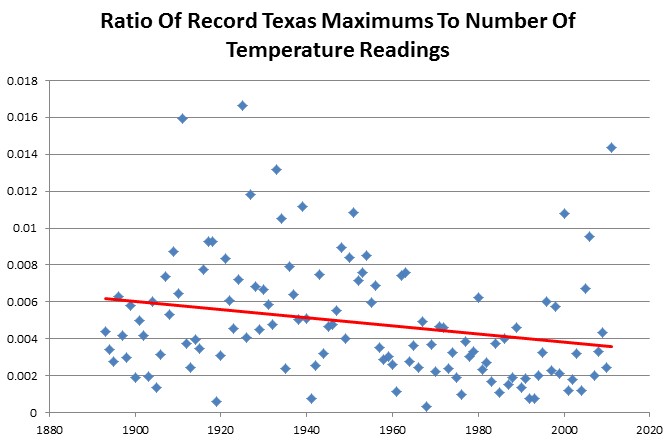
The number of record maximums dis not match 1925.

Normalized by the number of measurements, record maximums in Texas are in sharp decline.

Posted in Uncategorized | Leave a comment

One Year Anniversary Of The Andrew Dessler Permanent Drought In Texas

One year ago today, Andrew Dessler of Texas A&M University declared that Texas was in a permanent drought and heatwave.

Get used to it. The weather of the 21st century will be very much like the hot and dry weather of 2011. Giving extra credibility to this forecast is the fact that the weather extremes that we are presently experiencing were predicted in the first edition in 1995.

Texas is vulnerable to warming climate – Houston Chronicle

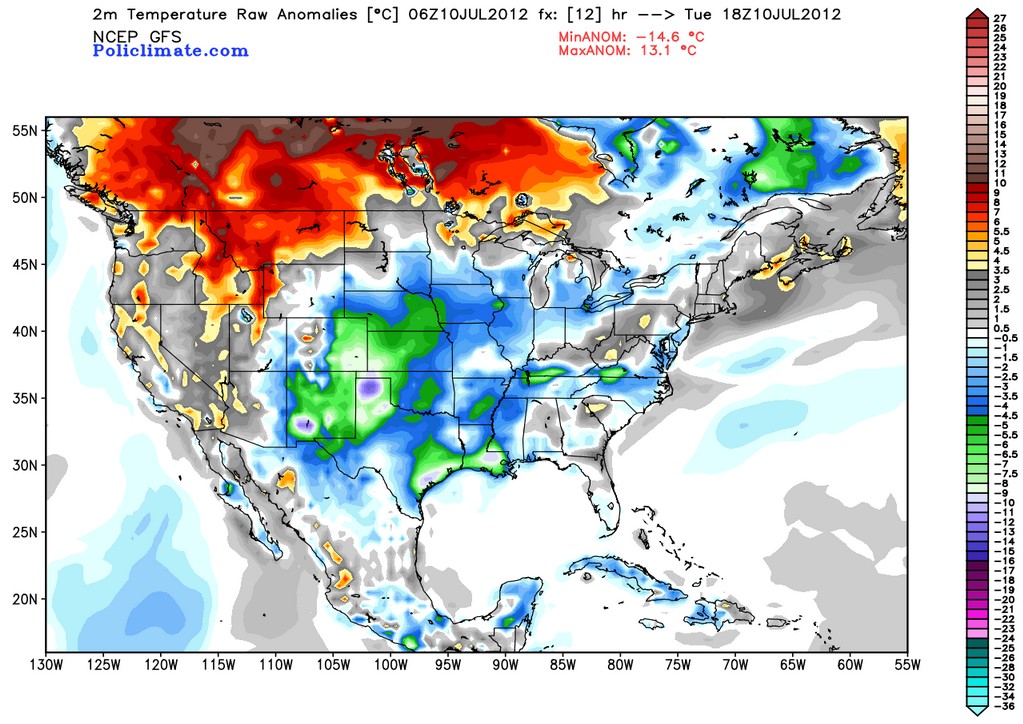
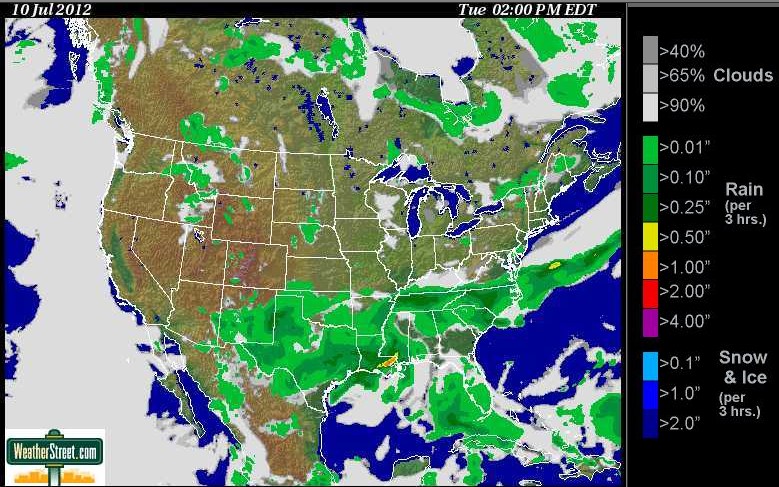
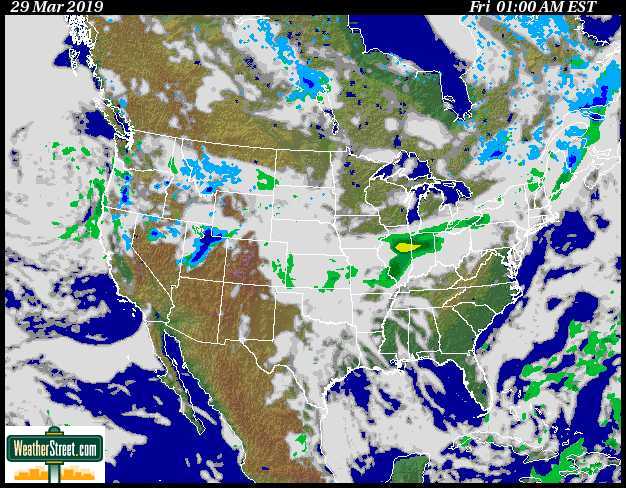
So how are Dessler’s weather extremes looking one year later? West Texas is forecast to be about 12C below normal today, with heavy rain across the entire state.

http://policlimate.com/weather/current/gfs_t2m_anom_usa_c_3.png

http://www.weatherstreet.com/data/SPC_018.jpg

Posted in Uncategorized | 3 Comments

Dumberer And Dumbererer

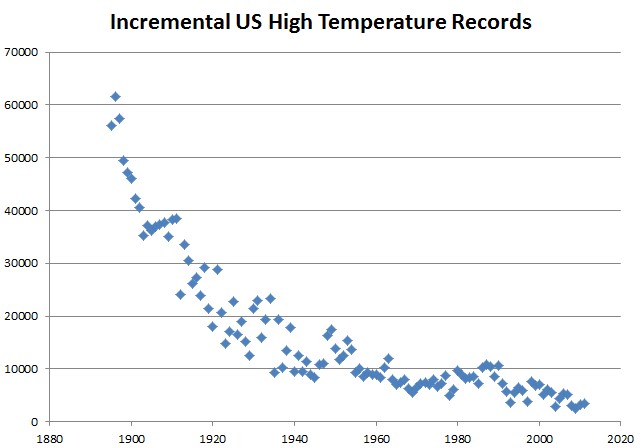
Yesterday, after I posted the US temperature record graphs, a number of geniuses started accusing me of calculating incremental records – i.e. during year one, every station sets a record on every day, etc.

Just for fun, I did that calculation and plotted it out below. It is completely meaningless and obviously not what I presented.

The graph below is the unbiased version, where all years which share an daily all-time record get counted.

Posted in Uncategorized | 5 Comments

Joe Bastardi Positively Correlates The Climate To Football Results

Guest post by Joe Bastardi

————————————————

I am using my own alma  mater here so I can  not be accused of trying to  beat down other schools. But I think after looking at this, other schools that have great football teams with meteorology  programs, and we are loaded in the  Big Ten, will have to do some soul searching  as to their contribution to Human caused Global warming.

The facts:

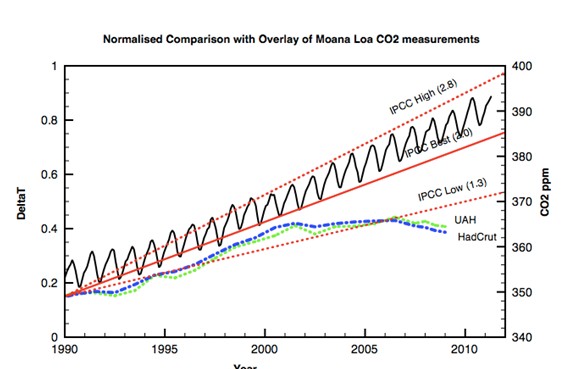
While  researching for my  book “How football affects the climate”,  which I plan to put out to  try to outsell recent books on the climate fight, I have discovered that Penn State football may actually have been controlling the enso during the Paterno era.  How can I possible say that. Well if someone can tell me, you and the rest of the world that co2 is in charge of the climate,  given this factual data, and that the IPCC and climate models are correct even though  the are obviously busting( below)

Then I can sure as the sun rises make the case, that if you look at the  MEI  signal and then  look at Penn States  greatest football teams, there is certainly a stronger relationship. This could lead to even more grant money  pouring into schools,  to find out if their football program is also part of the Human caused climate catastrophe that we are all hearing about.

Here look at the facts..  PSU  top seasons,  vs MEI

Continue reading →

Posted in Uncategorized | 18 Comments

Another Abuse Of Statistics By The Team

Since 1930, the average of all valid USHCN thermometer data shows a half degree decline in temperatures across the US.
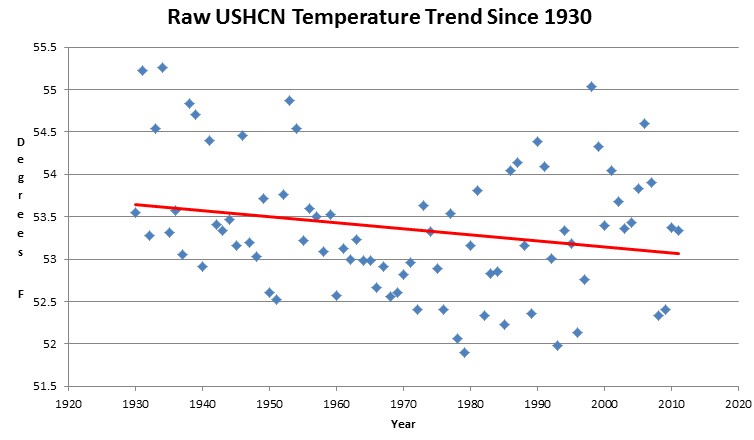
But we keep hearing about the high ratio of record maximums to record minimums in the US. Below I will show you what they are doing.

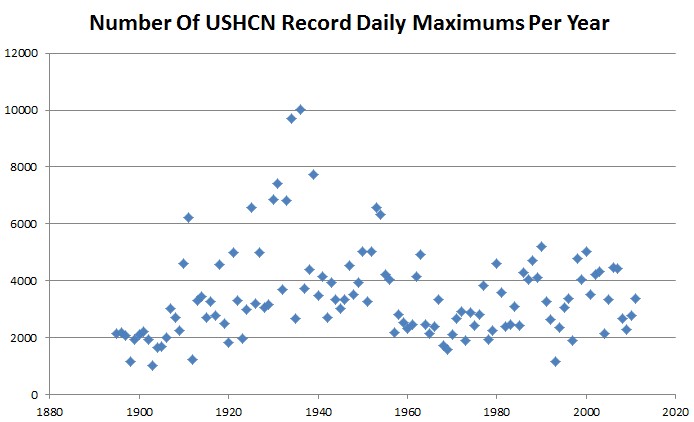
I changed the counting algorithm to be completely unbiased. If ten different years tie for the all-time record high at a specific location on a specific date, they all get counted as the record. This increases the total number of records.

All-time high temperature records in the 1930s were far more common than they have been in recent years.
All-time low temperature records peaked in the 1920s and 1970s.
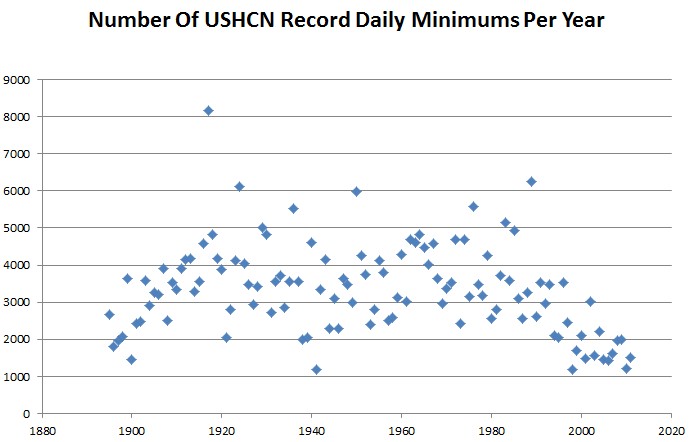
But here is the statistic trick. The ratio of highs to lows has been increasing lately. This is very misleading because the ratio of two small numbers is meaningless. Record highs and record lows have both been on the decline.

The far more important statistic is that the number of record highs has been declining.
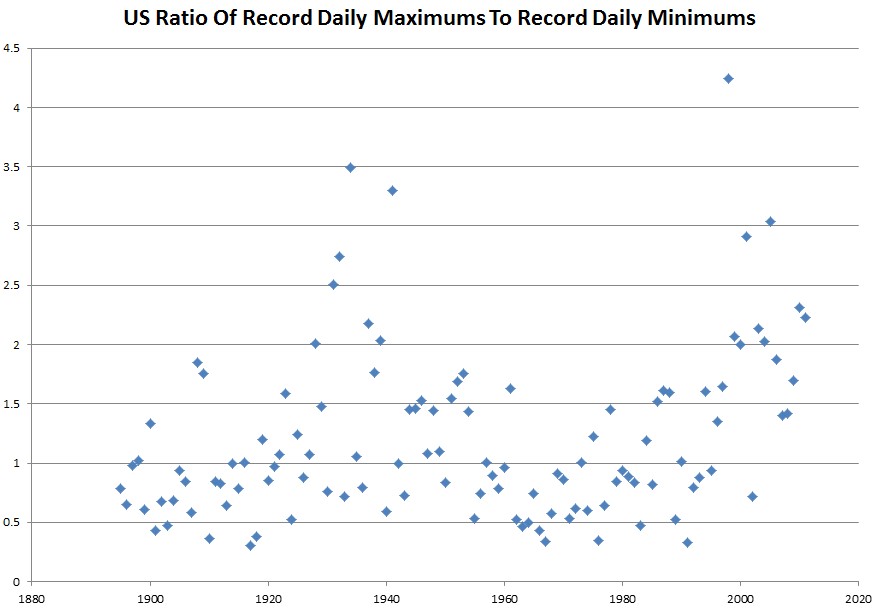
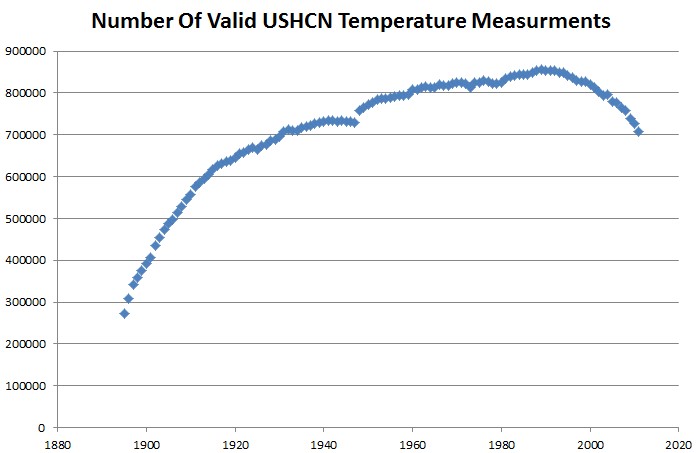
But this is worse than it seems. Note that there was a large spike in the ratio after 1990. Something else happened around that time – the number of stations dropped off dramatically. If NOAA was purging rural stations, that would cause the spike, because the record would be affected more heavily by UHI effects.

Posted in Uncategorized | 24 Comments

Illinois Temperatures Getting Cooler And Less Extreme

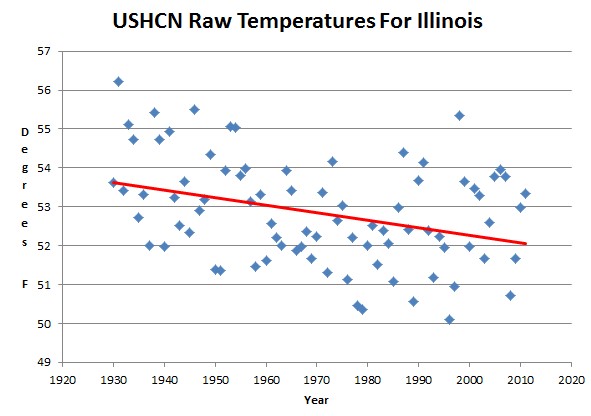
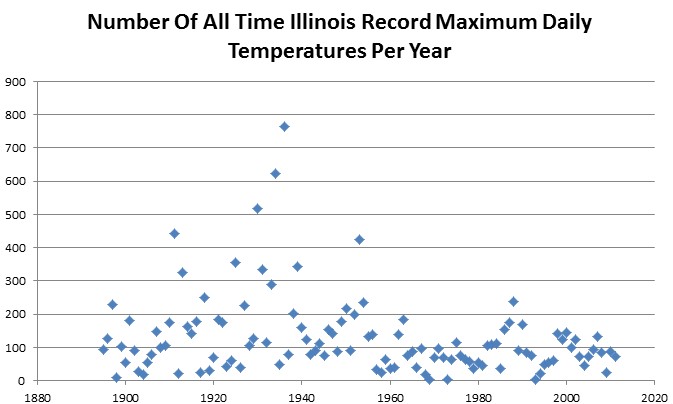
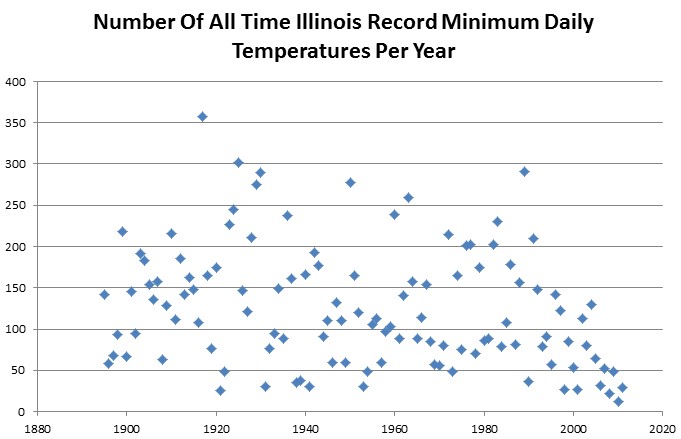
Contrary to the nonsense being spouted by the experts, Illinois temperatures have been getting cooler since 1930, with many fewer record temperatures.

I changed the algorithm for counting records, so that duplicates get double counted. For example, if an all-time record was set for a given day of year in 1936, 1953 and 1956 – all three years will get credit. This removes any bias from the count.

1936, 1934 and 1930 were the top three years for setting record maximums.

Record minimums are more evenly distributed, with 1917 being the year with the most record lows. 1930 was a very extreme year, as it ranked in the top four for both record highs and record lows.

Recent years have been near the bottom for both record highs and record lows.

Posted in Uncategorized | Leave a comment

Virginia Is For Cheaters

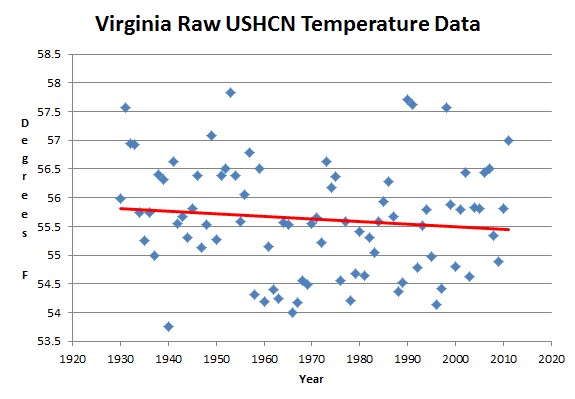
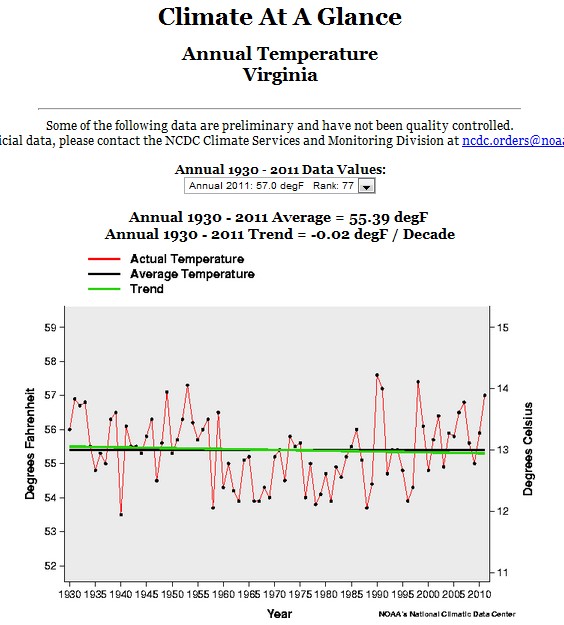
The measured temperature data for Virginia shows a significant cooling trend since 1930, with 1953 as  the hottest year. Our friends at USHCN have fixed this inconvenient problem.

VIRGINIA Climate Summary


Posted in Uncategorized | 1 Comment

How USHCN Messed With Texas

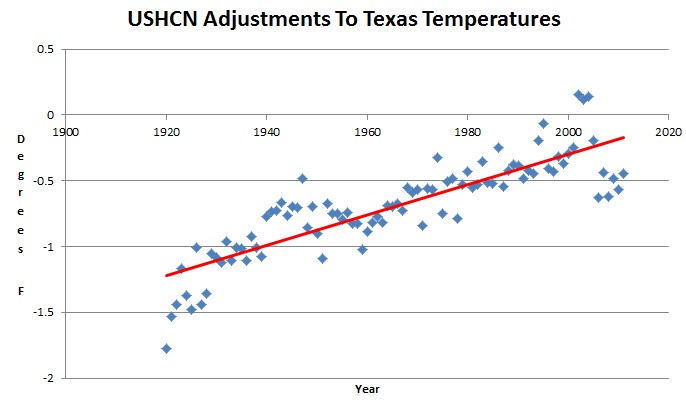
The thermometer data for Texas shows a cooling trend, which USHCN has hidden. The way they did it was by progressively subtracting larger and larger amounts from older temperature data. The year 1920 had 1.8 degrees subtracted from the average value which the thermometers read.

This is a pattern which we have seen over and over again. Without the USHCN alterations to the temperature data, the US would show no warming.

Posted in Uncategorized | 2 Comments

Another Bad Day For Drought Doomsayers

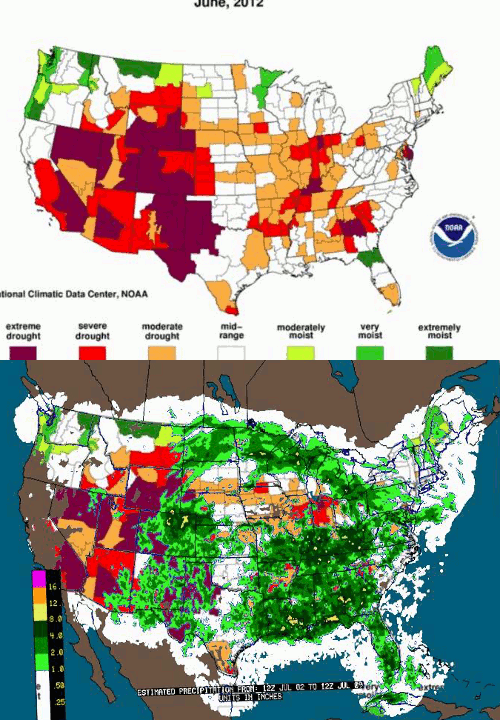
Intellicast – Weekly Precipitation in United States

Heavy rain continues to pummel much of the drought area.

Posted in Uncategorized | 5 Comments