Hiding The Decline In Texas

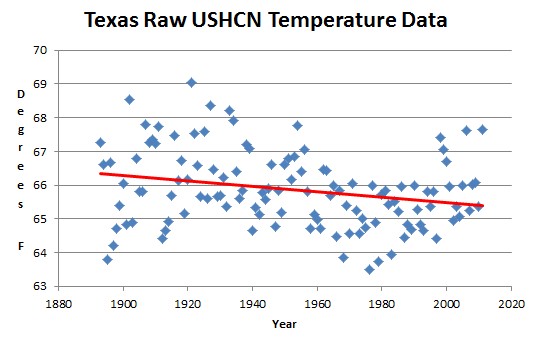
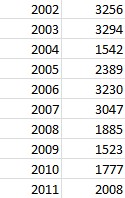
The raw USHCN data from Texas shows a decline of nearly half a degree since 1930.

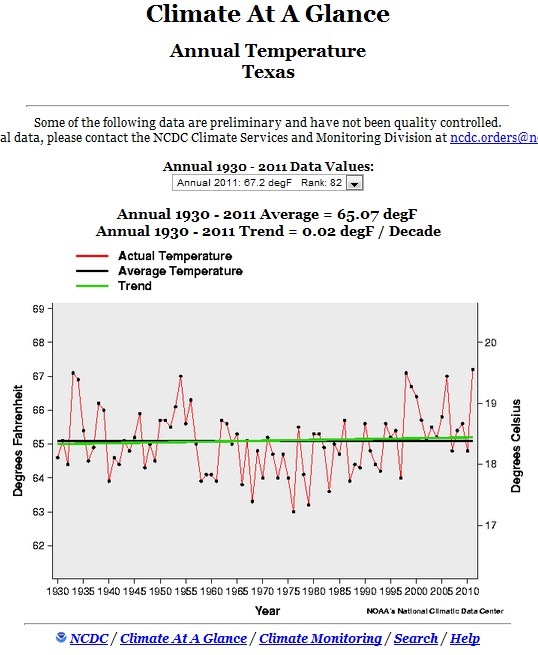
Fortunately, NCDC was able to stop this unpleasant cooling trend by simply altering the data. There were quite a few years warmer than 2012 prior to 1960, but our friends at NOAA simply washed them away.

TEXAS Climate Summary

Posted in Uncategorized | 10 Comments

Raising Arizona

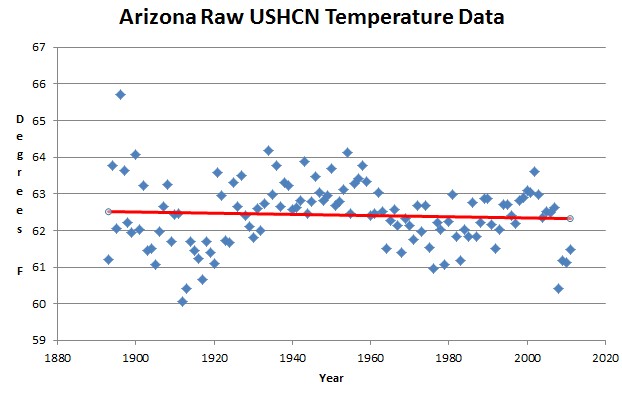
The average of all measured USHCN temperature data in Arizona shows a long term cooling trend, with recent years being among the coolest on record.

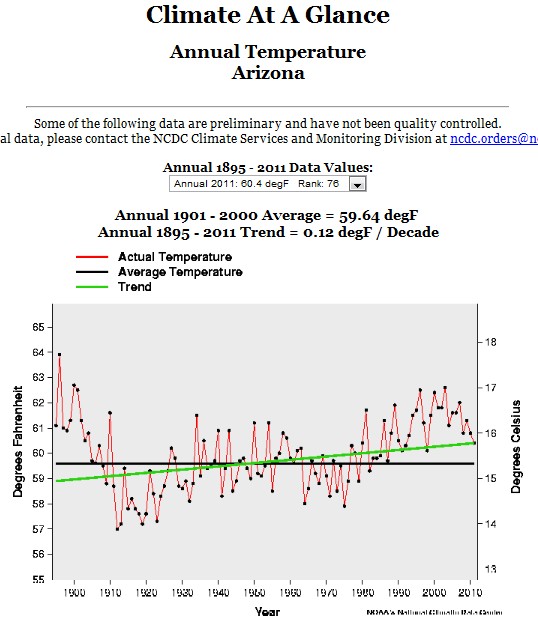
A cooling trend just didn’t fit the story line of permanent southwest heat and drought, so our government took the liberty of rewriting Arizona’s history.

ARIZONA Climate Summary

Posted in Uncategorized | 9 Comments

Global Warming Ends Abruptly

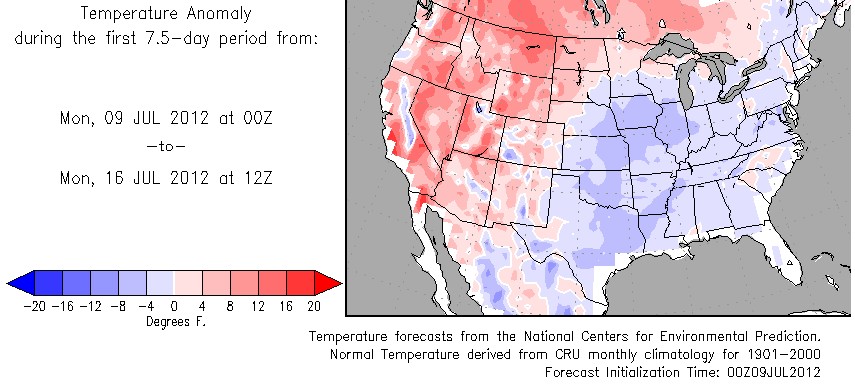
A couple of days ago we were told that global warming was determined by the temperature in the eastern half of the US.  Using the new found wisdom which has been imparted on us, we can safely state that global warming has officially ended.

10-Day Temperature Outlook for the Conterminous U.S.

Posted in Uncategorized | 8 Comments

Can Heavy Rain Cure The Hayhoe/Dessler Intellectual Drought?

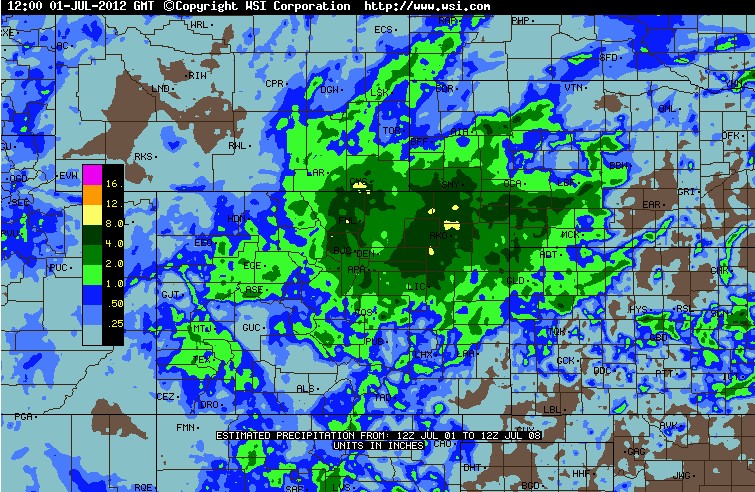
The torrential rain which has been falling in Colorado is spreading into West Texas, on the one year anniversary of Dessler declaring the permanent Texas drought.

Will the rain clear out their minds, and convince them to stop spreading nonsense for a living?

Posted in Uncategorized | 5 Comments

1921 – The Hottest Year In US History

According to the measured temperature data from USHCN, 1921 was the hottest year in US history. There were 654,134 temperature measurements taken that year around the country – and according to James Hansen every single one of them was incorrect and needed to be adjusted downwards – a lot.

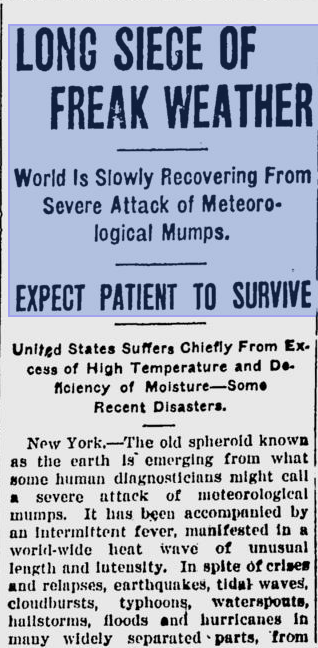
So what do we know about 1921?  We know that the Earth had a “fever” and that it was worldwide. Al Gore was 85 years too late.

 Below350.org

 Below350.org

Continue reading →

Posted in Uncategorized | 2 Comments

Eight Inches Of Rain At The Permanent Fire Drought

The press is still babbling mindlessly about the fires and permanent drought  in Colorado, while some places have received 60% of the normal annual rainfall during the last week.

I tried riding my bike to Safeway before, but the water was running up over a bridge on the bike trail.

Intellicast – Weekly Precipitation in Denver, Colorado

Posted in Uncategorized | 11 Comments

Alarmists – Please Stop Being Idiots

A comment from Anthony’s blog

Paul K2 says:

Thank goodness there are at least some people here who can spot the mathematical mistake in this post from Real-Science dot blog, so I don’t have to address it. The conclusions the post draws are nonsensical. Maybe Real-Science should actually be called Fake-Science.

Enough stupidity please, from the left.

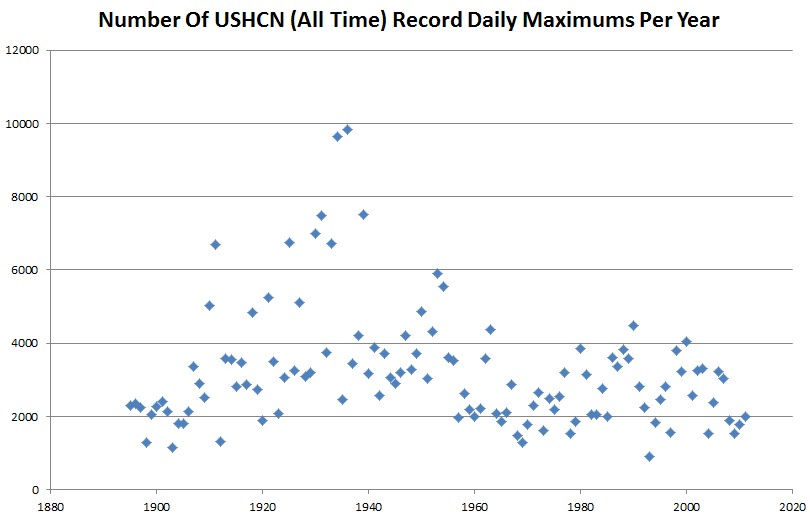
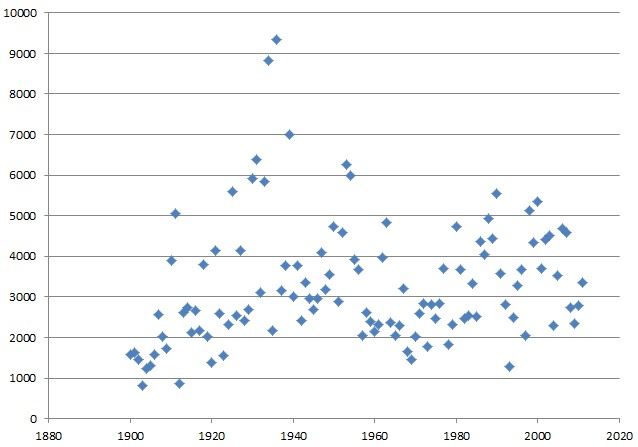
The graph shows how many all time daily temperature records were set during each year. It is calculated by parsing all the yearly records at a particular station for a particular day of the year. The year which has the highest temperature wins. All years have an equal chance of setting the record. Every station has exactly 366 daily high temperature records associated with it.

What Paul K-9 is trying to suggest is that the graph plots successive temperature records. Obviously that is not the case, because if it were – the first year would set a record at every station on every day. There would be an asymptote coming down the Y-axis on the left side.

There is a small bias to the left because the record is set by the first occurrence of the record high. In a warming world, this wouldn’t have much effect, because later temperatures would be warmer on the same date.

The graph below has the opposite bias. In this case, the most recent date of a tie wins. Even though the bias favors recent temperatures, the 1930s is still by far the hottest.

If there were thousands and thousands of daily records being set (as claimed by Masters et al) the spike would be on the right side of the graph – not on the left side.

My advice to alarmists. Try using your brain once in a while.

Posted in Uncategorized | 18 Comments

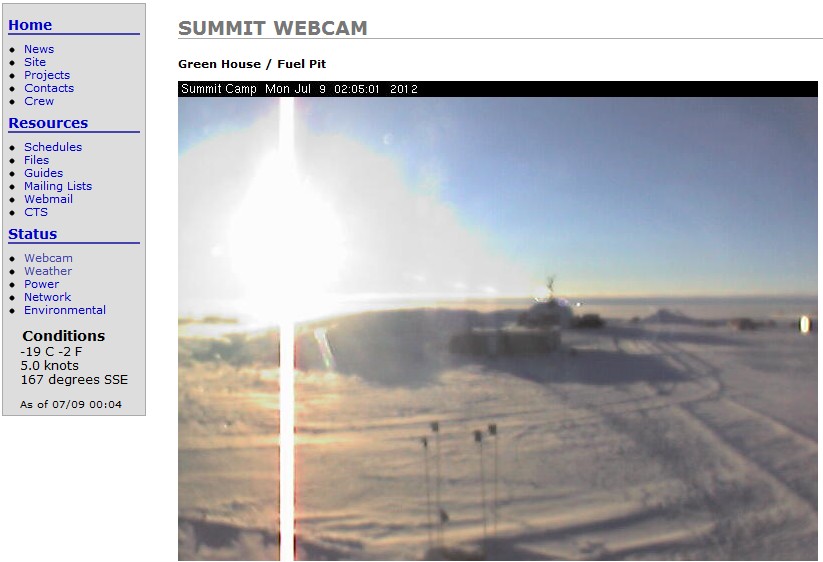
Greenland July Meltdown Continues At -19C

summit:status:webcam

Posted in Uncategorized | 13 Comments

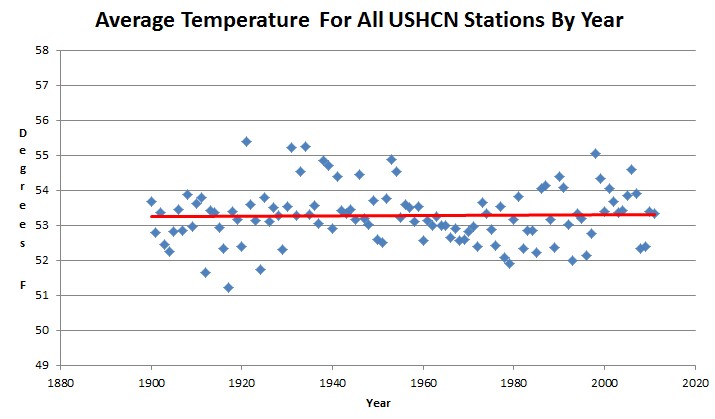
USHCN Thermometer Data Shows No US Warming Since The Year 1900

The graph below plots the average temperature (by year)  of all valid daily maximum and daily minimum readings, for all USHCN stations since 1900. As you can see, there has been no warming in the US, and the three hottest years (in order) were 1921, 1934 and 1931.

Also note that 2008 and 2009 were two of the coldest years on record in the US.
USHCN Daily Data

Before they started tampering with the data in the year 2000, all the experts agreed that the US was not warming,

Phil Jones and NOAA agreed in 1989 :

February 04, 1989 Last week, scientists from the United States Commerce Department’s National Oceanic and Atmospheric Administration said that a study of temperature readings for the contiguous 48 states over the last century showed there had been no significant change in average temperature over that period. Dr. (Phil) Jones said in a telephone interview today that his own results for the 48 states agreed with those findings.

New York Times

James Hansen agreed in 1999

Empirical evidence does not lend much support to the notion that climate is headed precipitately toward more extreme heat and drought. The drought of 1999 covered a smaller area than the 1988 drought, when the Mississippi almost dried up. And 1988 was a temporary inconvenience as compared with repeated droughts during the 1930s “Dust Bowl” that caused an exodus from the prairies, as chronicled in Steinbeck’s Grapes of Wrath…..

in the U.S. there has been little temperature change in the past 50 years, the time of rapidly increasing greenhouse gases — in fact, there was a slight cooling throughout much of the country

NASA GISS: Science Briefs: Whither U.S. Climate?

The US has the best temperature record in the world. There was no valid reason to tamper with it.

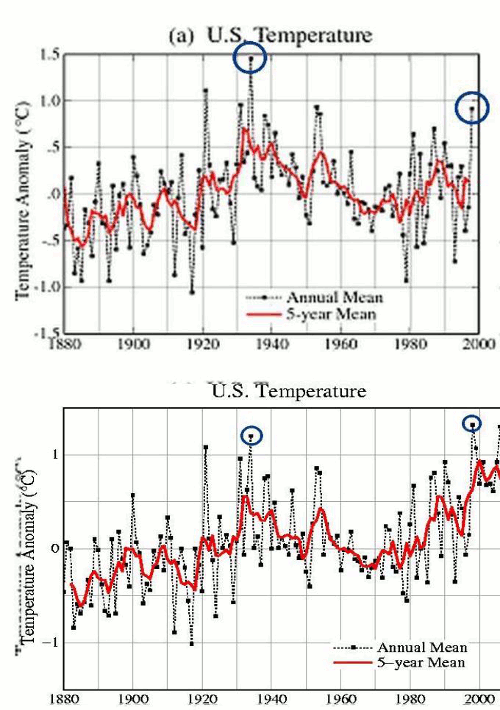
You can see the changes that GISS made after the year 1999, in the blink comparator below.
Posted in Uncategorized | 13 Comments

Heatwaves Were Much Worse Through Most Of US History

We are bombarded with statistics comparing the number of record lows to record highs, the number of record highs, etc. So I decided to look at what the actual numbers are in the USHCN database.

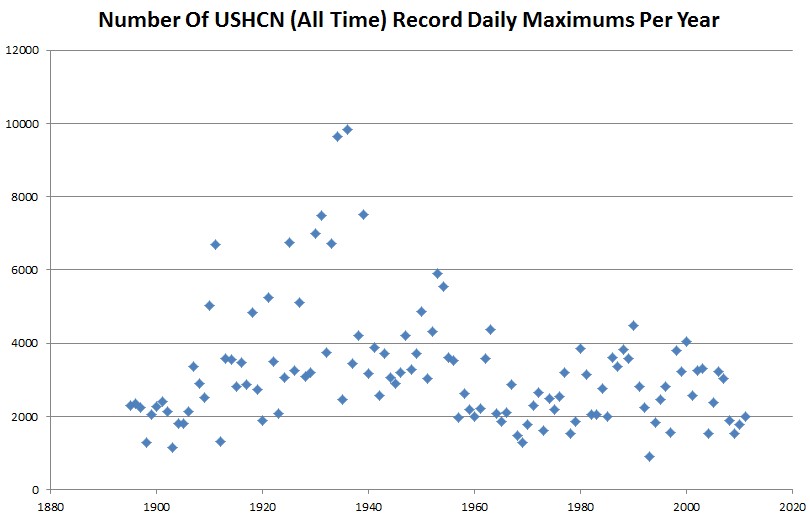
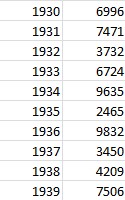
The graph below shows the number of daily record highs set per year for all USHCN stations (through 2011) which have records going back at least to 1930. The results are astonishing. 1934 and 1936 both set nearly five times as many record daily highs as 2011 did. It appears that the entire period from 1910 until 1960 was hotter than recent decades.

There have been 372,989 correctly recorded daily high temperature records in the US since 1895.  84% of them were set when CO2 was below 350ppm.

USHCN Daily Data

Compare the number of record highs in the 1930s to the past decade. You can see that the 1930s were consistently much hotter.


My guess is that most of the record highs we keep getting told about are from stations which don’t have records going back to the 1930s. The 1930s were much hotter in the US.

My next addition to this project will be to create the actual annual temperature graph for the US, based on the actual thermometer readings. My guess is that it won’t look anything like Hansen’s graph.

Posted in Uncategorized | 18 Comments