Watching Crooks At Work

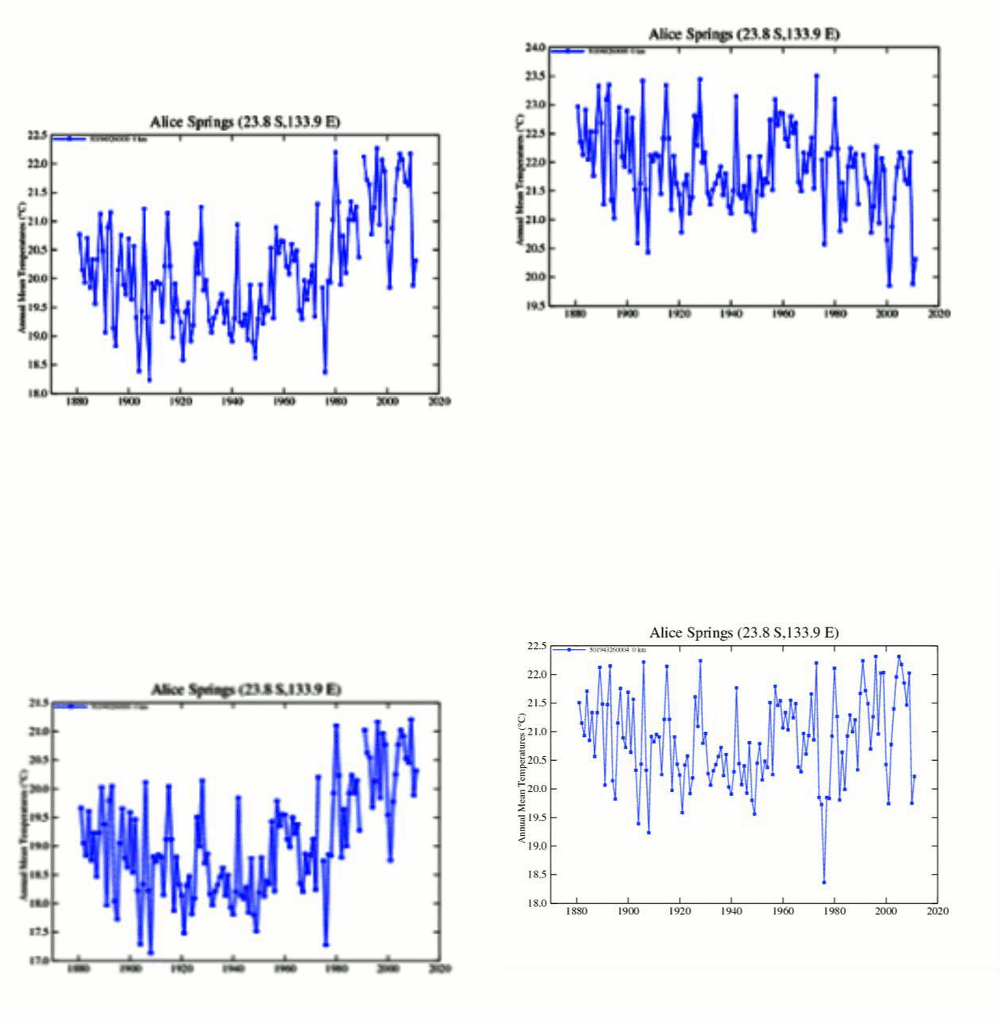
Paul Homewood has captured four different versions of Alice Springs temperature from the GISS web site – so far this year. I made an animation of the images he captured. -all at the same scale and axis registration. The changes in temperatures, trends, absolute values curvature, etc. show us that Hansen’s data is a completely worthless altered mess.

Temperatures Altered Yet Again In Alice Springs « NOT A LOT OF PEOPLE KNOW THAT

Paul says that GISS blames this insanity on a college kid. How many more versions will they fabricate this year?

Posted in Uncategorized | 4 Comments

No More Respect : Monsoons Arrive

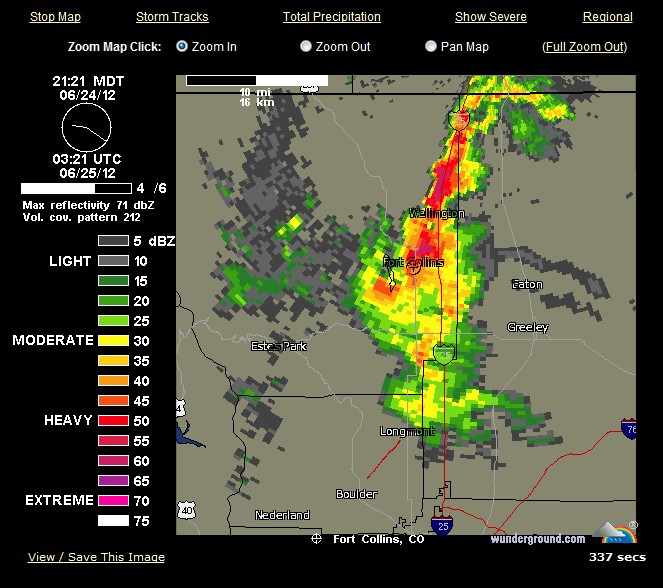
Just when we started getting some respect and finally  hit 100 degrees this afternoon (for about 10 minutes) the rain came. I was standing outside watching the glow of the fire about 20 minutes ago when the rain arrived. A few minutes later the glow was gone.

The increase in humidity and rain should help the firefighters out. This past week was a firefighters nightmare of high temperatures, high winds and very low humidity.


Posted in Uncategorized | 2 Comments

Does Climate Central Set The Stage For Global Stupidity?

Did Global Warming Set Stage For Duluth Flooding?

Climate Central | June 22, 2012 12:51 p.m.

Here are some of the facts regarding the unprecedented and devastating flooding event that took place this week in Duluth. A cold front sparked slow-moving thunderstorms that repeatedly moved over the Duluth area between June 17-19, dumping between 8 and 10 inches of rain in a 24-to 36-hour period on Duluth and neighboring communities in Minnesota and Wisconsin.  An all-time record 24-hour rainfall was set in Duluth, with 7.24 inches of rain falling during that period. The rainfall came during an already wet month in Minnesota, as the state rapidly lurched from drought conditions during the spring to suddenly having a precipitation surplus.

Did Global Warming Set Stage For Duluth Flooding? · OPB News

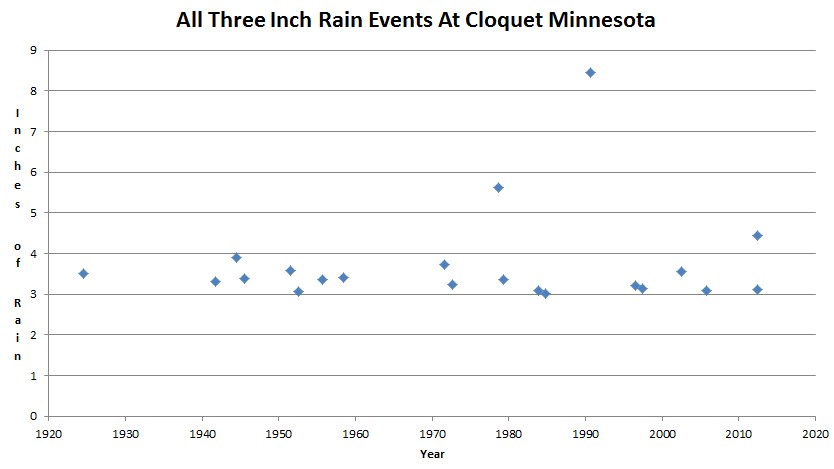
Temperatures were normal or below on the 19th and 20th – the days when the rain fell. The rain was triggered by cold air, not global warming.

The graph below shows all three inch rain events at Duluth, including the two last week. There was an 8.3  inch rainfall in one day in 1990, more than the sum of the two days last week.

In 1978 there was a 5.6 inch rainfall, more than either day last week. 1978 was one of the coldest years in Minnesota history. As usual, Heidi is just spreading propaganda.

U.S. Historical Climatology Network


Posted in Uncategorized | 3 Comments

John Cook’s Claims – Better Than It Seems

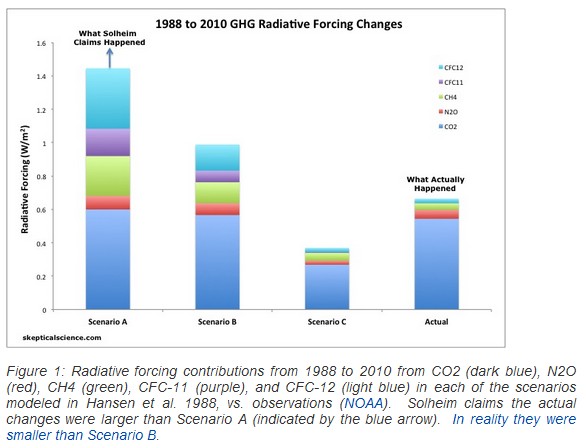
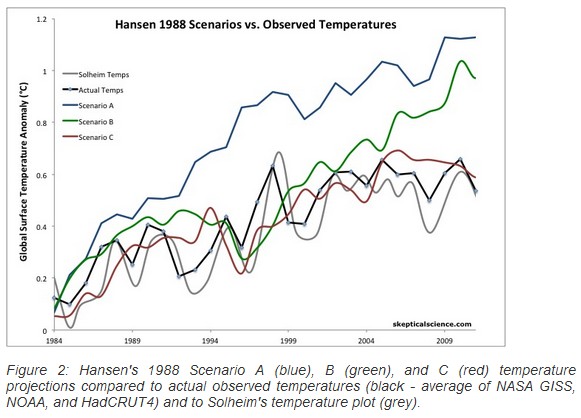
Rarely has an alarmist handed us such a big gift, as John Cook did this week. His graph below shows that reductions in the most potent greenhouse gases CFC, CH4 and N2O have been close to the level of Hansen’s Scenario C.

Simply Wrong: Jan-Erik Solheim on Hansen 1988

So what exactly was Scenario C? In his 1988 paper, Hansen wrote

scenario C assumes a rapid curtailment of trace gas emissions, such that the net climate forcing ceases to increase after the year 2000.

pubs.giss.nasa.gov/docs/1988/1988_Hansen_etal.pdf

What Cook is implying is that we have done a phenomenal job of reducing greenhouse gas emissions, and have nearly achieved Hansen’s scenario C state of no new forcings. We have already accomplished far beyond the requirements of Kyoto, or anything they dreamed up in Copenhagen or Cancun.

But it is better than it seems, because Cook also shows that temperatures are already below Scenario C. Mission accomplished! Time for climate alarmists to declare victory and move on.

Thank you John.

Posted in Uncategorized | 5 Comments

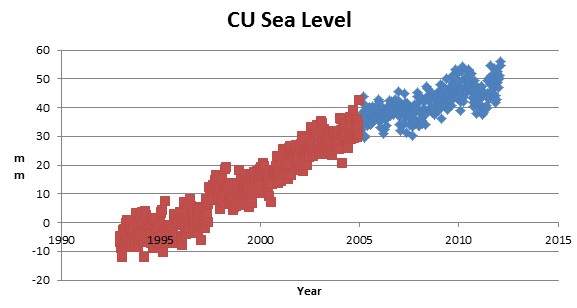
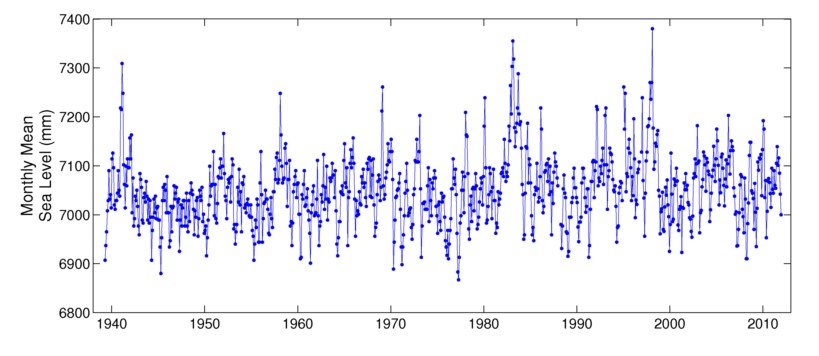
CU – Sea Level Rise Has Dropped In Half Since 2005

sealevel.colorado.edu/files/2012_rel2/sl_ns_global.txt

From 1992 through 2004, sea level rose at 3.55 mm/year, according to the University of Colorado. From 2005 to 2012, the same data set shows 1.81 mm/year. If sea level continues to rise at the current rate, we will see sixteen centimeters of sea level rise by the end of the century, which is perhaps one tenth of what the experts are claiming this week.

Government funded global warming research is propaganda. It has nothing to do with science.

—————————————————————————————

Ed Caryl informs me that he covered this same topic last week in more detail.

http://notrickszone.com/2012/06/18/data-show-sea-level-rise-has-slowed-down-over-the-last-7-years/

Posted in Uncategorized | 15 Comments

The 1930s Was Much Hotter In The Midwest

U.S. Historical Climatology Network

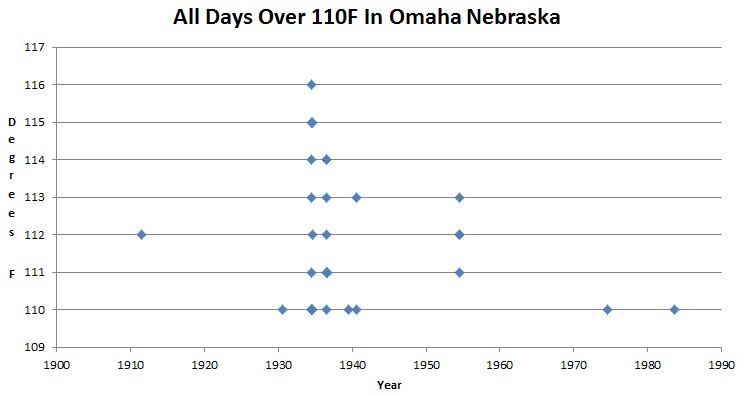
The graph above plots all thirty days when Omaha, Nebraska has hit 110F.  Twenty two of those days occurred during the 1930s, and all occurred below 350 ppm. Hansen claimed that last summer’s heat in Oklahoma was impossible without man-made CO2, but once again it is clear that he has absolutely no clue what he is talking about.

Posted in Uncategorized | 2 Comments

Smoking Gun That The NRC Sea Level Report Is Garbage

Yesterday the National Research Council told us that sea level was rising very quickly in California, and would rise one foot over the next twenty years.

Sea level to rise higher in California due to global warming, geology

As the world continues to warm from climate change, most of California — including San Francisco Bay and Monterey Bay — will see a greater rise in sea level than other parts of the planet, according to a prominent national study released Friday.

San Francisco Bay already has risen roughly 7 inches in the past 100 years, as measured by the tidal gauge at Fort Point, under the Golden Gate Bridge.

No mention that the other tide gauge in San Francisco Bay shows no sea level rise, or that the seven inches of rise all occurred before 1980.

Ocean levels south of Humboldt County will rise up to 1 foot in the next 20 years, 2 feet by 2050, and up to 5 feet by 2100, the study showed.

The estimates in Friday’s report were largely in line with other estimates from scientists in recent years at the U.S. Geological Survey, the United Nations Intergovernmental Panel on Climate Change and other research bodies.

Sea level to rise higher in California due to global warming, geology – MontereyHerald.com :

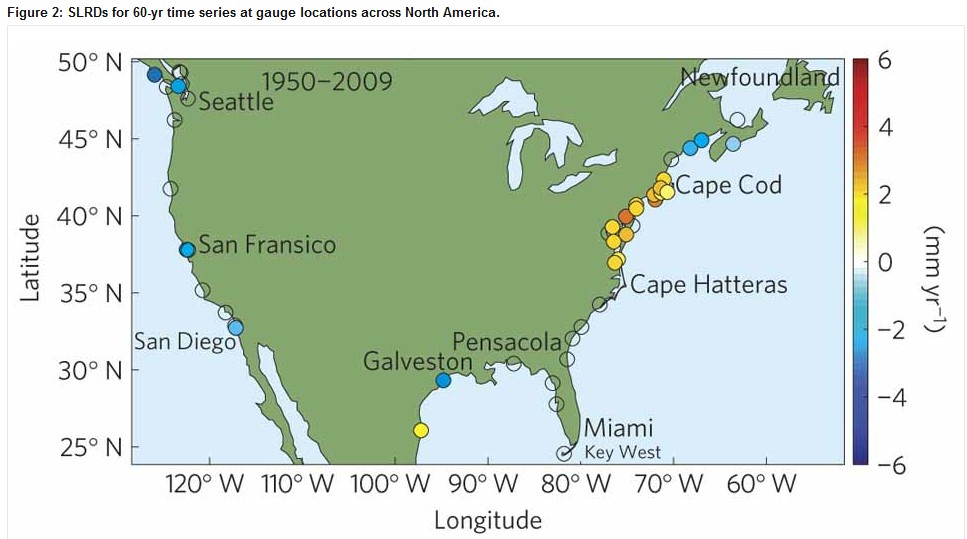
On the same day, the US Geological Survey published a paper showing that sea level rose more slowly in California than the global average, between 1950 and 2009 .

Hotspot of accelerated sea-level rise on the Atlantic coast of North America : Nature Climate Change : Nature Publishing Group

Bottom line is that the NRC report is complete garbage, unless an asteroid hits the Greenland Ice Sheet.

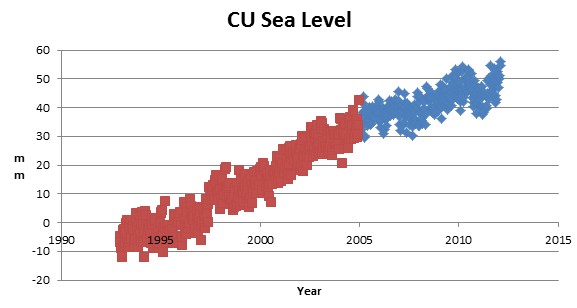
CU Satellite data shows that global sea level rise rates have dropped by almost 50% over the last seven years.

Neither tide gauge in San Francisco Bay shows any sea level rise for the past thirty years. The Alameda tide gauge shows no sea level rise for 50 years.

http://www.psmsl.org/data/obtaining/stations/437.php

h/t to  Marc Morano and Tom Nelson

Posted in Uncategorized | 6 Comments

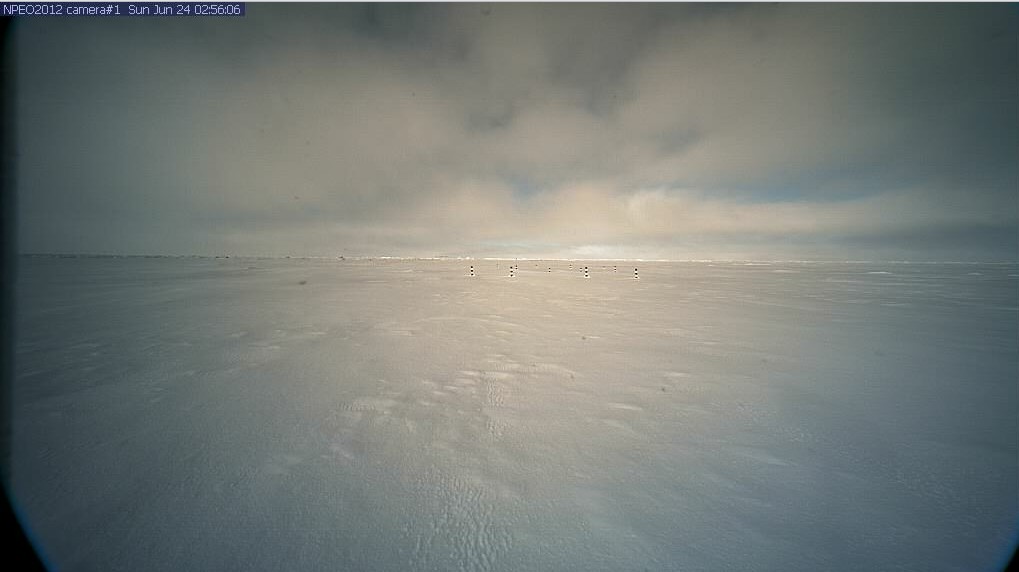
Meltdown At The North Pole

The sun has passed its peak elevation at the North Pole, and is beginning its descent towards winter. Temperatures have been running below normal, and no evidence of melting has occurred so far this summer.

8.jpg (1024×576)

PAWS Buoy Recent Data

Posted in Uncategorized | 5 Comments

Joe Bastardi Challenges Jeff Master’s Claims About Sunspots

Guest post by Joe Bastardi

—–

A rebuttal to  Weather Underground statement

“In the last 35 years of global warming, sun and climate have been going in opposite directions.”

First of all, Dr Jeff Masters, as a PHD in METEOROLOGY   and someone running a business, is someone  is  naturally have  respect for.  You don’t accomplish what he has without having to face  an overcome challenges.  So  I look at this differently than some of the ignorant  or  deceptive missives from others I have challenged before on this site,  many from the climatologists  that make statements that show me they don’t look at the weather.

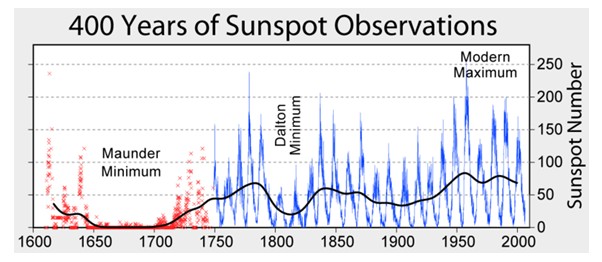
Lets look at the last  400 years of sunspot cycle
Lets now look at the  PDO  since   1900
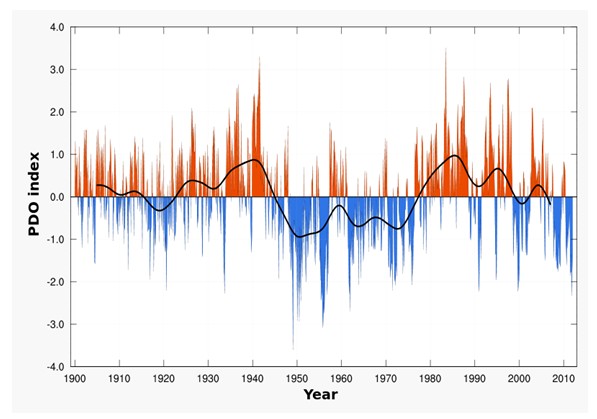
Suppose the reason for the  “little ice age” was indeed the lack of solar activity.  That means  we are starting from a very cold , below normal  global temp,  at the end of the  2 minimums,  so   if the sun were controlling all this, then we should be warming up in response,  which we have.

Now let me opine this. With sunspot activity backing away a bit the last 50 years,  its still, relative to what we saw to put us into the Little ice Age, well above the threshold of where it was to put us into the cold period. So it would stand to reason that we would still warm.

Now bring in the warm PDO over the last  35 year. You claim we are still warming. But you make the argument against co2 unwittingly  because you can easily see that the sun and then the warm cycle of the PDO, would easily explain this!!!

Continue reading →

Posted in Uncategorized | 46 Comments

June 2012 – Leading Alarmists Declare That Global Warming Is Over

Leading alarmist John Cook told us this week that temperatures have been nearly flat for 15 years,  are below Hansen’s zero emissions scenario, and that it is because we have already cut our emissions of the most potent greenhouse gases (CFCx, CH4 and N2O) by 80-90% below what was forecast.

John provided this graph showing that temperatures have risen very little for 15 years, and are below Hansen’s “zero emissions after the year 2000” Scenario C.

Simply Wrong: Jan-Erik Solheim on Hansen 1988

The father of GAIA, James Lovelock also told us this week that his forecasts of global warming doom were misguided.

‘Gaia’ scientist James Lovelock: I was ‘alarmist’ about climate change – World News

If alarmists are telling us that we have already made huge cuts in emissions, that temperatures are barely rising, and that they were wrong all along – what is it that they are worrying about?

Time to pack this $100 billion/year scam up and figure out why some of the key players continue to lie about it.

Posted in Uncategorized | 106 Comments