Spencer Translates Trenberth

Kevin Trenberth’s response to our paper, rather predictably, was:

“I cannot believe it got published”

Which when translated from IPCC-speak actually means, “Why didn’t I get the chance to deep-six Spencer’s paper, just like I’ve done with his other papers?”

http://www.drroyspencer.com/

Posted in Uncategorized | 4 Comments

Reader Contest

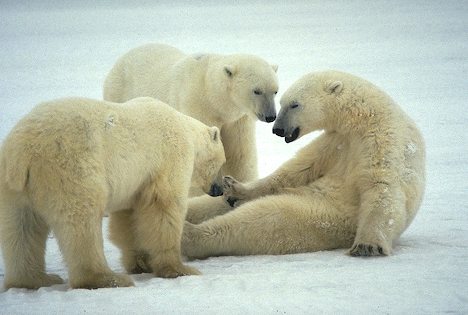
Prize goes to the first reader who can count the number of bears in this picture.

  • Three
  • Four
  • There were four, but the other one presumably drowned
  •  One, and two bear researchers in drag


Posted in Uncategorized | 30 Comments

Wisconsin Running A Budget Surplus

Six months ago the Wisconsin Senate Democrats went AWOL in an attempt to stop Governor Walker from fixing the state’s disastrous budget. Now they have a budget surplus. This teaches us that the key to a healthy economy is to get the Democrats in Congress to run away.

Over the past six months, Wisconsin has been nothing short of a miracle. Newly elected Governor Scott Walker and the Republicans in the majority in Madison got just about everything they wanted during the past legislative session, and a state facing a projected $3 billion budget shortfall with no end in sight now has a projected $300 million budget surplus. The amazing successes in Wisconsin have emboldened the legislatures and political leaders of other states, who have seen the wonders resulting from a little political backbone and fiscal common sense.

http://pajamasmedia.com/

h/t to Dave G

Posted in Uncategorized | 12 Comments

Active Rock Naming Season Continues

I plan to name a new rock today – Emily. Climate change has made nameable rocks appear much more frequently than in the early days of pet rocks.


Posted in Uncategorized | 5 Comments

How We Know That Climate Alarmism Is A Joke

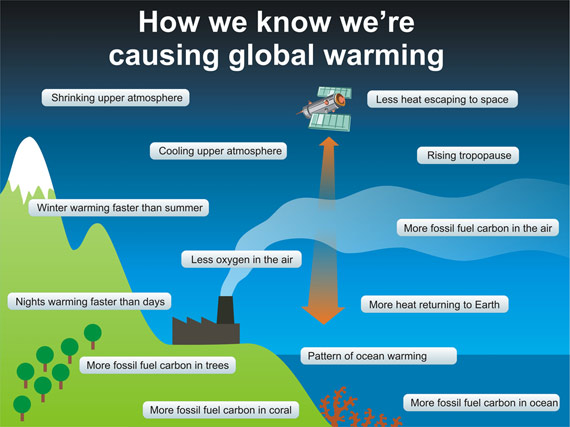
John Cook posted the picture above.

Some minor problems. Over the last decade, winter temperatures have been plummeting

Continue reading →

Posted in Uncategorized | 20 Comments

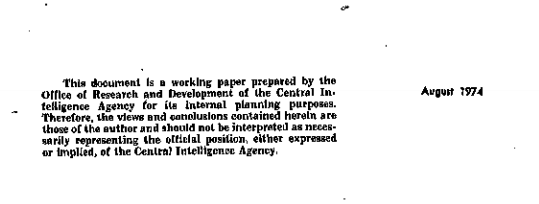
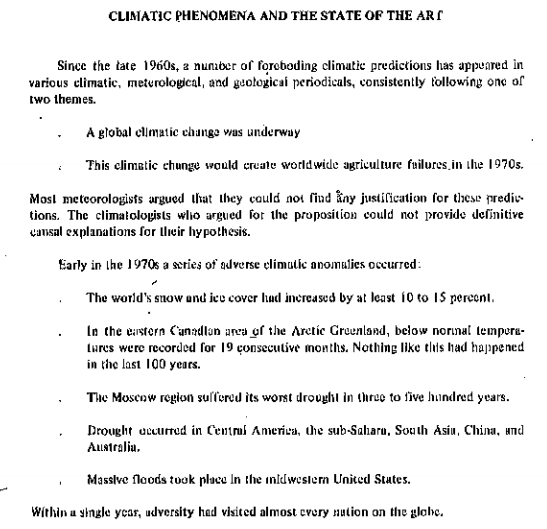
1974 : The CIA Warned Us

Arctic ice spreading south. Snow and cold spreading south. Record floods, drought, crop losses. All due to the dreaded global cooling.

“Within a single year, adversity had visited almost every nation on the globe”

Continue reading →

Posted in Uncategorized | 4 Comments

“2011: Headed for Record Arctic Melt?”

This year could be well on its way toward earning a dubious spot in the record books.

Arctic sea ice has melted away with astonishing speed in the first half of July, at an average rate of about 46,000 square miles (120,000 square kilometers) per day, according to the National Snow and Ice Data Center (NSIDC) in Boulder, Colo.

That’s equivalent to an area roughly the size of Pennsylvania melting into the sea every 24 hours.

“That’s relatively fast,” said Julienne Stroeve, a research scientist at the NSIDC.

http://www.ouramazingplanet.com

Not unless an asteroid hits. The map below compares 2007 vs 2011. Most of the red (2007 ice not present in 2011) will be gone in a couple weeks, and the green (2011 ice not present in 2007) area will likely grow much larger. Barring a  major  change in the weather, 2011 won’t be anywhere close to 2007 come September.

Continue reading →

Posted in Uncategorized | 14 Comments

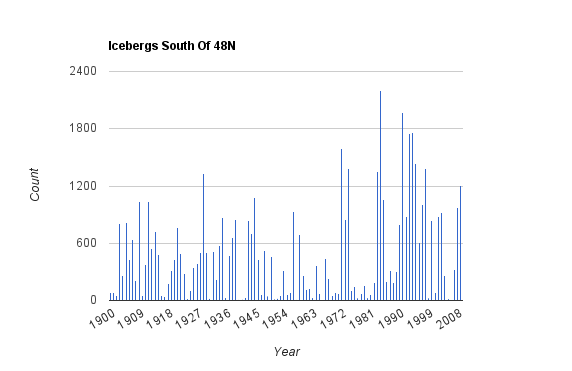
Satellites Produce More Icebergs

http://www.uscg-iip.org/General/icebergs.shtml

Since Earth monitoring satellites were launched in the late 1970s, the number of icebergs drifting south of 48N has increased. Similarly, the number of hurricanes in the mid-Atlantic has also increased.

I’d like to get some grant money to understand why the presence of satellites affects hurricane and iceberg formation.

Posted in Uncategorized | 5 Comments

Cherry Picking At NOAA

By Bob Berwyn

SUMMIT COUNTY — Colorado may be warming up faster than anywhere else in the contiguous 48 states, according to a new map published as part of the 10-year “climate normals” update by the National Oceanic and Atmospheric Administration.

A map included in the new materials shows that Colorado recorded the greatest increase in average maximum temperatures — between .7 and .9 degrees — from the old normals, compiled between 1971 and 2000, and the new normals, which are based on temperature readings between 1981 and 2010. On average across the U.S., the new average temperatures are about .5 degrees warmer.

http://summitcountyvoice.com/

NOAA cleverly picked the lowest point of the 1970s ice age scare to start their trend line. The eighty year trend shows a completely different story.

Continue reading →

Posted in Uncategorized | 36 Comments

295.org

Dropping CO2 back to 295 ppm would make the climate stable again, like the one they had during the Black Plague and the Potato Famine.

http://trove.nla.gov.au/

h/t to Ivan

Posted in Uncategorized | 2 Comments