http://www.ncdc.noaa.gov/oa/climate/research/cag3/state.html
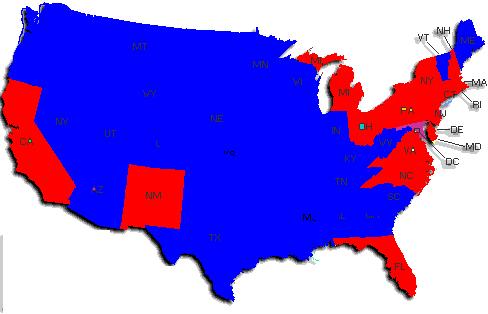
The map above shows in blue, areas of the country which had their hottest year below Hansen’s safe level of 350 ppm. Areas in red had their hottest year above 350 ppm. (Almost all of those occurred in 1998.)
79% of the country had their hottest year when CO2 levels were considered safe from global warming.