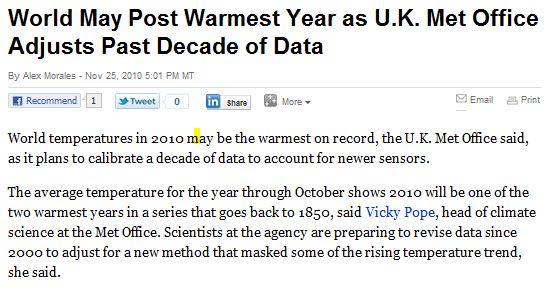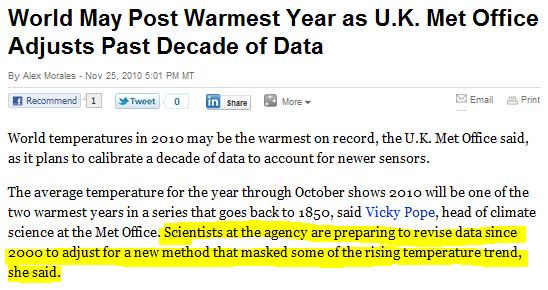
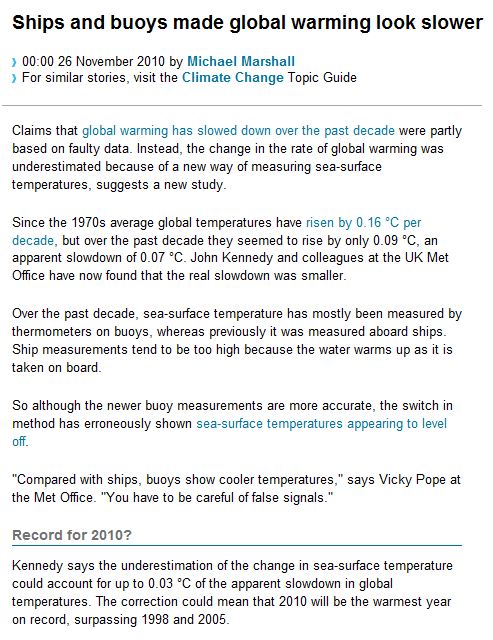
Even more book cooking upwards adjustments to get 2010 up to #1. Kind of like shoplifters at Wal-Mart who don’t realize they are being video-taped.
h/t to Marc Morano
Even more book cooking upwards adjustments to get 2010 up to #1. Kind of like shoplifters at Wal-Mart who don’t realize they are being video-taped.
h/t to Marc Morano

They must have hired some accountants from Enron Fannie Mae. Yet another upwards adjustment. There seems to be no limit to how far they are willing to push this.
h/t to reader Mohatdebos

They lasted about four days, and never answered any of my questions. Below is their “old message.”

“We will contact you shortly.”
No you didn’t. Just more BS from the usual group of suspects.
I think it’s too close to call. Based on these numbers it’ll be second, but it depends on how warm November and December are,” said Dr Phil Jones, director of the Climatic Research Unit (CRU), at the University of East Anglia, which says 1998 was the record year so far.
http://www.cru.uea.ac.uk/cru/data/temperature/hadcrut3vgl.txt
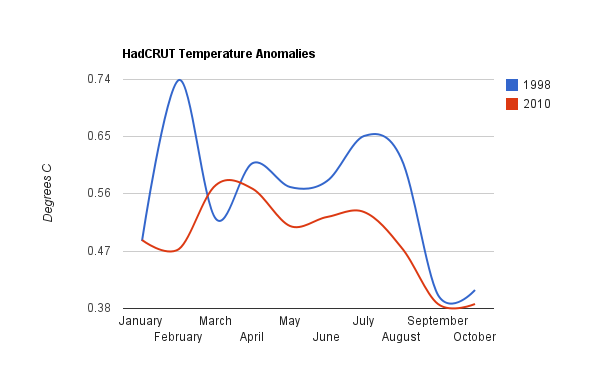
The graph above shows how HadCRUT 2010 compares to 1998 through the end of October.
The 1998 average through October is 0.56, and the 2010 average is 0.49. In order to beat 1998, November and December would have to average more than 0.38 above the same months in 1998. The graph below shows what would have to happen the remainder of the year to make Hansen an honest man.
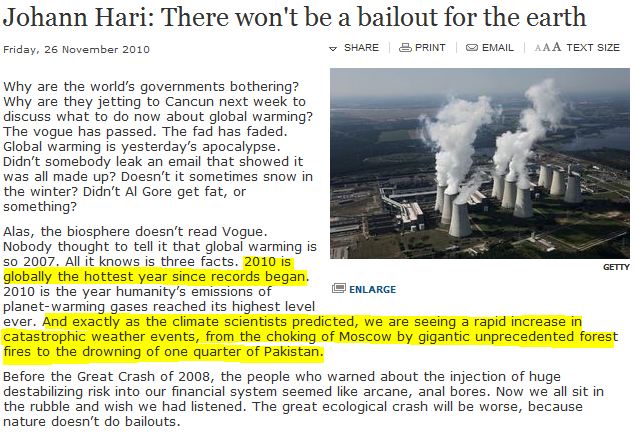
If you were a CEO of industry, you would probably get in trouble for presenting an annual report with gross misinformation. Not so in climate science. 2010 is not the hottest year, there is no evidence that we are seeing an increase in extreme weather over the long term, and nuclear power plants do not produce CO2.
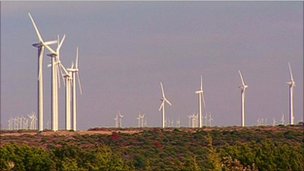
The magic of the marketplace.
Texas is the world leader in wind power, and (outside of some notorious festering pockets of climate BSE in College Station and Austin) is also one of the world’s leaders in climate realism. From the BBC.
Big bucks
The numbers are staggering. This one county, Nolan County, hosts no fewer than 1,400 turbines. Texas has as many as 6,000 overall. Combined output: something like 9,000MW, roughly the output of nine power stations.
At first sight, you might think this couldn’t be a clearer example of the United States tackling climate change.

From the NSIDC image, it appears that there is a large amount of excess sea ice bordering West Antarctica (lower left.)
What you can’t see is that super-secret stealth currents of warm water travel hundreds of miles under the ice, then drill up to the surface and attack the WAIS. Their plan is cause collapse of the ice sheet and cause 15 metres of sea level rise.
Only higher taxes can stop them at this point.
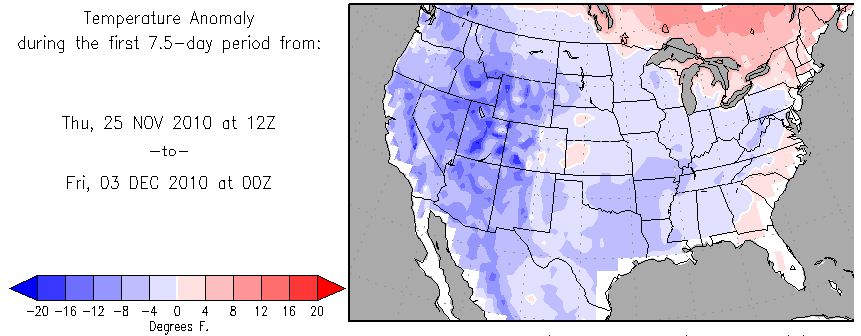
http://wxmaps.org/pix/temp1.html
Look what is coming next week!
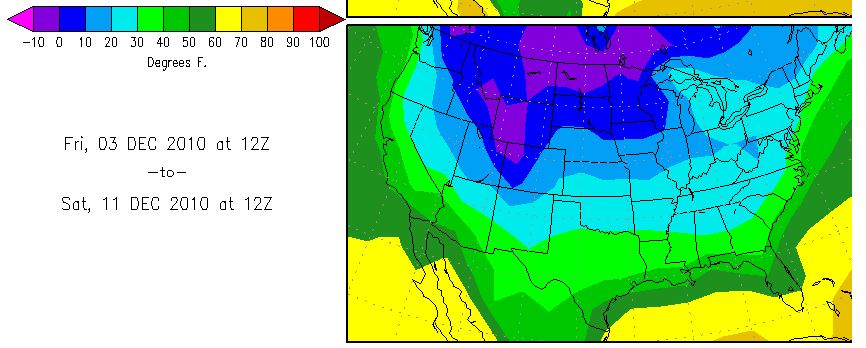
Time to coin a new term : “The Obama Minimum.”
Happy Thanksgiving everyone.
What Goddard ignores is that thermal expansion explains the majority of global sea level rise
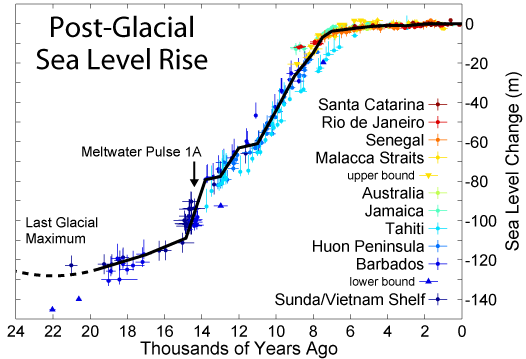
Sea level has risen 130 metres. Those oceans must be getting incredibly hot!

Clouds are the key variable. When the sun shines on the ocean at a low angle of incidence, SW radiation enters the water and heats it. When it is cloudy, less heat enters the water.
So a critical factor in predicting changes to ocean heat content is being able to forecast clouds. If you can’t model clouds accurately, you can’t forecast changes in ocean heat content. If you can’t forecast changes in ocean heat content, you can’t forecast changes in climate. Period.
Climate models don’t model clouds accurately.