How Much Can You Pack Into One Article?

Marc Morano sent this over, It is a treasure trove of misinformation and fun. I’ll tackle it one piece at a time.

In recent years, for example, the water level of Lake Powell (it covers portions of Utah and Arizona) has dropped so far that the waterfalls and canyons drowned when Glen Canyon Dam was built are visible again.

Lake Powell water levels have actually increased by more than 60 feet since 2004.

http://lakepowell.water-data.com/

Posted in Uncategorized | 5 Comments

“Cool It” In Georgia

This must be what Lomborg was talking about.

Albany, Georgia raw maximum temperatures. No trend.

Continue reading →

Posted in Uncategorized | 2 Comments

Nature Celebrates The Global Warming Conference With Record Cold

http://wxmaps.org/pix/temp1.html

Posted in Uncategorized | 4 Comments

C++ For Climate Gurus

Most climate science code is in Fortran. Here is a useful C++ code snippet in case they ever want to switch over.

float record_temperature = yearly_temperatures[2005];
float 2010_temperature = yearly_temperatures[2010];

while (2010_temperature < record_temperature)
{
    for (int month = 0; month < 12; month++)
    {
        float monthly_temperature = monthly_temperatures[2010][month];
        float random_noise = ( float( (rand() % 5 ) / 10 ) - 0.15 );
        monthly_temperature += random_noise;
        monthly_temperatures[2010][month] = monthly_temperature;
        2010_temperature += (random_noise / 12);
    }
}

yearly_temperatures[2010] = 2010_temperature;
record_temperature = 2010_temperature;
Posted in Uncategorized | 14 Comments

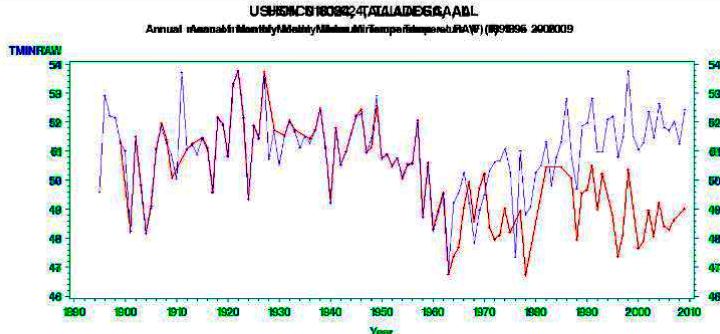
Taladega Nights

USHCN is never one to disappoint. They turned a nighttime long term cooling trend (red line below) in Taladega, into a steep warming trend (blue line below) – through the power of the modern computer loaded with junk cutting-edge software.

http://cdiac.ornl.gov/

Posted in Hiding The Decline, Uncategorized | 4 Comments

Summer In Antarctica

Meteorological summer starts in two weeks in the Southern Hemisphere, and the Antarctic meltdown is just getting started. Windchill at Vostok forecast at -97F this week.

http://www.wunderground.com/cgi-bin/findweather/getForecast?query=-78.44999695,106.87000275

Posted in Uncategorized | 5 Comments

Whining WaPo Rino

http://www.humanevents.com/

Can the party of Reagan accept the science of climate change?

By Sherwood Boehlert
Friday, November 19, 2010
Watching the raft of newly elected GOP lawmakers converge on Washington, I couldn’t help thinking about an issue I hope our party will better address. I call on my fellow Republicans to open their minds to rethinking what has largely become our party’s line: denying that climate change and global warming are occurring and that they are largely due to human activities.

http://www.washingtonpost.com/

Tricky concept. They won the election by promising to end government waste and fraud, and the author wants them to go back to waste and fraud.

What does Reagan have to do with this?

Posted in Uncategorized | 4 Comments

Follow The Money

http://community.nasdaq.com/

Translation : “We can get even more free money from the Government!“

Posted in Uncategorized | 1 Comment

Your Local Politburo : The Debate Is Over – Again

Ask Your Environmental Commission: Global warming
Thursday, November 18, 2010
THE ITEM OF MILLBURN AND SHORT HILLS

Question: It seems there is renewed debate on the validity of human-induced global warming. Can you shed some light?

Answer: The short answer is that there is no good reason for any renewed debate. Without expressing any opinions, consider the following facts:

Average global temperatures by decade have risen for each of the last five decades, the longest time period for which there is detailed, accurate global data.

If the warming trend continues, there is broad consensus within the scientific community of what the effects will be in 50 years, 100 years and beyond, including melting of polar ice caps and increased frequency and intensity of droughts, heat waves and hurricanes.

Continue reading →

Posted in Uncategorized | 2 Comments

NASA Ice Mass Data : The Smoking Gun

Hansen’s map above shows ice loss right at the South Pole.

In the real world, there has actually been a large increase in the amount of ice. The photograph below shows multi-storied buildings at the South Pole, which have become buried in ice and snow since they were built in the mid-1970s.

http://www.coolantarctica.com/Bases/South_Pole/south_pole0002.html

Do these people ever check their work?

Posted in Uncategorized | 46 Comments