
GISS shows that Danmarkshavn, Greenland warmed almost 1ºC in 2010. They must be soothsayers, because three of the coldest months of the year have not yet been recorded.
http://data.giss.nasa.gov/cgi-bin/gistemp/

GISS shows that Danmarkshavn, Greenland warmed almost 1ºC in 2010. They must be soothsayers, because three of the coldest months of the year have not yet been recorded.
http://data.giss.nasa.gov/cgi-bin/gistemp/
[youtube=http://www.youtube.com/watch?v=pu4qvTcCLi8]
Video of ice movement since September 18
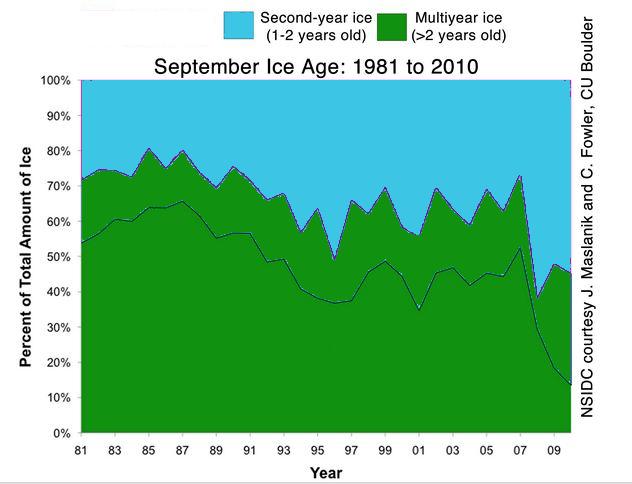
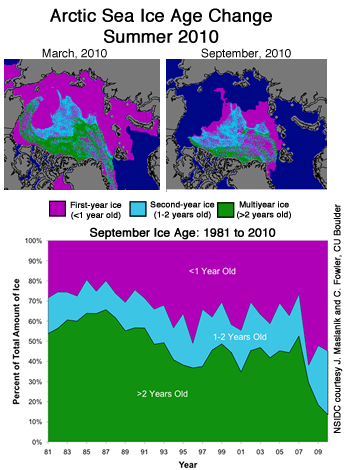
During the winter of 2007-2008, a lot of multi-year ice (MYI) blew out into the North Atlantic and melted. Right now, the Arctic has nearly as much area of MYI as it did in 1995.
The image below was modified from the original NSIDC image to account for the recent Arctic ice birthday.
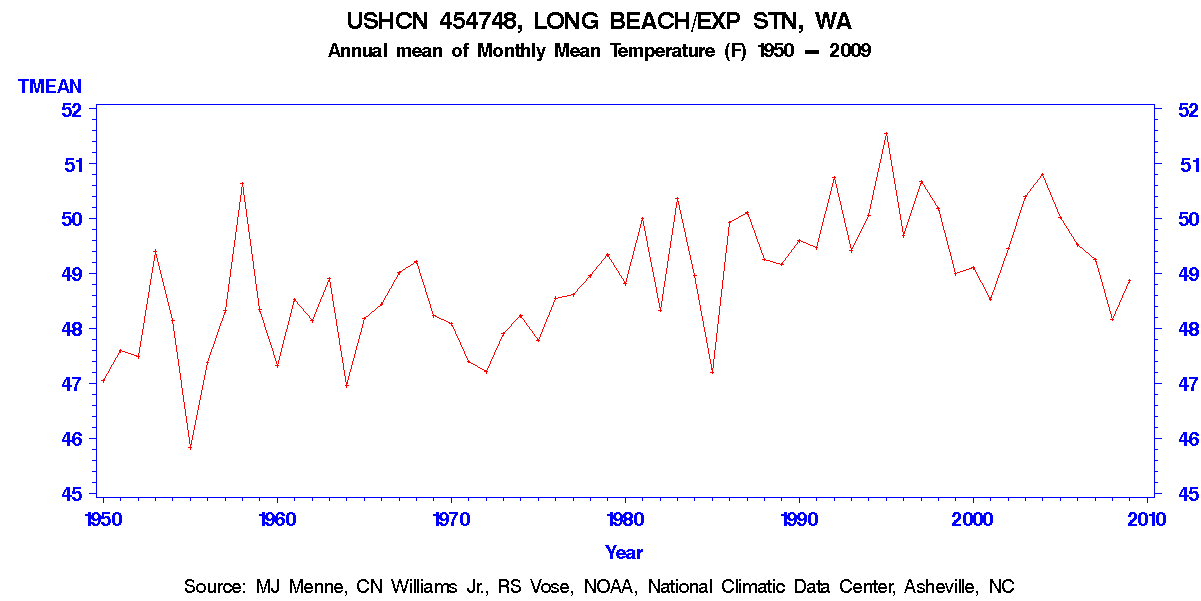
From the looks of the USHCN graph above, you would think that temperatures at Long Beach, Washington were getting a lot warmer. More than a degree warmer since 1950.
Whether or not the temperatures are getting warmer, one thing for sure, the trend we see is due to adjustments. The plot below shows USHCN final temperatures minus measured temperatures.
The map below shows Hansen’s forecast temperature change for a doubling of CO2.

Note that the fastest warming place on the planet is forecast to be Antarctica at 5-8C
The map below shows his forecast for albedo loss (i.e. ice loss.)

NASA claims that CO2 “acts as a thermostat in regulating the temperature of Earth.”
This is an easy theory to test by examining historical data. If CO2 was the thermostat, then a larger change in CO2 would necessarily manifest itself as a larger change in temperature. Periods of time when CO2 increased more rapidly would necessarily be followed by more rapid increases in temperature.
That is how a thermostat works. If you turn the setting up a lot, the temperature also increases a lot. Now to the data.
The first graph below shows the five year running mean of the rate of change of atmospheric CO2, by year since 1885. In 1945, the year over year change in CO2 was zero. In 2009, the year over year change was close to 2 ppm.

Mt Rainier – Seattle’s doom
It is worse than we thought. Marc Morano sent this over :
Over the last decade, rock avalanches and landslides have become more common in high mountain ranges, apparently coinciding with the increase in exceptionally warm periods The collapses are triggered by melting glaciers and permafrost, which remove the glue that holds steep mountain slopes together.
Worse may be to come. Thinning glaciers on volcanoes could destabilise vast chunks of their summit cones, triggering mega-landslides capable of flattening cities such as Seattle and devastating local infrastructure.
Telephoto lenses are great. Mt Rainier is three miles high and seventy-four miles away from Seattle. That is going to be one heck of a landslide.
And one more minor problem …..
GISS is still showing 2010 as hotter than 2005 or 1998. They list 2005 as the current hottest year, and 2010 is well ahead.


Sadly, the comments are being taken over by spamsters.
New policy is, unless they are directly addressing the points of the article in question. our friends are limited to one ad hom off topic post per thread. I will delete all subsequent spam posts.
The President’s science advisor John Holdren speculated last year on the possibility of an ice free winter in the Arctic.
…if you lose the summer sea ice, there are phenomena that could lead you not so very long thereafter to lose the winter sea ice as well. And if you lose that sea ice year round, it’s going to mean drastic climatic change all over the hemisphere. – John Holdren, 2009
Let’s see how that is doing.

I forecast a large drop in the UAH channel 5 anomaly this month, down to 0.35. This is based on daily temperatures for the first half of the month.