From listening to Romm, you would think that the US is having a very hot year. He has claimed heat from coast to coast.
But NOAA data shows Romm’s folly.
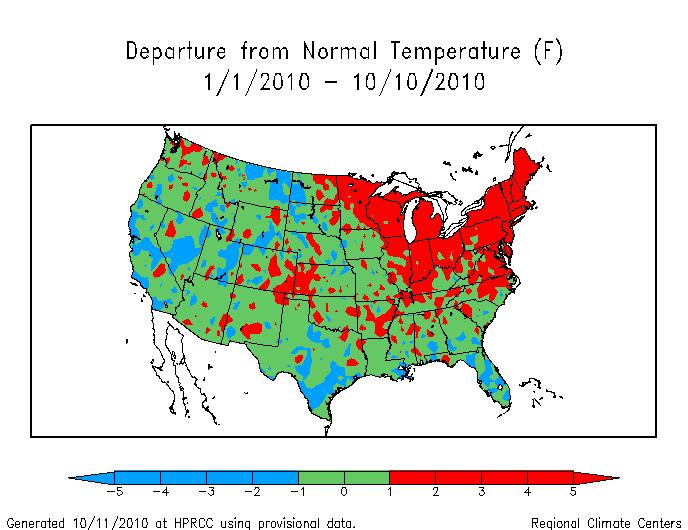
The map above is based on the NOAA year to date map. I split the country up into regions based on above normal (red,) normal (green,) and below normal (blue) temperatures. Normal is defined as within 1ºF of the mean temperature.
61% of the country has seen normal temperatures, 27% has seen above normal temperatures, and 13% has seen below normal temperatures. Hardly what would be called a hot year
According to NCDC, the year to date is actually the fourth coolest since 1998, with temperatures declining at a rate of nine degrees F per century.