

http://botd.wordpress.com/2010/09/26/top-posts-1610/
Thanks everyone. After only three weeks, we have made the top 100 out of 248,290 new posts – from 323,880 bloggers.
82/248,290 is about the same ratio as atmospheric CO2 concentration. ;^)
http://botd.wordpress.com/2010/09/26/top-posts-1610/
Thanks everyone. After only three weeks, we have made the top 100 out of 248,290 new posts – from 323,880 bloggers.
82/248,290 is about the same ratio as atmospheric CO2 concentration. ;^)

According to the experts, the Arctic is one of many places which is the “fastest warming place on the planet.” Supposedly, temperatures in the Arctic are rising several times faster than even the unprecedented heating in Scotland.
The coloured area of the DMI graph below shows Arctic (north of 80N) temperature deviations since the start of summer (June 1.)

PIOMAS tells us that ice thickness is at an all time low. Here is their June forecast :
End of June: According to our model retrospective simulations, the ice in the Arctic has continued to thin at a remarkable rate. The statistical method based on the PIOMAS model analysis now is projecting a new record low ice extent. The best predictors are G1.0 (area withless than 1.0 m of ice) and G0.4 (area with less than 0.4 m of ice) which give nearly identical results. Using the same one as last month (G1.0) the predicted extent is 3.96 +/- 0.34 million square kilometers. The R2 value for this predictor is 0.84. which now indicates a high degree of skill in the forecast.
CSU football (0-3) has the third longest losing streak in the country at 12, and is looking to extend that today at home against Idaho (2-1.)’
—————————–
My strategy worked :
Minutes after missing a point-after touchdown kick that would have tied the game, CSU kicker Ben DeLine booted a 35-yard field goal on the final play today to lift the Rams to a 36-34 win over Idaho in the home opener at Hughes Stadium.
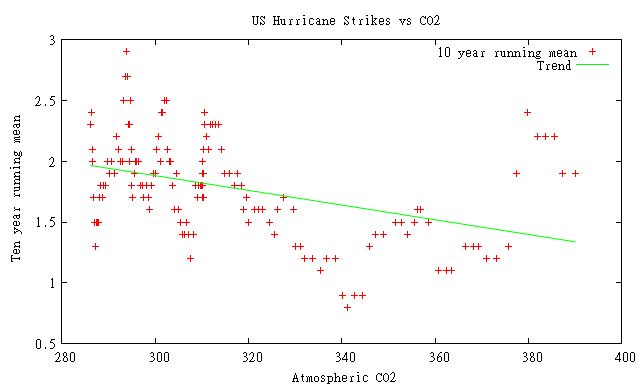
The graph above plots the ten year running mean of US hurricane strikes vs. atmospheric CO2. As you can see, there is no correlation between increasing CO2 and increasing hurricane strikes.
Here is the claim :
Over the past century, the number of hurricanes that strike each year has more than doubled, and scientists blame rising sea temperatures.
Here is the reality :
Hurricane Lisa is yet another 2010 hurricane which most likely would not have been found in the past. It is barely above the minimum speed of a hurricane, and in an area of the ocean where hurricanes didn’t used to get noticed.
1934 used to be the warmest year in the US, but was recently demoted out of the top spot by GISS and replaced by 1998.
Below are animations comparing temperature departure graphs from 1934 and 2010. 1934 was a much hotter year than 2010.

http://docs.lib.noaa.gov/rescue/mwr/062/mwr-062-07-c1.pdf
Crushing heat across the US. Ten degrees above normal in the center of the country. Compare 1934 vs GISS hottest year ever, 2010.


