June 1934 – An Incredibly Hot Month

GISS has recently demoted 1934 from the #1 spot.

Fortunately, NOAA has archived the original un-adjusted records.  The entire contiguous US had temperatures over 100º, and almost every state was far above normal. The midwest was seven degrees above normal. New London, Minnesota recorded 108º.

Continue reading →

Posted in Uncategorized | Leave a comment

Put Down The Phone And Drive ….

Hardly a week goes by where I don’t almost get hit on my bicycle by someone attempting to drive and talk on the phone at the same time.  They always have that same look of a deer in the headlights – completely oblivious of the disaster that is about to happen.

Continue reading →

Posted in Uncategorized | 4 Comments

Maybe We Can’t Count, But GCD Will Still Kill You

Apparently the photographer found one more way to die since the article was written.

Global climate disruption is coming after you. Tornadoes are going push Grizzly Bears across mud flats into cities full of zombies. Death is now certain for all 7 billion people on the planet.

Continue reading →

Posted in Uncategorized | 1 Comment

Rapid Arctic Ice Growth

http://arctic.atmos.uiuc.edu/CT/animate.arctic.color.0.html

The blink comparator above shows how far the ice edge has expanded in the last two days.  This makes it easy to understand the steep upwards slope in the graphs below.

Continue reading →

Posted in Uncategorized | 1 Comment

Thermometer Magic

http://www.thecookinginn.com

Most people probably assume that measuring the US temperature is as simple as this. And perhaps it should be.

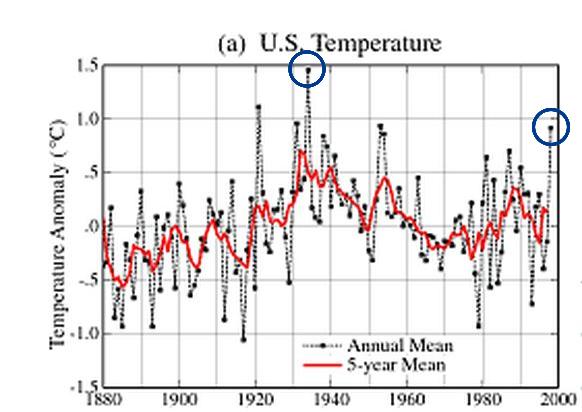
Prior to the year 2000, the GISS US temperature graph appeared as below. Note that 1998 was more than half a degree C (almost 1ºF) cooler than 1934.

In the year 2000, they switched places. 1998 became warmer than 1934. How did this magic occur?

Continue reading →

Posted in Uncategorized | 61 Comments

Correlating Temperature With CO2

NCAR graph from the 1970s

Now that at least one member of the Hockey team has acknowledged that the cooling in the 1970s was both real and natural, we can analyze older data which was not perturbed by people with an agenda to prove global warming. The graph below compares NCAR’s 1970s temperatures vs. atmospheric CO2.

Continue reading →

Posted in Uncategorized | 21 Comments

Record Fast Arctic Freeze?

http://ocean.dmi.dk/arctic/icecover.uk.php

In mid-August, the winds kicked up in the Arctic and pushed the ice edge to the north – causing great joy amongst people wanting to claim Arctic Armageddon.

Continue reading →

Posted in Uncategorized | 7 Comments

The World’s Worst Flood – 1931

Flooding in China in 1931 killed as many as four million people, and left 80 million homeless. It was preceded by a three year drought and heavy snow/rain. Atmospheric CO2 levels were 310 ppm, well below Dr. Hansen’s “safe” level of 350 ppm.

Continue reading →

Posted in Uncategorized | 2 Comments

Philadelphia 2010 So Far – Not Quite As Hot As 1828

We all know by now that 2010 is the hottest year in history. Particularly on the US East Coast where Philadelphia has been almost as hot as it was 182 years ago.

Continue reading →

Posted in Uncategorized | 3 Comments

Philadelphia Summer 2010 – Just As Hot As 1828

Philadelphia’s “hottest ever summer” of 2010 averaged 78ºF from June-August. That is just as hot as it was June-August, 1828. When CO2 levels were 290 ppm.

From The Harvard University Library

Continue reading →

Posted in Uncategorized | 2 Comments