
Four goals on Wednesday, but nothing on Saturday. They haven’t won a Premiership match since May 1.
Four goals on Wednesday, but nothing on Saturday. They haven’t won a Premiership match since May 1.
Earl is down to 85 MPH

Fiona is down to 45 MPH

Tamino gets an exemplary grade today. Lucia is wobbling though.

—————————
Afternoon update. Still in the queue, with dozens of later posts published.
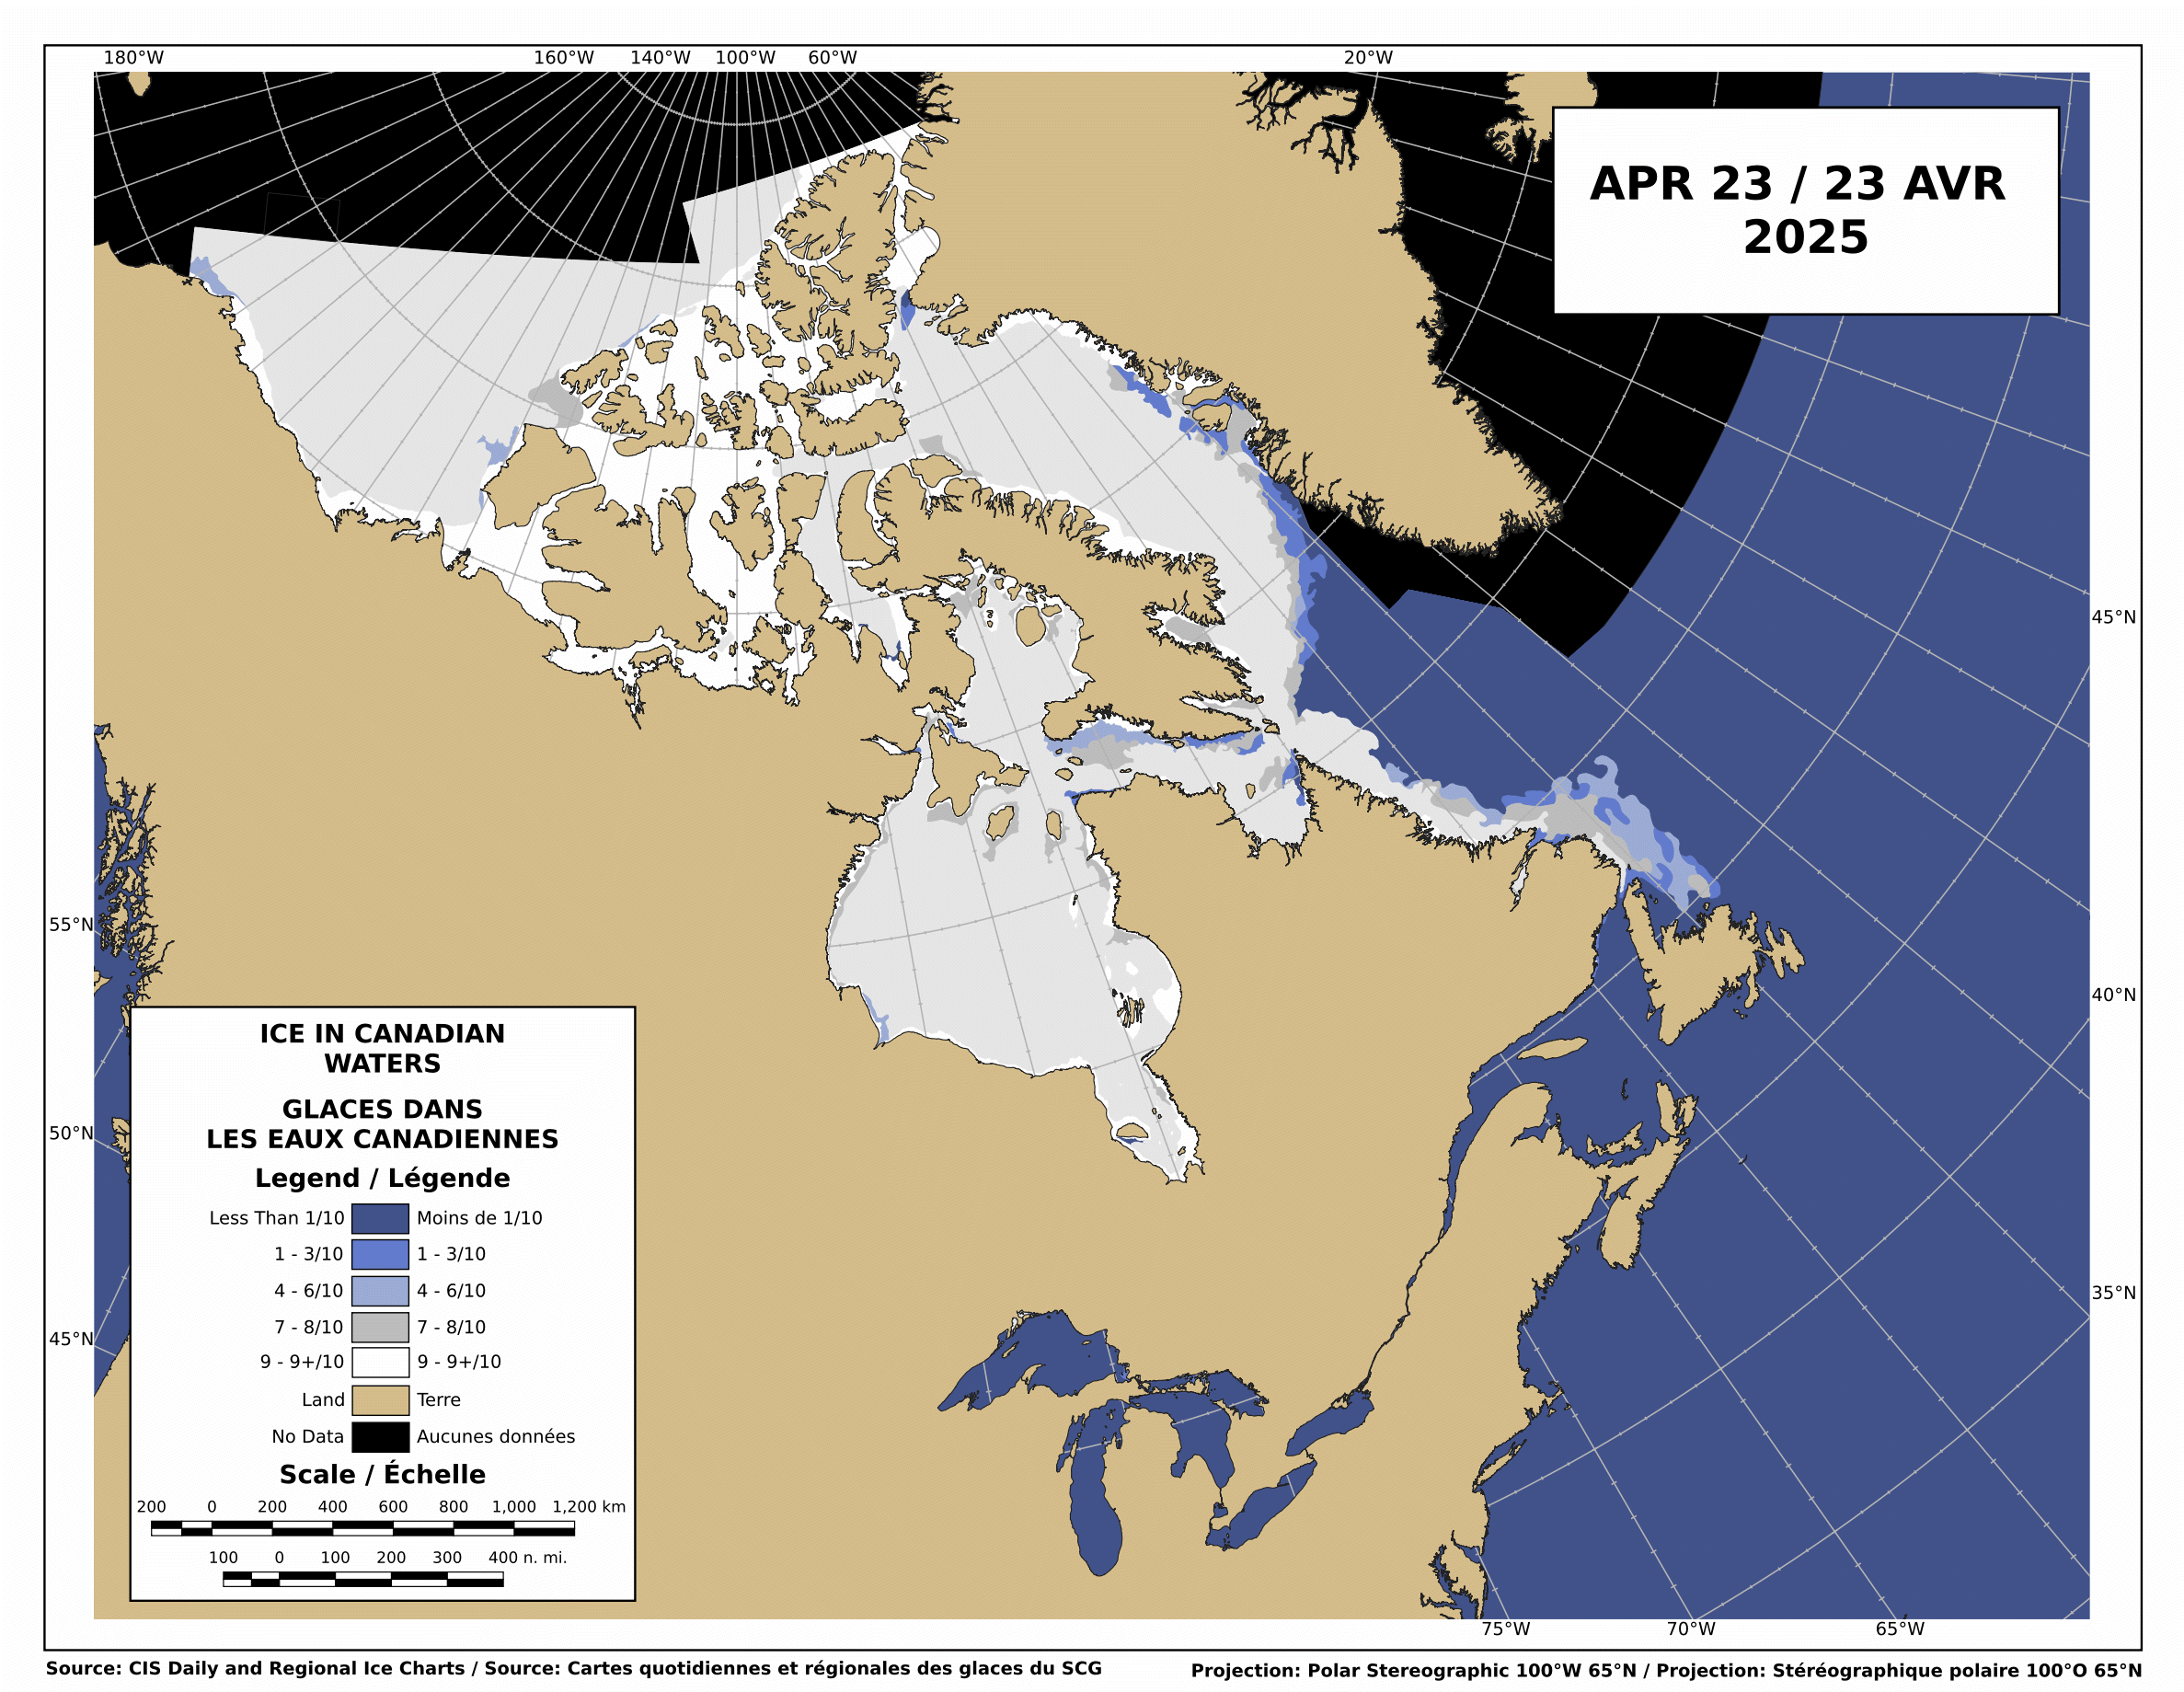
Despite one of the warmest winters and summers on record over the Canadian Archipelago, the Northwest Passage never fully opened this year. A few boats did manage to get through.

http://ice-glaces.ec.gc.ca/Ice_Can/CMMBCTCA.gif
Freezing temperatures are forecast from here on out

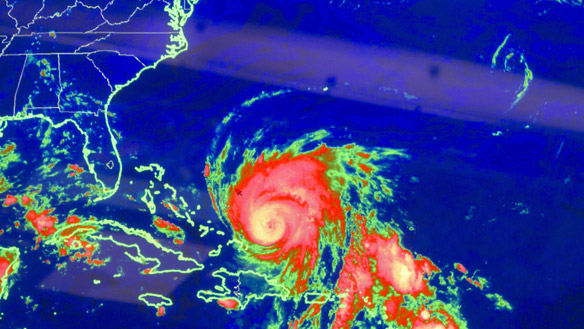
It has been widely reported that increasing CO2 produces more hurricanes. If that were true, we would expect to have seen an increase in hurricanes as CO2 has risen over the last 100 years. The graph below shows US hurricane strikes in blue, and major (category 3, 4, 5) hurricane strikes in red. The current decade is updated through September 3, 2010.
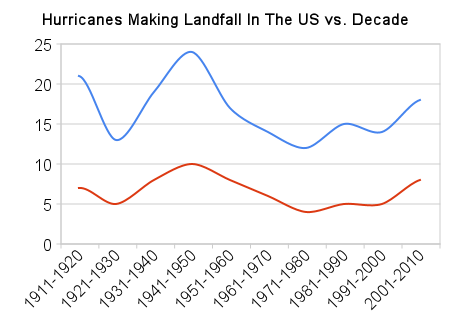
As you can see, the most active hurricane periods occurred over fifty years ago. Now, lets do a direct comparison between hurricane strikes and CO2.
The plot below shows US hurricane strikes (per decade) vs atmospheric CO2. As you can see, the most active decades occurred when CO2 was much lower.
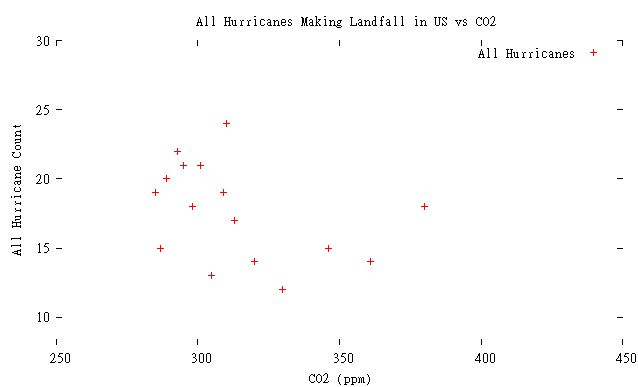
Conclusion: If there is a correlation between CO2 and hurricanes making landfall in the US, it is the opposite of what is predicted. As CO2 has increased, hurricanes have decreased.
Some of our friends have picked up on this fact and changed their tune. Now they say there will be fewer hurricanes, but more big ones. Again, this is easy to test. The plot below shows the number of major hurricanes (per decade) making landfall in the US vs. atmospheric CO2.
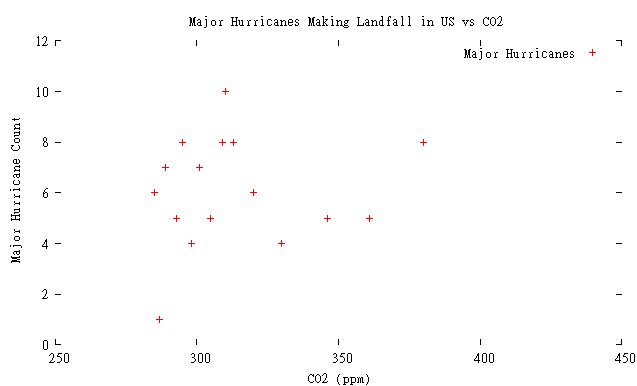
Again, there is no correlation between atmospheric CO2 and major hurricanes striking the US.
The last category five hurricane to make landfall in the US was Andrew in 1992.
A few weeks ago I explained on WUWT that the UT interpretation of GRACE gravity anomaly data was flawed, due to calibration problems caused by isostasy.
A new study from TU Delft, SRON and The Jet Propulsion Laboratory confirms my view.

September 2, 2010 by M & C
The melting of the ice sheets of Greenland and West Antarctica is about twice as slow as previously thought. The study, conducted by TU Delft, SRON and the Jet Propulsion Laboratory. The scientists published their findings in the September issue of Nature Geoscience.
The melting of ice sheets since 2002 is mapped with measurements of the two GRACE satellites. These detect from space small changes in the gravitational field of the earth. These changes are related to the exact distribution of mass on Earth, including ice and water. As ice melts and sea, is this influence in the gravity field.
Grace
The melting of ice sheets since 2002 is mapped with measurements of the two GRACE satellites. These detect from space small changes in the gravitational field of the earth. These changes are related to the exact distribution of mass on Earth, including ice and water. As ice melts and sea, is this influence in the gravity field.
Giga Tons
Based on this principle were previous estimates for the Greenland ice sheet at 230 gigatons of ice that melts each year (that’s 230,000 billion pounds). This results then in an average global sea level rise of about 0.75 mm per year. For West Antarctica was the estimated 132 gigatons each year.
With these results, it now appears, however, not corrected for glacial Isostatic adjustment, the phenomenon that the earth’s crust continues to soar due to the melting of large ice sheets of the last Ice Age, about 20,000 years ago. These movements of the crust should you take in the calculations for these vertical motions change the mass distribution of the earth and so they also affect the gravity field.
h/t to WUWT reader “seven”

Note the open water at the pole.
By contrast, the photo below was taken near the North Pole on August 14, 2010.

Now, here is the kicker. The photo below was taken at the pole, in March, 1959.

Do you still believe that the Arctic is melting down?

The blink comparator above shows the changes in UNISYS SST anomalies over the past week. Areas that are less than +/- 1ºC are marked as white.
So far, the hurricane season has been a little above normal.

http://www.weatherstreet.com/hurricane/2010/Hurricane-Atlantic-2010.htm
At this point, it seems like it is going to be difficult to make the case for a “very active hurricane season.”
[youtube=http://www.youtube.com/watch?v=6t0_sPcsJjA]
My June Arctic ice forecast continues to be right on track.
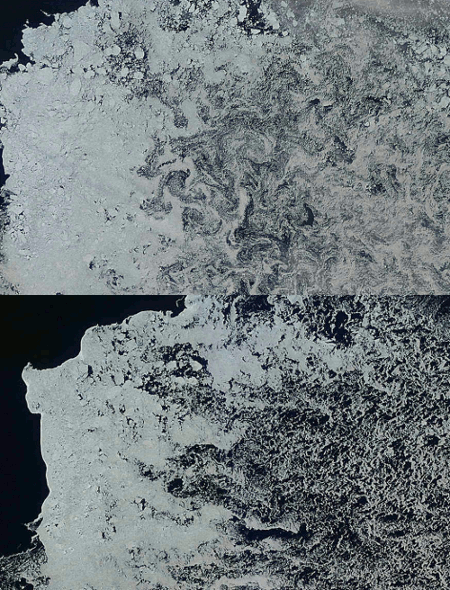
The blink comparator above shows the changes in the ice in the Beaufort Sea between August 15 and August 18, 2010. You can see several things happening.
The blink comparator below shows the PIPS ice movement during that same period. You can see the strong winds pushing the ice edge.
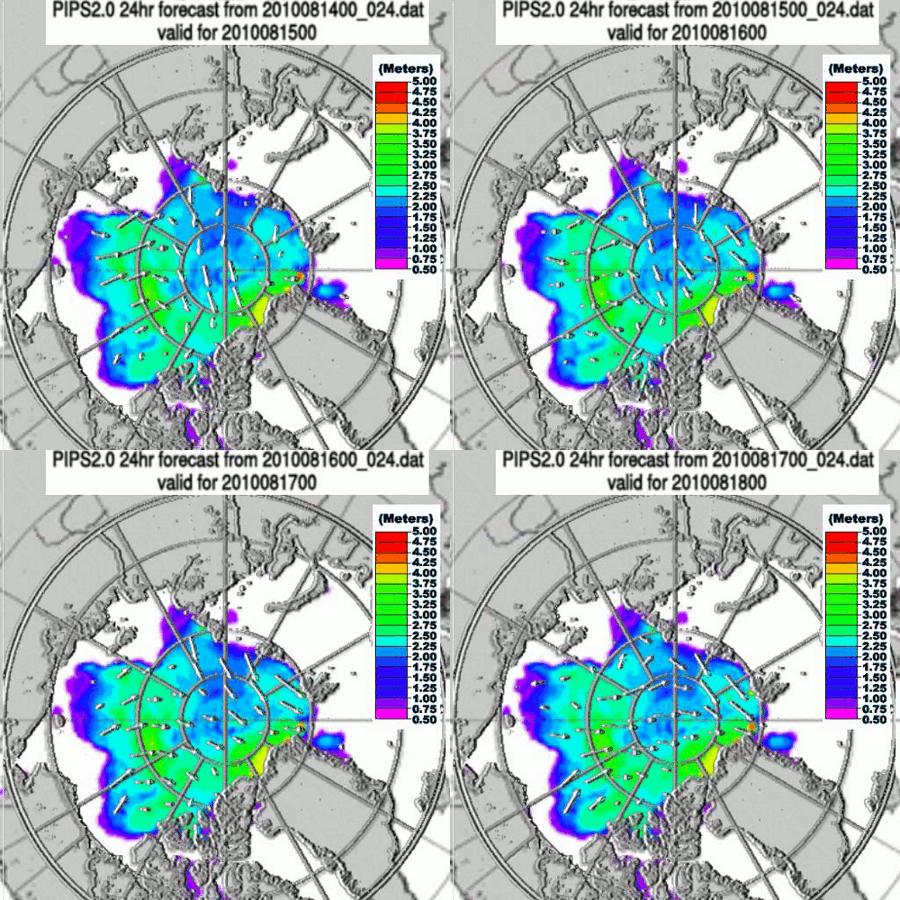
So what is melting the thin ice in the top image? Warm winds blowing off North America and Siberia.