James Hansen Compares Summer Heat Waves

Dr Hansen wrote :

What’s happening to our climate? Was the heat wave and drought in the Eastern United States in 1999 a sign of global warming?

Empirical evidence does not lend much support to the notion that climate is headed precipitately toward more extreme heat and drought. The drought of 1999 covered a smaller area than the 1988 drought, when the Mississippi almost dried up. And 1988 was a temporary inconvenience as compared with repeated droughts during the 1930s “Dust Bowl” that caused an exodus from the prairies, as chronicled in Steinbeck’s Grapes of Wrath.
http://www.giss.nasa.gov/research/briefs/hansen_07/

Go figure ….. Amazing how another decade without warming has changed his mind.

Posted in Hansen | 2 Comments

NSIDC Increases Their Arctic Forecast

During July, NSIDC was forecasting a September minimum of 4.74 million km²

http://www.arcus.org/search/seaiceoutlook/2010/july

In the August report, they have upped their forecast to 5.0 million km². This is just below my submitted estimate of 5.1 for the minimum, down from my June forecast of 5.5 million.

http://www.arcus.org/search/seaiceoutlook/2010/august

In June, NSIDC also forecast 5.5, which was identical to my June forecast.

Different methodologies, but we seem to be converging on similar numbers.

Posted in Uncategorized | 1 Comment

Welcome

Thanks for the nice response today from everyone. I plan to cover some new and interesting topics over the next few weeks/months/years. Some antagonists will no doubt be pleasantly surprised by my views on the environment.

Please tell all your friends!

Posted in Uncategorized | 4 Comments

Global Warming Vs. Street Crime

From The New York Times :

In the Wall Street Journal, Jean Guerrero writes an interesting article about how cities are fighting street crime by the simple act of leaving the lights on deeper into the night. (Other cities have tried Barry Manilow music, with some success.) But leaving the lights on all night doesn’t always jibe with a city’s budget plans — or its global-warming conscience:
Earlier this year, Joplin, Mo., reported a 47% drop in crime since 2007, when it started adding or replacing more than 1,000 lights throughout the city to reduce crime. And in other cities, like Fresno, Calif., plans to turn off street lights to cut carbon emissions and reduce costs have been thwarted by resistance from those with concerns about crime levels.

Posted in Uncategorized | 2 Comments

It Is Called Weather

After a hot summer, Bjorn Lomborg changes his mind and wants to spend $100 billion dollars to appease the global warming gods.

Bjorn Lomborg

‘Sceptical environmentalist’ and critic of climate scientists to declare global warming a chief concern facing world”

The world’s most high-profile climate change sceptic is to declare that global warming is “undoubtedly one of the chief concerns facing the world today” and “a challenge humanity must confront”, in an apparent U-turn that will give a huge boost to the embattled environmental lobby.

Full story at The Guardian

Posted in Uncategorized | 11 Comments

Ice Forecast Verification

The video below shows current ice (thin red line) my June forecast (dashed line) and NSIDC’s forecast summer minimum (red horizontal line.)  Who do you think is going to be closest?

[youtube=http://www.youtube.com/watch?v=_qTxK9OUpzM]

DMI shows ice extent almost unchanged over the last week.

Temperatures are forecast to be below freezing over the ice for the next two weeks

Posted in Uncategorized | 6 Comments

Election Temperature

http://www.hprcc.unl.edu/products/maps/acis/YearTDeptUS.png

We keep hearing about 2010 being the hottest year ever.  Objective and unbiased scientists are rushing this incorrect information to press before La Niña spoils their party, and before the ruling party gets tossed out of Congress.

So how are things looking in the US? Despite a very strong El Niño, 62% of the US has had below normal temperatures for the year through July. To make things clearer, I split the lower 48 up into above and below normal regions.

To be precise, there are 86725 pixels below normal, and 53336 pixels above normal. As La Niña takes hold, we should see the percentage below normal increase.

Philadelphia finished July with an average temperature of 80F. That is one degree cooler than the years 1793 and 1838, and tied July 1791, 1798, 1822, 1825, 1828, and 1830. July was almost as hot as it was 217 years ago, when CO2 was at 290 ppm.

62% of the country was below normal during the non-hottest (half) year ever. Remember that Obama won a “landslide” with only 52% of the vote. Or did he? The map below shows the 2008 election by county.

Counted by area, Obama won only 28% of the US in 2008. How will he do in 2012 after bypassing the US Constitution to force CO2 regulation on an unwilling populace, during a recession with 10% unemployment?

Meanwhile, on the other side of the pond.

The Prince of Wales says he believes he has been placed on Earth as future King ‘for a purpose’ – to save the world.

Posted in Uncategorized | 7 Comments

Juggling the Arctic

According to DMI, July was probably the coldest on record north of 80N.

Daily mean temperatures for the Arctic area north of the 80th northern parallel, plotted with daily climate values calculated from the period 1958-2002.

JAXA showed that July had the slowest Arctic ice melt on record.

Webcams and buoy data show us that this “summer” has been frigid near the north pole.

http://psc.apl.washington.edu/northpole/webphotos/noaa2.jpg

NSIDC reported that July had “cool, stormy weather” in the Arctic.

GISS is undaunted by these facts, and has released their July maps showing most of the region north of 80N above the 1958-2002 mean.

GISS July 1200 km smoothing

How did they accomplish this feat? But having little or no data north of 80N.GISS has algorithms to make up extrapolate data across vast distances with no data. In the image below, the black areas represent “missing data”

GISS July 250 km smoothing

GISS also shows all of Greenland as above normal for July, while NOAA anomaly maps show the Greenland Ice Sheet far below normal.

Once again, GISS has little or no data on the ice sheet.

Dr. Hansen (far and away the most highly respected climatologist in the world) at GISS wrote this earlier in the year:

the 12-month running mean global temperature in the GISS analysis has reached a new record in 2010…. GISS analysis yields 2005 as the warmest calendar year, while the HadCRUT analysis has 1998 as the warmest year. The main factor is our inclusion of estimated temperature change for the Arctic region.

http://www.columbia.edu/~jeh1/mailings/2010/20100601_TemperaturePaper.pdf

Conclusion : GISS has determined that 2010 is the hottest year on record, based on their belief that the Arctic has experienced anomalously warm Arctic temperatures. All available data from other sources shows us that July was anomalously cold in the Arctic.

GISS Arctic temperatures are incorrect, and as a result their global temperature rankings are highly suspect.

Posted in Uncategorized | Leave a comment

East Anglia Surveys Three Million Scientists, All Support Global Warming

Louise Gray reports in The Telegraph :

Professor Andrew Watson, a climatologist at the University of East Anglia, which was at the centre of last year’s ‘climategate’ scandal, said the extreme events are “fairly consistent with the IPCC reports and what 99 per cent of the scientists believe to be happening“.

I found that 99% number interesting, given that 31,000 scientists signed the “Global Warming Petition” – which states :

There is no convincing scientific evidence that human release of carbon dioxide, methane, or other greenhouse gasses is causing or will, in the foreseeable future, cause catastrophic heating of the Earth’s atmosphere and disruption of the Earth’s climate. Moreover, there is substantial scientific evidence that increases in atmospheric carbon dioxide produce many beneficial effects upon the natural plant and animal environments of the Earth.

For the sake of argument, let’s assume that every skeptical scientist signed that petition. In order to meet Dr. Watson’s 99% number, the other 3,069,000 scientists must all believe that global warming dooms the planet.

East Anglia climatology is known for it’s open and thorough research, and I am sure this is no exception.

Posted in Uncategorized | 2 Comments

Much Ado About Nothing in Greenland

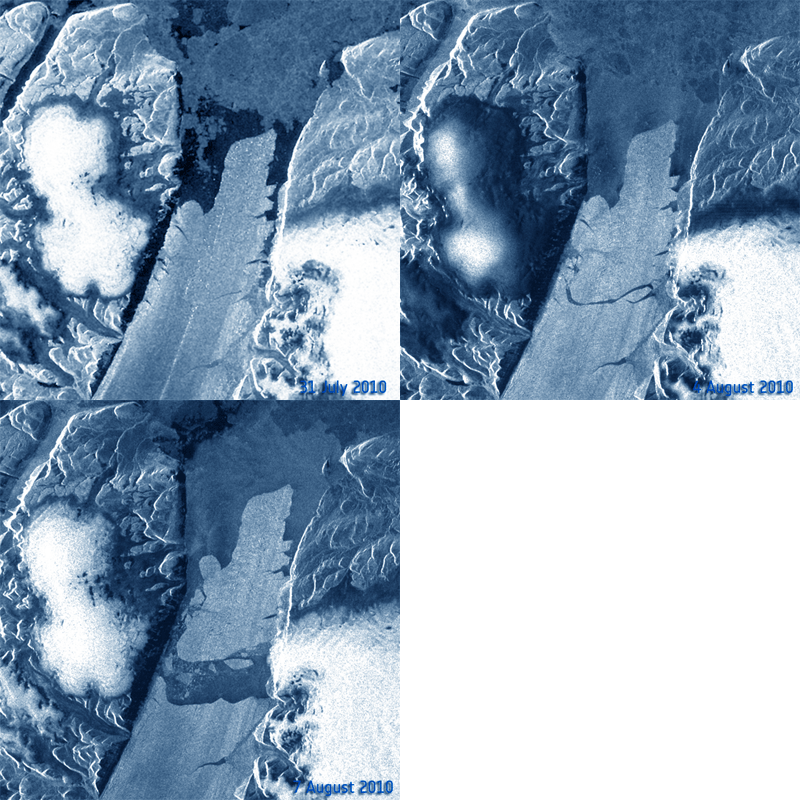
Earlier in the month, a chunk of ice broke off the Petermann Glacier in northern Greenland. The press of course ran with the story as proof of Global Warming, as Anthony forecast they would.

European Space Agency Animation

So what really happened there? The video below shows movement during the last month.

During periods of time when there is no sea ice abutting the glacier terminus, the glacier is exposed to waves. The waves rock the end of the glacier and produce stresses on the ice, which cause it to crack. The cracks can be clearly seen in the ESA image ahead of separation from the glacier.

Then southerly winds pulled the ice lose and moved it towards the north. You can see in the YouTube video above how the glacial and sea ice (to the north) are continuously being blown around by the wind. The ice island is stuck in the strait and rocking back and forth in the wind.

Similar events happen in the Antarctic and are also immediately blamed on Global Warming.

WHEN it comes to Antarctica’s disintegrating ice shelves, climate change often gets fingered as the cause. But it turns out global warming was not the only culprit behind the continent’s biggest ice break-up in recent years.

The 3200-square-kilometre Larsen B ice shelf broke apart between January and March 2002 following a series of warm summers, and after melt ponds had formed on the ice shelf. The abruptness of the break-up led many scientists to lay the blame squarely on climate change. “But the picture is much more complicated,” says Neil Glasser of Aberystwyth University in the UK.

When Glasser and Ted Scambos of the University of Colorado at Boulder – who has been tracking the increased movement of glaciers near the erstwhile Larsen B – reviewed satellite images from 1987 onwards, they saw giant rifts and crevasses created by long-term glaciological processes. These alone could not have caused the break-up, but probably came into play once a warming climate had thinned the ice (Journal of Glaciology, vol 54, p 3).

The Petermann ice island is 625 feet thick. Not likely that “thinning” had much to do with it breaking off.

NPR reports incorrectly (of course) on the chunk of ice :

August 13, 2010 The ice island is now drifting south through the Nares Strait between Greenland and Canada. Experts aren’t sure whether it will make it all the way to the Atlantic and what damage it might cause on its way.

The ice island is stuck in the channel and has not made it to the Nares Strait, which is now choked with ice.

Trudy Wohlleben of the Canadian Ice Service discovered the ice island. This is what he had to say :

On the northwest coast there is a glacier, Petermann Glacier, which is known for calving off large tabular icebergs or ice islands. We’ve been monitoring this glacier for a while expecting a large piece to fall off, and on August 5 a large section actually did break off – much larger than we actually anticipated. It was about 30 kilometers (18.6 miles) long and 10 kilometers wide…..Calving of ice islands is indeed quite average. I think what’s special about this instance is just that it’s so much bigger than any other one that’s calved. The last large one of this size was back in the ’60s. So I think it’s just the sheer size of this ice island which has everyone so excited – and perhaps also that it’s all in one enormous piece.

Conclusion : There is little or no evidence  that “global warming” had anything to do with this event, but the press has done their damage by misinforming the public once again.

“Even a big piece like this over 50 years is not that significant.  It’s just the normal rate,” he said. Muenchow warns people not to jump to conclusions. “An event like this, this specific event, all flags go immediately up, ‘Oh, let’s explain this by global warming.’ I cannot support that,” he said.

———————————————————————————————————————-

“All the global warming hysteria that is fit to print”

Posted in Uncategorized | Leave a comment