

There can be little doubt the the EU officials frequent trips to Fiji will greatly help the polar bears.
http://www.travel-guider.com
There can be little doubt the the EU officials frequent trips to Fiji will greatly help the polar bears.

When is a “Global Temperature” not global? When it only covers maybe 15-20% of the earth’s surface with actual thermometers.
Stooopid me, I assumed that when Hansen published the graph above in 1999, that it actually was a global temperature graph. So I wrote a really stoopid post based on it.
http://wattsupwiththat.com/2010/08/29/gisstimating-1998/
I will try to not be so stoopid in the future.
[youtube=http://www.youtube.com/watch?v=adXkVq8aVUg]
Cold, calm weather has arrived in the Arctic for the time being, and my June forecast so far is almost perfect.

But as we know, ill winds can arrive at any time to torment the boastful.
Unfavorable winds kept the fleet from setting out for Troy. Calchas, a soothsayer, blamed the ill winds on Agamemnon, whose boastful claim that he could hunt better than Artemis had offended that goddess. The soothsayer insisted that Agamemnon appease the goddess by sacrificing his daughter, Iphigenia.
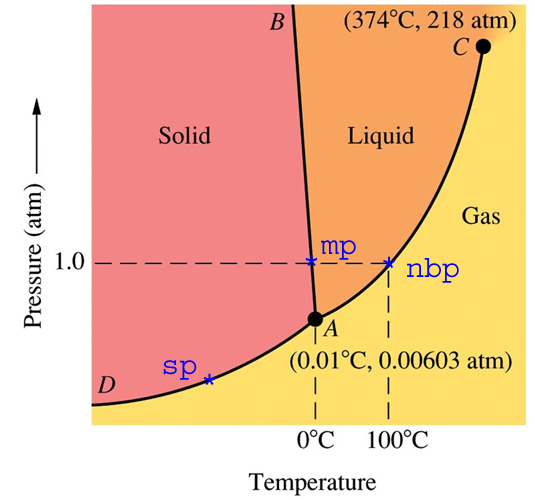
http://math.nyu.edu/~gladish/teaching/eao/water-phase-diagram.jpg
A phase diagram represents a perfect equilibrium closed system. Such a system can not actually exist, because there are no impermeable materials and no perfect insulators.
The phase diagram above represents an impermeable container (with zero thermal conductivity) containing pure water, filled to the brim and sealed.
For now, let us consider the case of one atmosphere pressure. At 1ºC, the container would contain only liquid water, no solid and no gas. At minus 1ºC, the container would contain only solid, no liquid and no gas. At 0C, (mp on the diagram) there would be a mixture of solid and liquid, but no gas.
Now, let’s slide to the right along the dashed line towards nbp. We get up to 90ºC (194ºF) and still no water vapour. There is no water vapour until we get to the boiling point at 100ºC.
Does this make sense? We all know that lots of steam comes off our pot of water before it boils. That is how a humidifier works. Does this mean that the phase diagram is wrong? Does it mean that our eyes deceive us?
No, it means neither. The phase diagram represents a closed system at equilibrium – which does not represent the real universe. It requires skill and experience to know how to use a phase diagram correctly.
Now, back in the real world. Imagine a field full of wet snow, complete radiative darkness, 100% humidity at 0ºC. The snow would theoretically remain on the ground forever, in equilibrium with the liquid and gas phases present. If the temperature went up to 1ºC, all of the snow would eventually melt and there would be only two phases – liquid and vapour. If the temperature instead dropped to minus 1ºC, all of the water would freeze, leaving only solid and vapour.
We can learn a lot from phase diagrams, if we understand how to use them – and what their limitations are in the real world.
———————————————————————————————–
When writing about the Arctic, I am talking about the real world of melting, freezing, sublimating and condensing water. I am not talking about pure academic theory, because nothing in the physical world works that way.
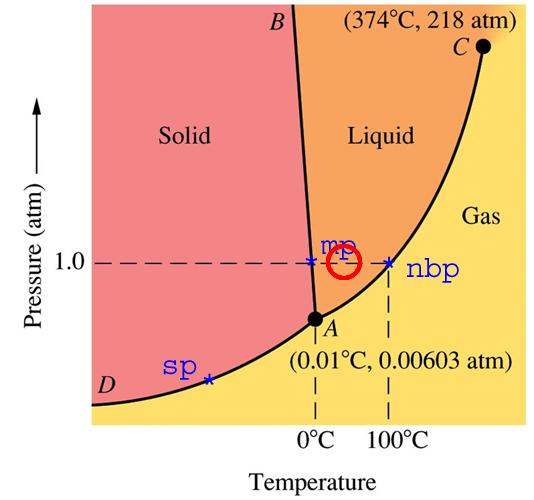
http://math.nyu.edu/~gladish/teaching/eao/water-phase-diagram.jpg
A person inexperienced with interpreting phase diagrams would conclude that no water vapour (gas phase) can exist below the boiling point.
Consider the red circle. Temperature is 40C and one atmosphere pressure – a typical day in the Amazon jungle. The phase diagram shows no gas phase, yet we know the humidity in the Amazon jungle is very high. Obviously, the phase diagram does not represent the real world.
Phase diagrams represent perfect equilibrium conditions in a closed system, which never exist on earth. A skillful scientist understands this, yet uses the important information contained in the phase diagram to her/his benefit.
In the Arctic, when temperatures are close to 0C – water exists in all three phases solid/liquid/gas. We are all familiar with this. We don’t have to drop the atmospheric pressure to the boiling point of water at 0C (0.00603 atmosphere) to have water vapour in the air.

Seven billion people share this planet. We have finite resources of clean air and water, food, fossil fuels, and other essential resources. Yet we squander these resources, which should be our children’s inheritance.
Some people claiming to be environmentalists see these problems and conclude that it is their responsibility to scare the “little people” into submission. This is both arrogant and foolish. As Rocky pointed out in “Chicken Run” you don’t motivate people with talk of death and disaster.
I hate driving cars around town, so I ride my bicycle almost everywhere (200+ miles per week.) I only get in a car if I have no other option. I do this because it makes me feel good.
I eat about 1/4 what most people eat. That also makes me feel good, and lets me run circles on the soccer pitch around kids one-third my age. I make lifestyle choices which are good for myself, and good for the environment.
It sucks being stuck in traffic jams. My bicycle liberates me from that. I hate feeling bloated. My eating choices liberate me from that.
There is no conflict between a good life and environmentally sound decisions.
Liberate yourself from your car and your food. You will be glad you did, and so will your descendants.
Had Crut July temperatures are out, and continue to track cooler than 1998.

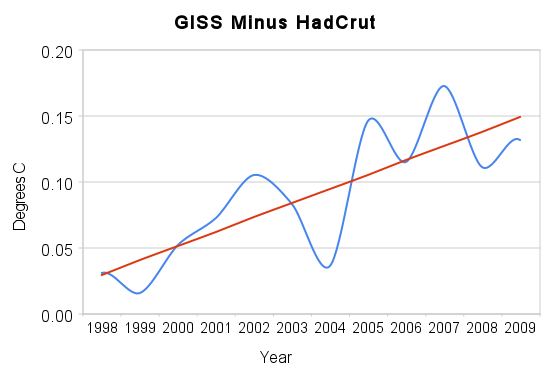
Since 1998, GISS and Had Crut annual temperatures have been diverging at a rate of about 1°C per century. The graph below shows the normalised trends for GISS, UAH, RSS and HadCrut from 1998-2009.
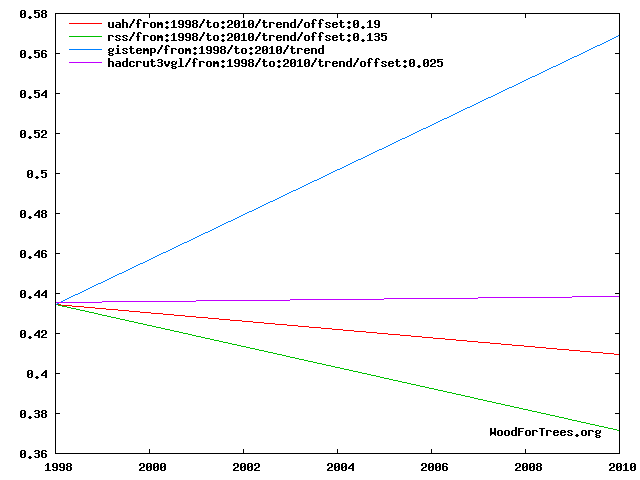
GISS shows warming from 1998-2009. Everyone else shows flat or slight cooling.
The March 1, 1975 edition of Science News included the graph below. It showed that Northern Hemisphere temperatures dropped by 0.4 degrees between 1940 and 1970.
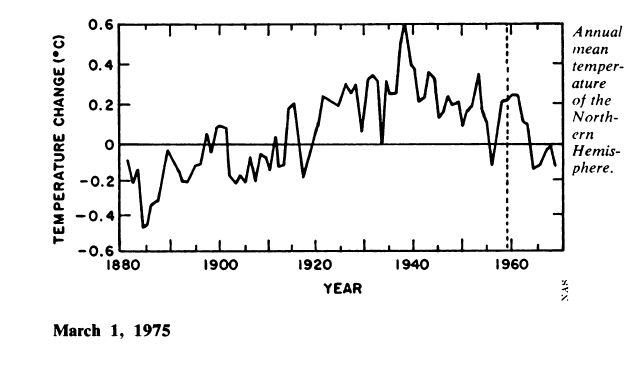
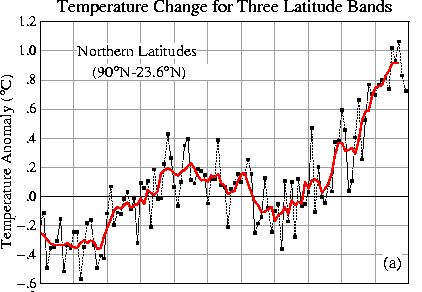
The current GISS northern hemisphere graph (1900-present) is shown below. It shows a smaller drop.
The image below shows the 1975 graph (green) overlaid on the GISS graph. Both graphs have the same scale. The 1975 graph is offset by 0.25 degrees.
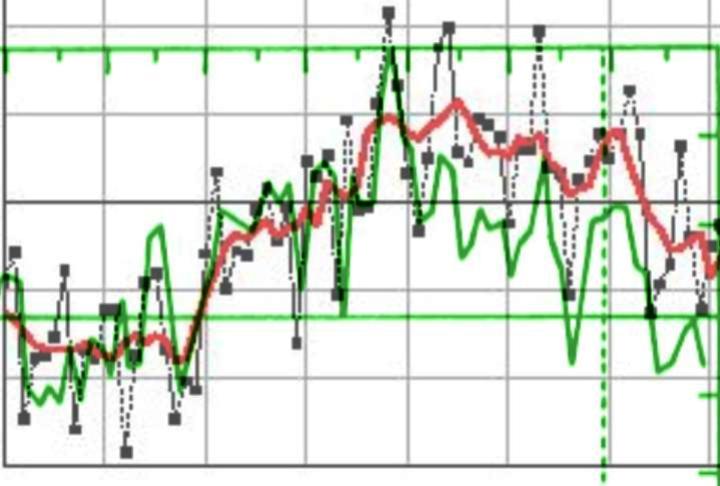
Note that both graphs agree closely from 1900 to 1940. But GISS shows a much smaller cooling from 1940 to 1970. The latitude bands are not identical, but the missing tropics show less cooling- which would make the discrepancy larger if they were included in the GISS graph.
Look for something along the lines of “Heavy snow, followed by heat, followed by a hurricane. Proof of global warming.“


