
Disrupting the Borg is expensive and time consuming!

Google Search
-
Recent Posts
- Is Antarctica Melting?
- High Speed Analysis And Visualization
- El Nino To The Rescue?
- Fake News Update
- Growth Of Antarctic Sea Ice
- 65 Years Of Progress!
- El Nino To The Rescue?
- Worst March Drought On Record
- ChartGL Process Control Demo
- The Biggest Money Laundering Scam
- Drought In The Headwaters Of Lake Powell
- Unrealistic Expectations Of Water Availability
- Did Bill Gates Do This?
- Worst March Drought On Record In The US
- The Real Hockey Stick Graph
- Analyzing The Western Water Crisis
- Gaslighting 1924
- “Why Do You Resist?”
- Climate Attribution Model
- Fact Checking NASA
- Fact Checking Grok
- Fact Checking The New York Times
- New Visitech Features
- Ice-Free Arctic By 2014
- Debt-Free US Treasury Forecast
Recent Comments
- conrad ziefle on Is Antarctica Melting?
- Gordon Vigurs on Is Antarctica Melting?
- Bob G on Is Antarctica Melting?
- conrad ziefle on High Speed Analysis And Visualization
- Bob G on 65 Years Of Progress!
- Bob G on 65 Years Of Progress!
- Gordon Vigurs on 65 Years Of Progress!
- arn on 65 Years Of Progress!
- arn on 65 Years Of Progress!
- Bob G on 65 Years Of Progress!
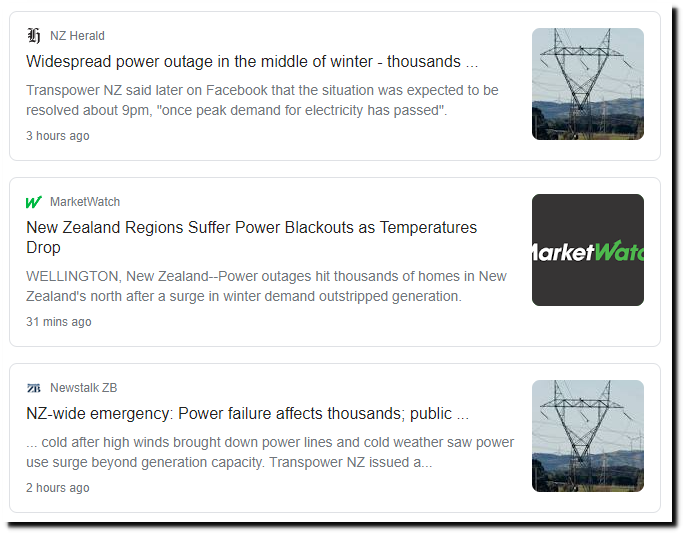
New Zealand’s Green Energy Success
New Zealand hopes to save their population from global warming by freezing them.
Posted in Uncategorized
Leave a comment
Snake Oil
Iceland is the world’s sixth most vaccinated country, and they have more active cases than at any point in the last two years.
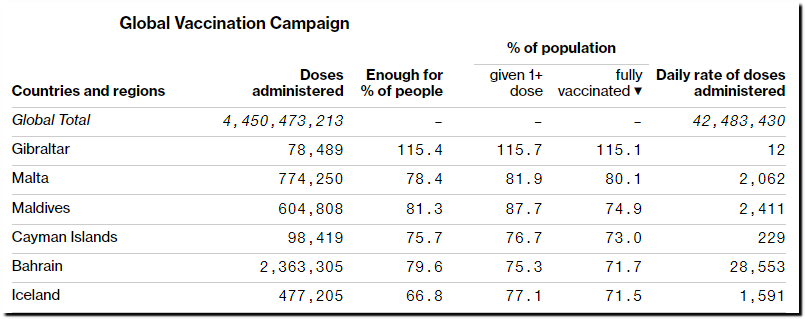
More Than 4.45 Billion Shots Given: Covid-19 Vaccine Tracker
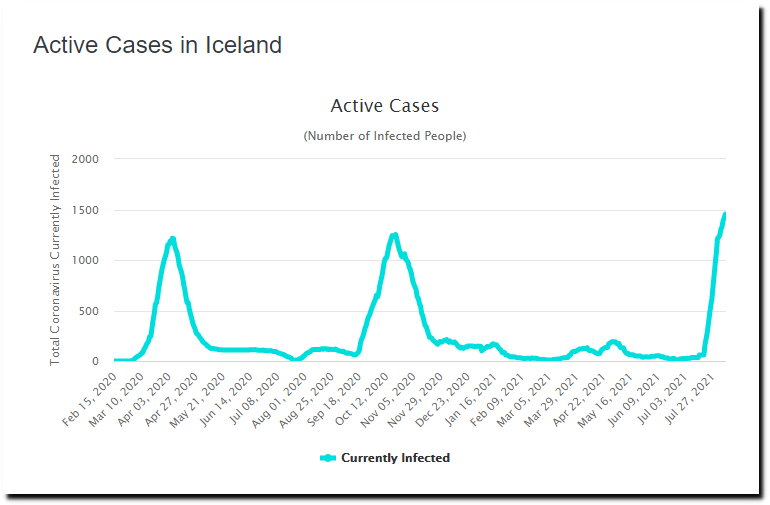
Iceland COVID: 8,793 Cases and 30 Deaths – Worldometer
Since the start of the plandemic, the world’s population has increased by more than 100 million people.
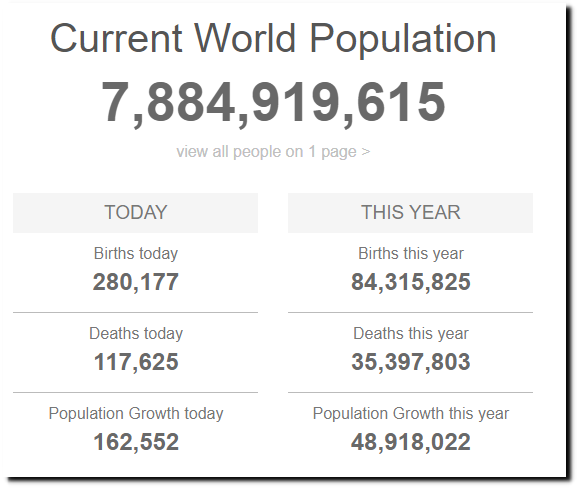
World Population Clock: 7.9 Billion People (2021) – WorldometerWorldometer
Posted in Uncategorized
Leave a comment
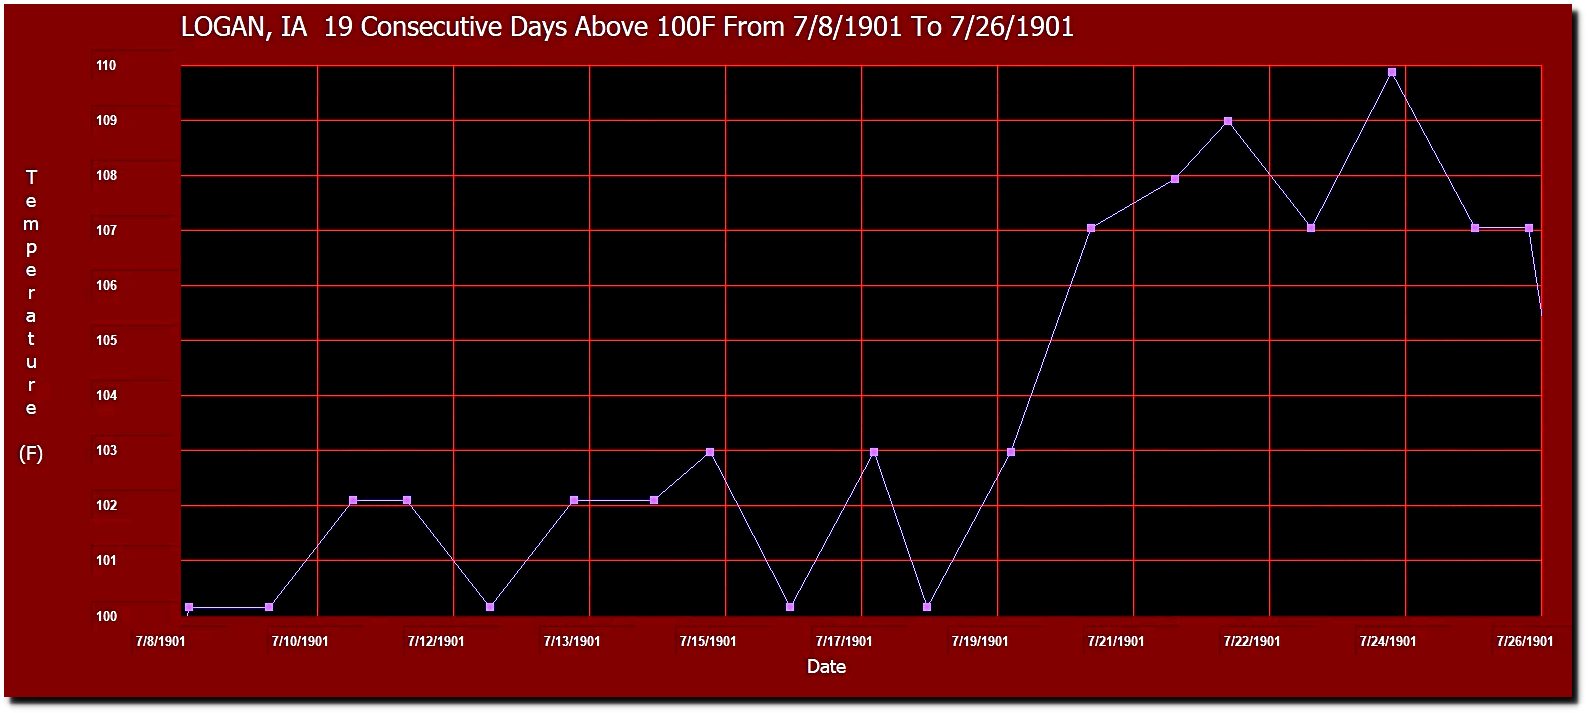
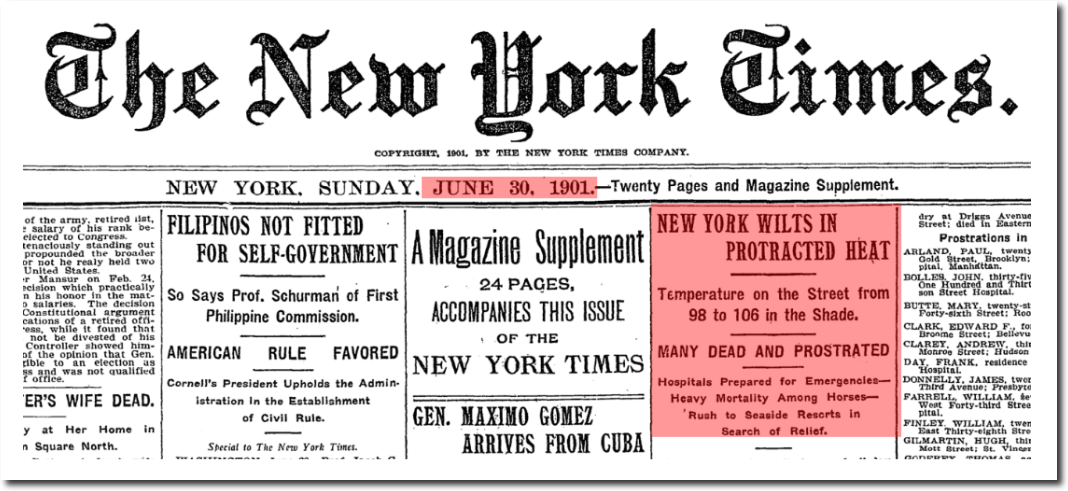
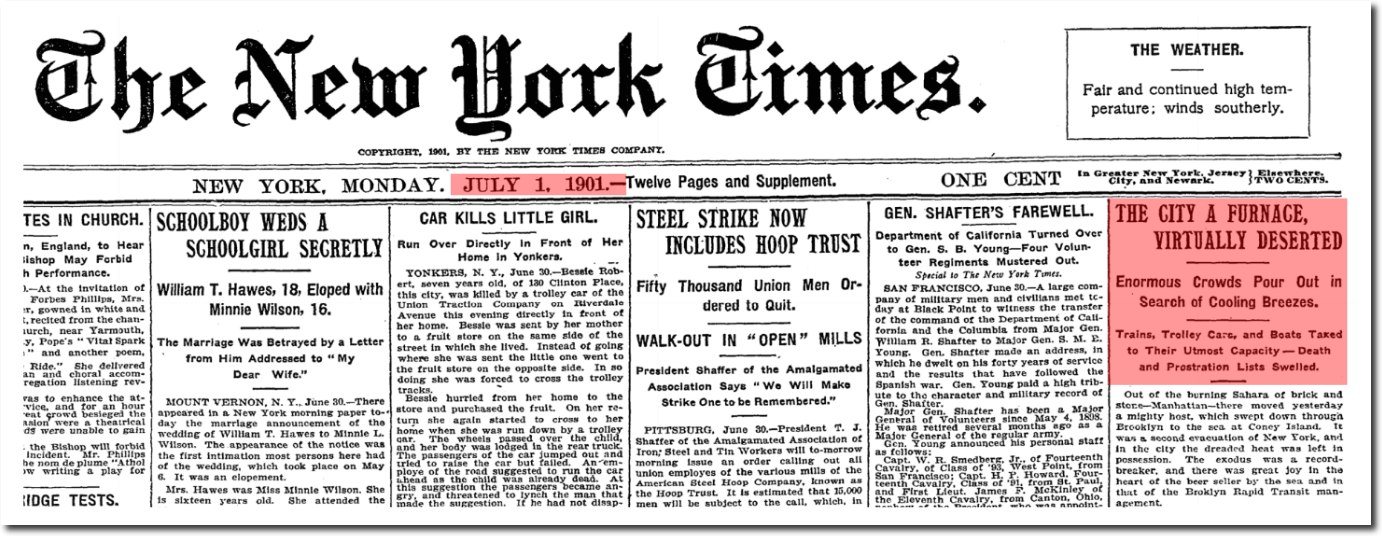
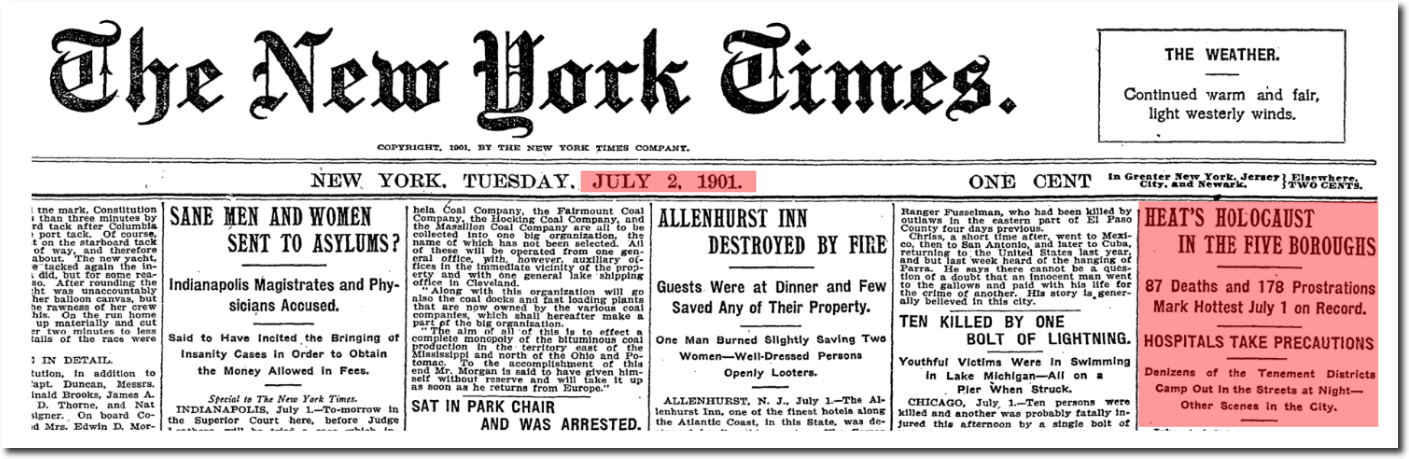
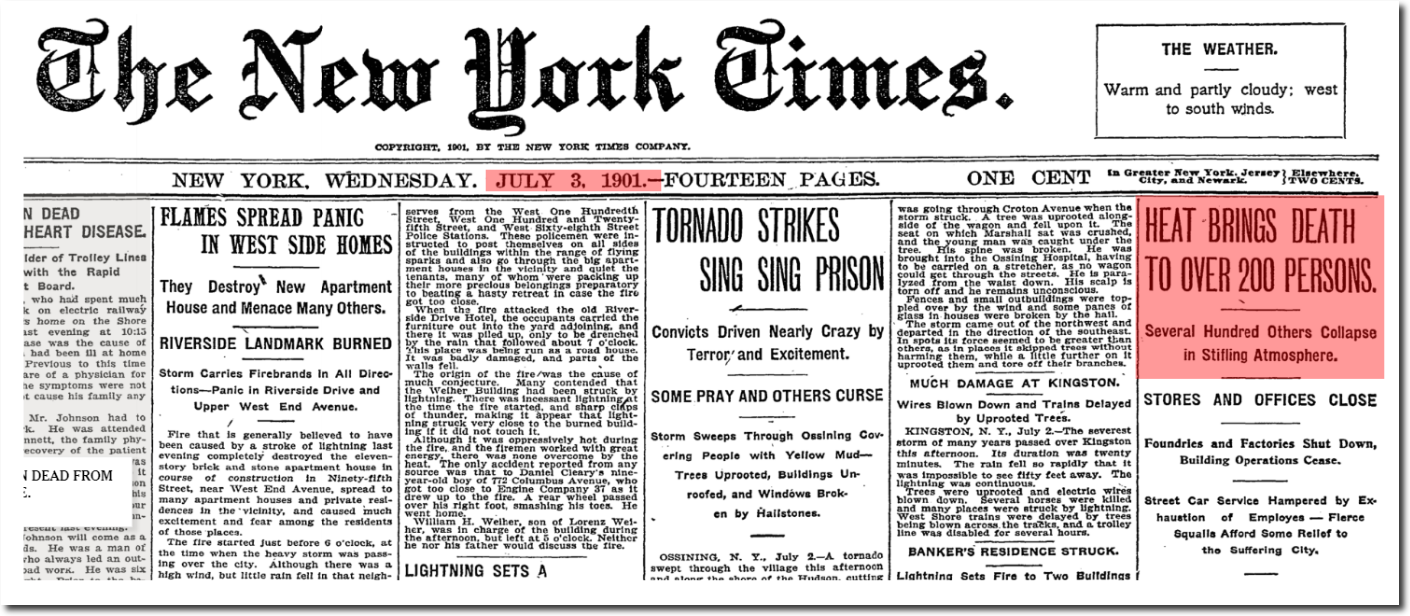
The Second Hottest July
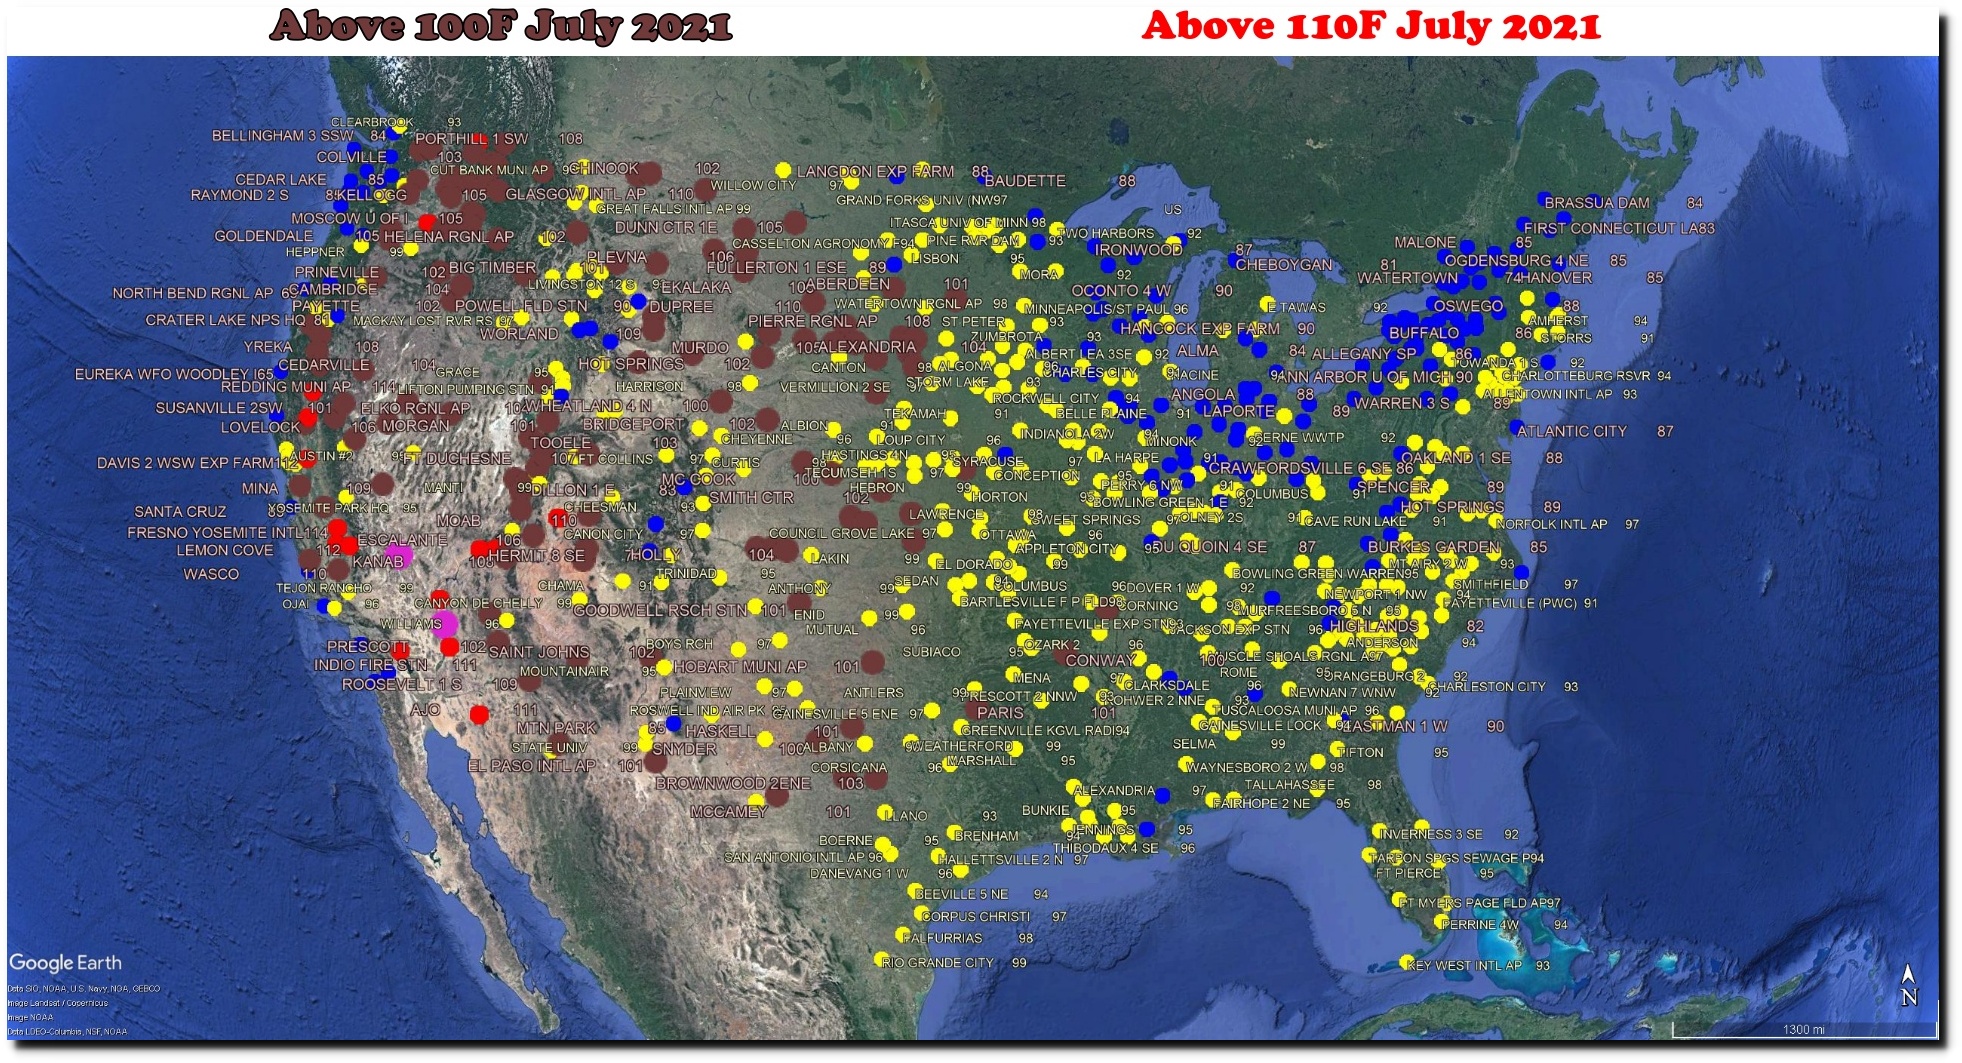
July 1901 was the second hottest July in the US.
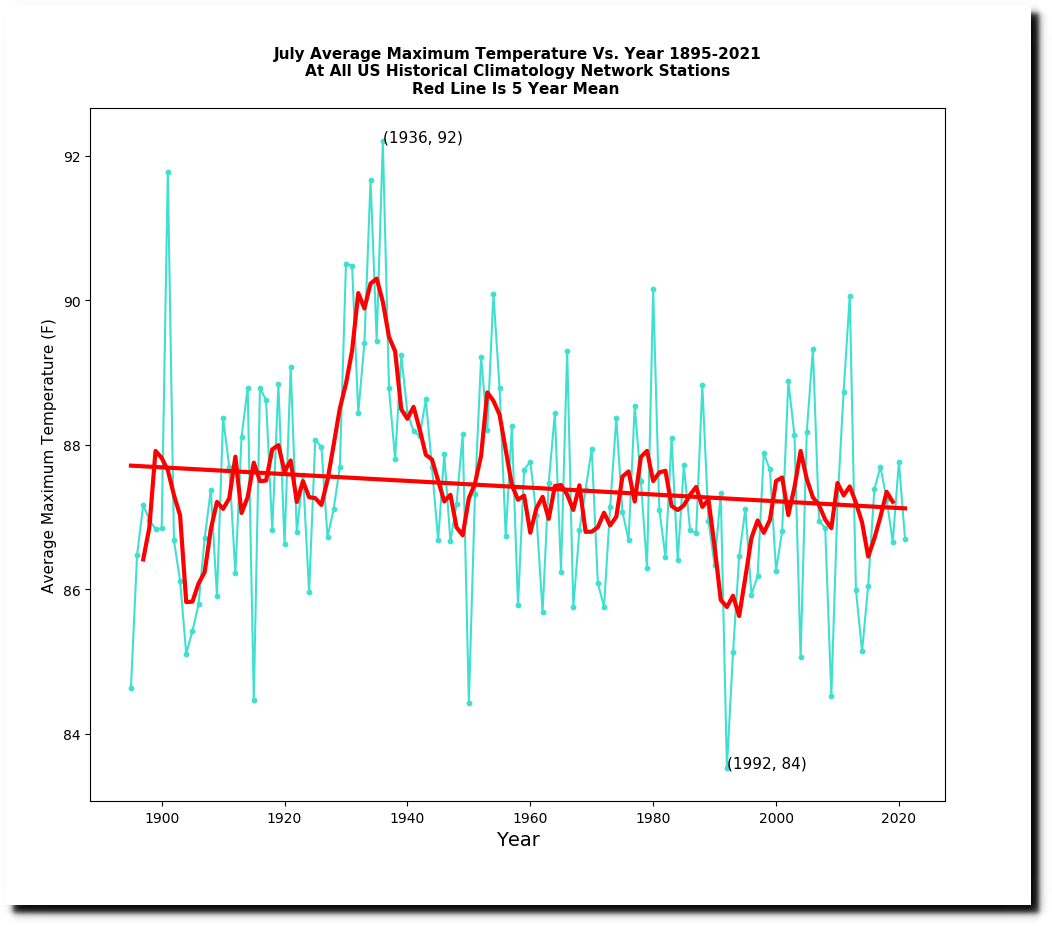
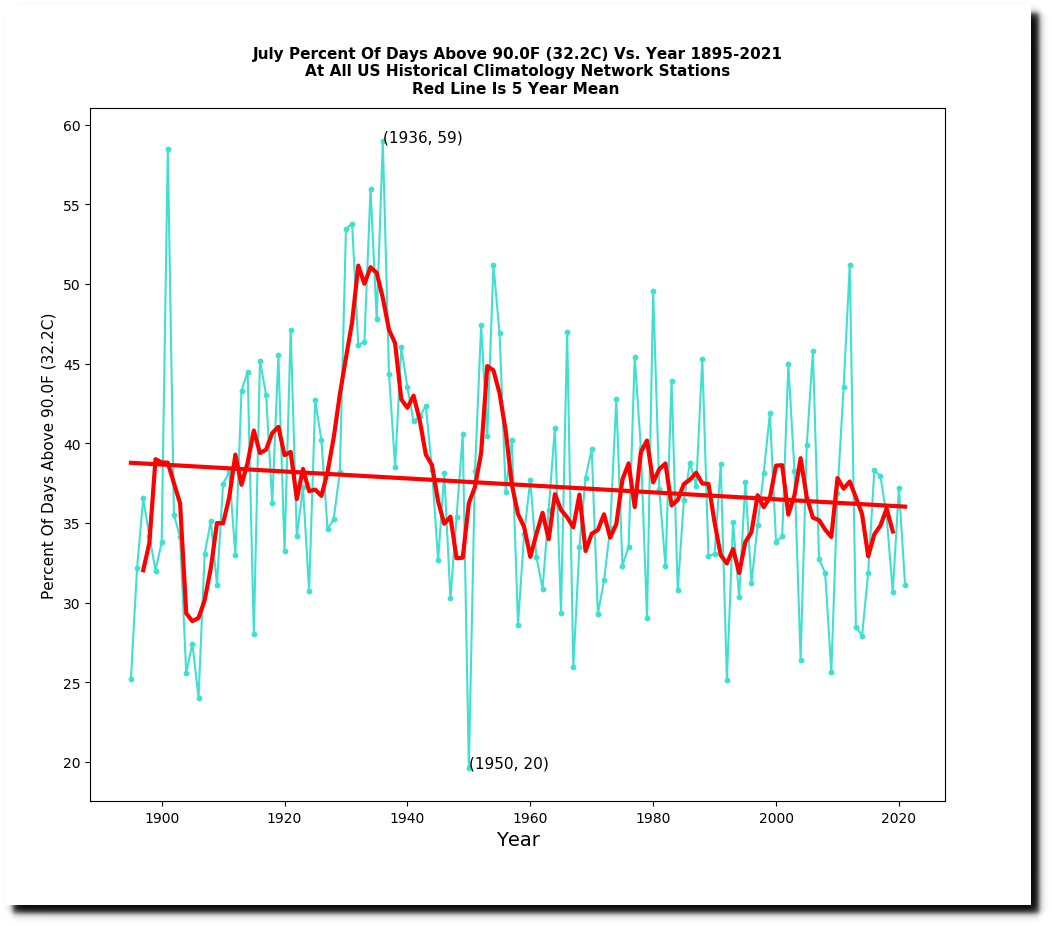
During July 1901, Arizona, Missouri, Oklahoma, Arkansas, Illinois, Indiana, Utah, Kansas, Wisconsin, Iowa, Montana, Nebraska, Tennessee and Texas were over 110F and all but six states were over 100F.
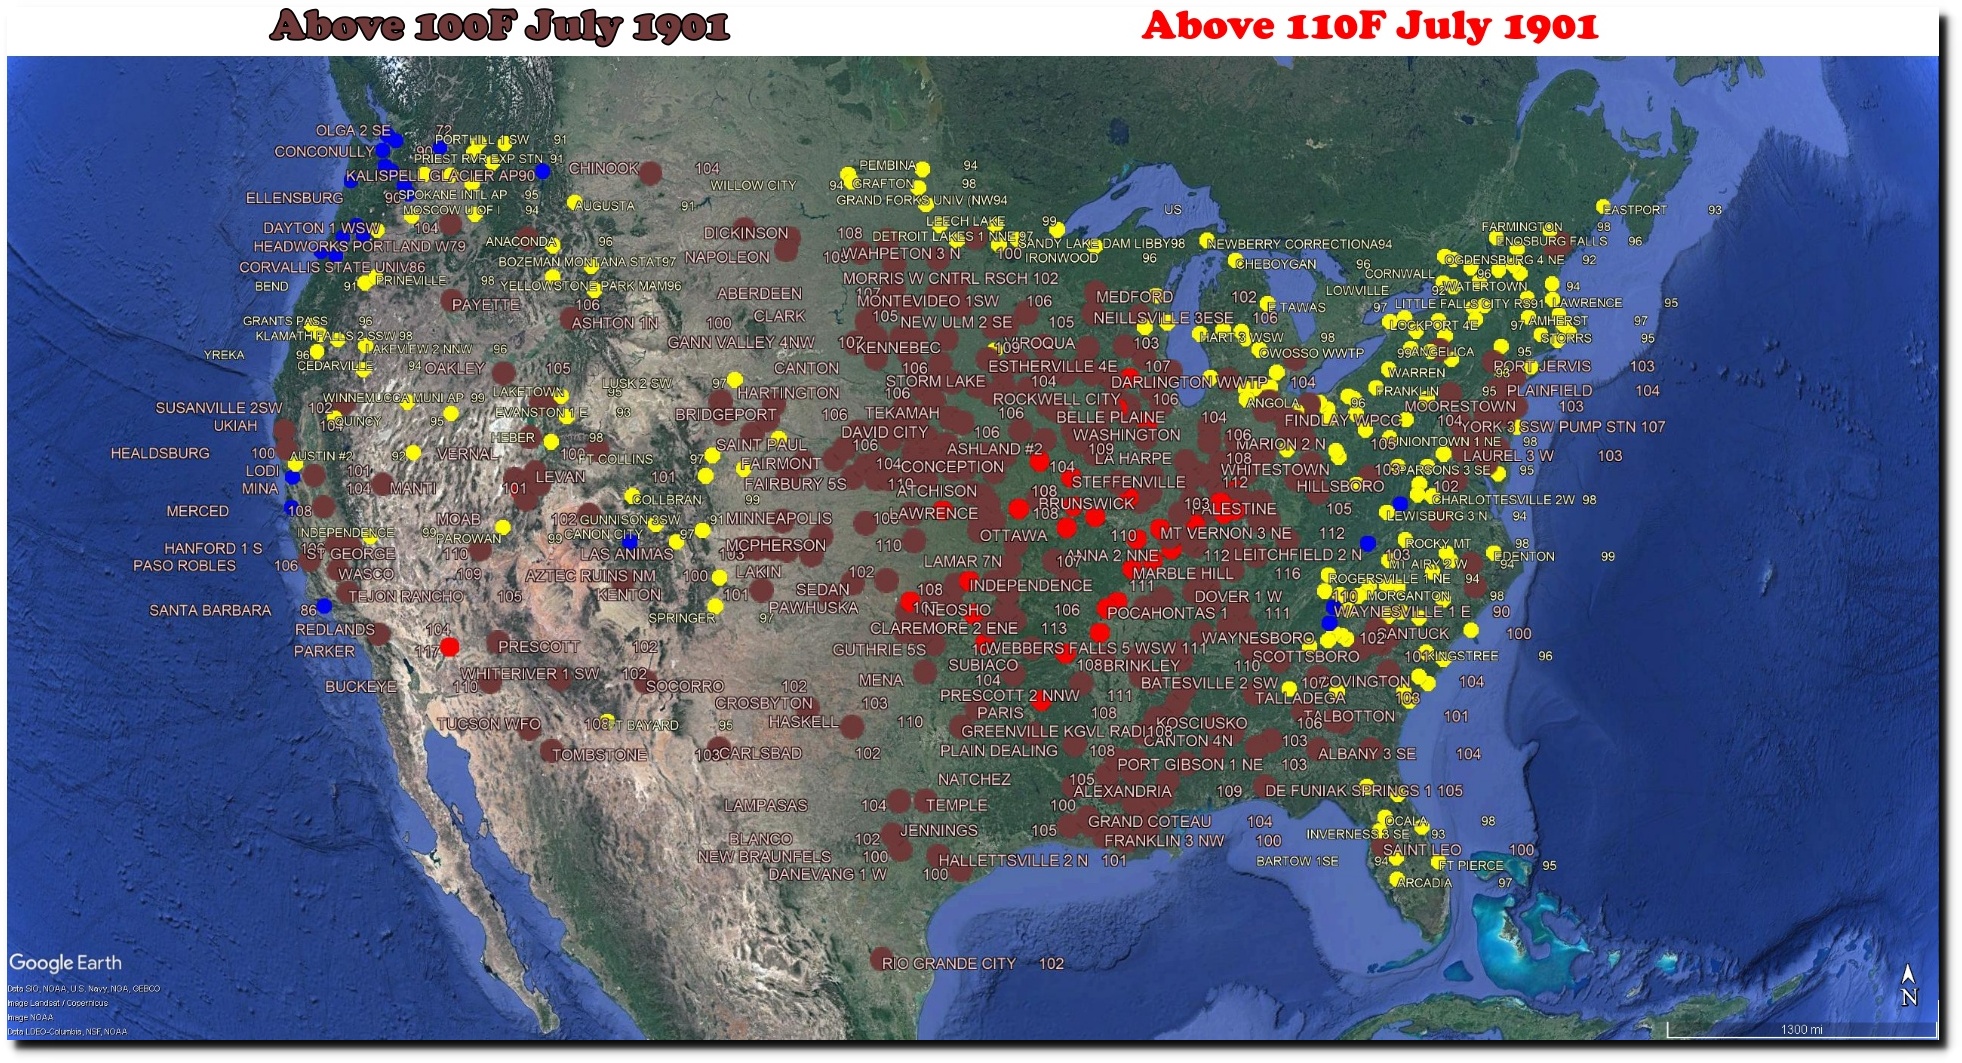
Logan, Iowa had nineteen consecutive days above 100F from 7/8/1901 to 7/26/1901, which was Iowa’s record.
The heat drove James Kincaid to suicide on his wedding eve.
 26 Jul 1901, 3 – Evening Times-Republican at Newspapers.com

26 Jul 1901, 1 – The Courier at Newspapers.com
Scientists blamed the 1901 heat on the sun.
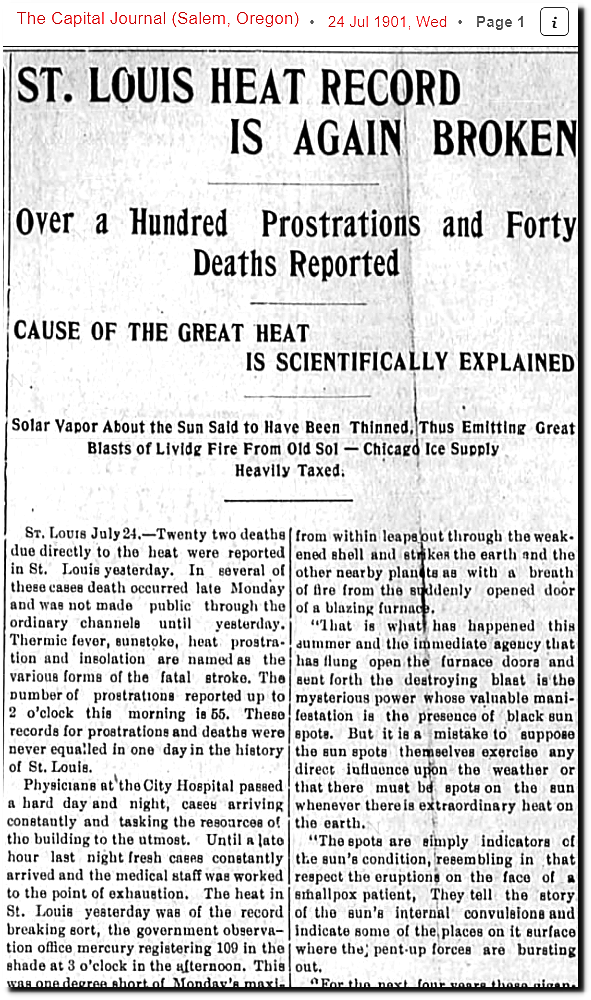
24 Jul 1901, Page 1 – The Capital Journal at Newspapers.com

24 Jul 1901, 2 – The Weekly Sentinel at Newspapers.com
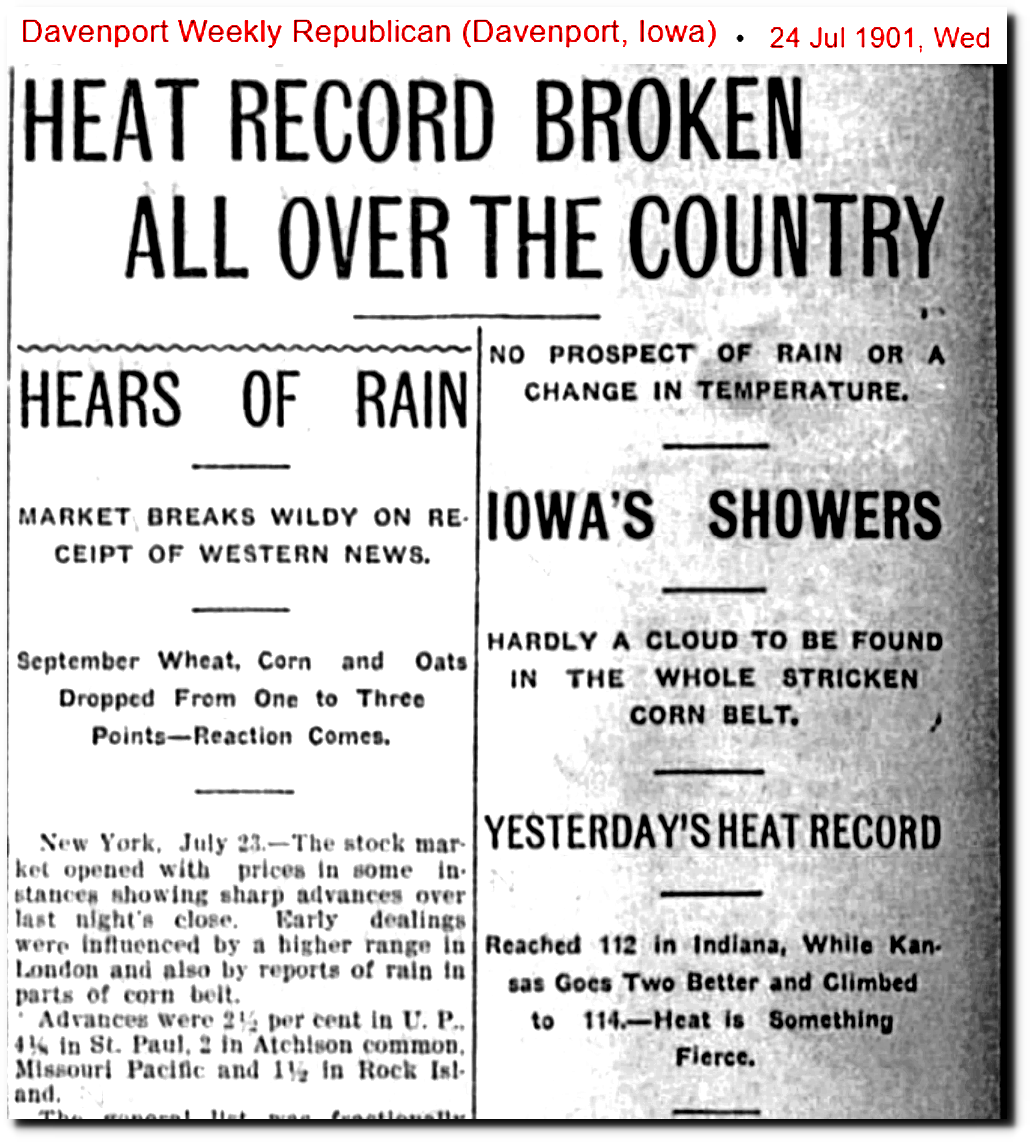
24 Jul 1901, 1 – Davenport Weekly Republican at Newspapers.com
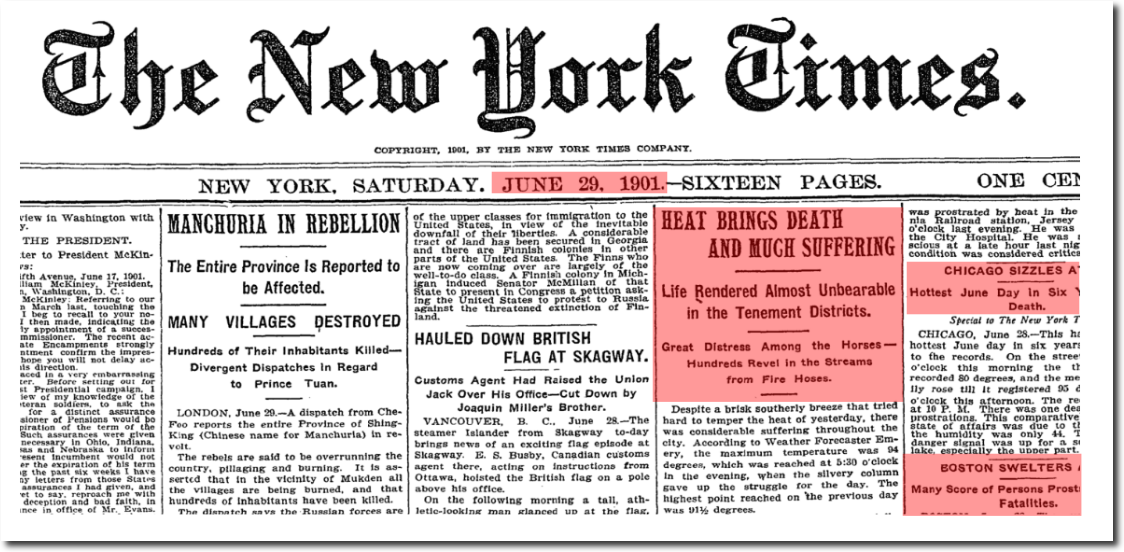
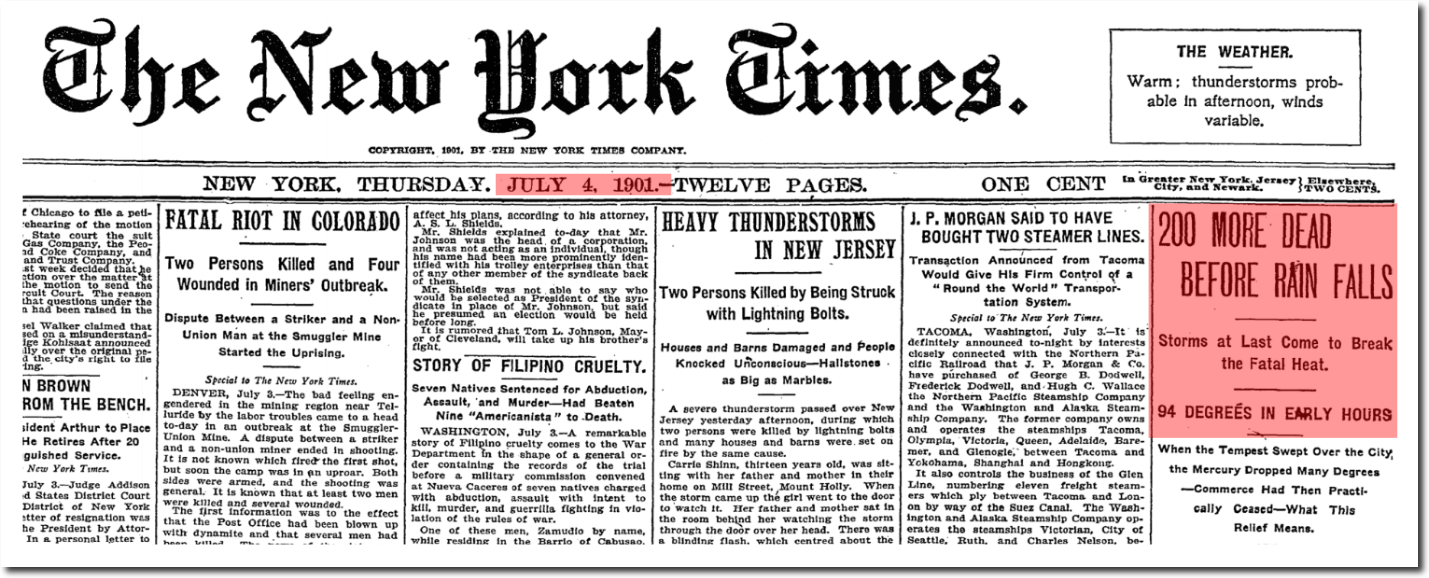
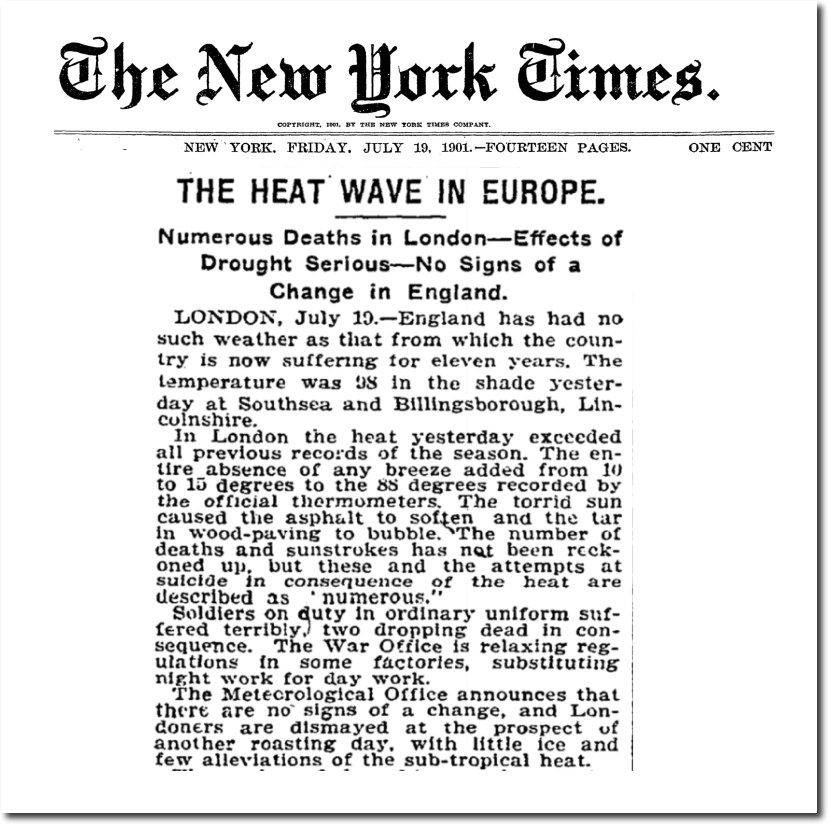
Later in July 1901, the heatwave expanded to Europe
Posted in Uncategorized
Leave a comment
Man-Made Sea Level Rise
In 1988, NASA’s James Hansen told the US Senate that global warming had begun.
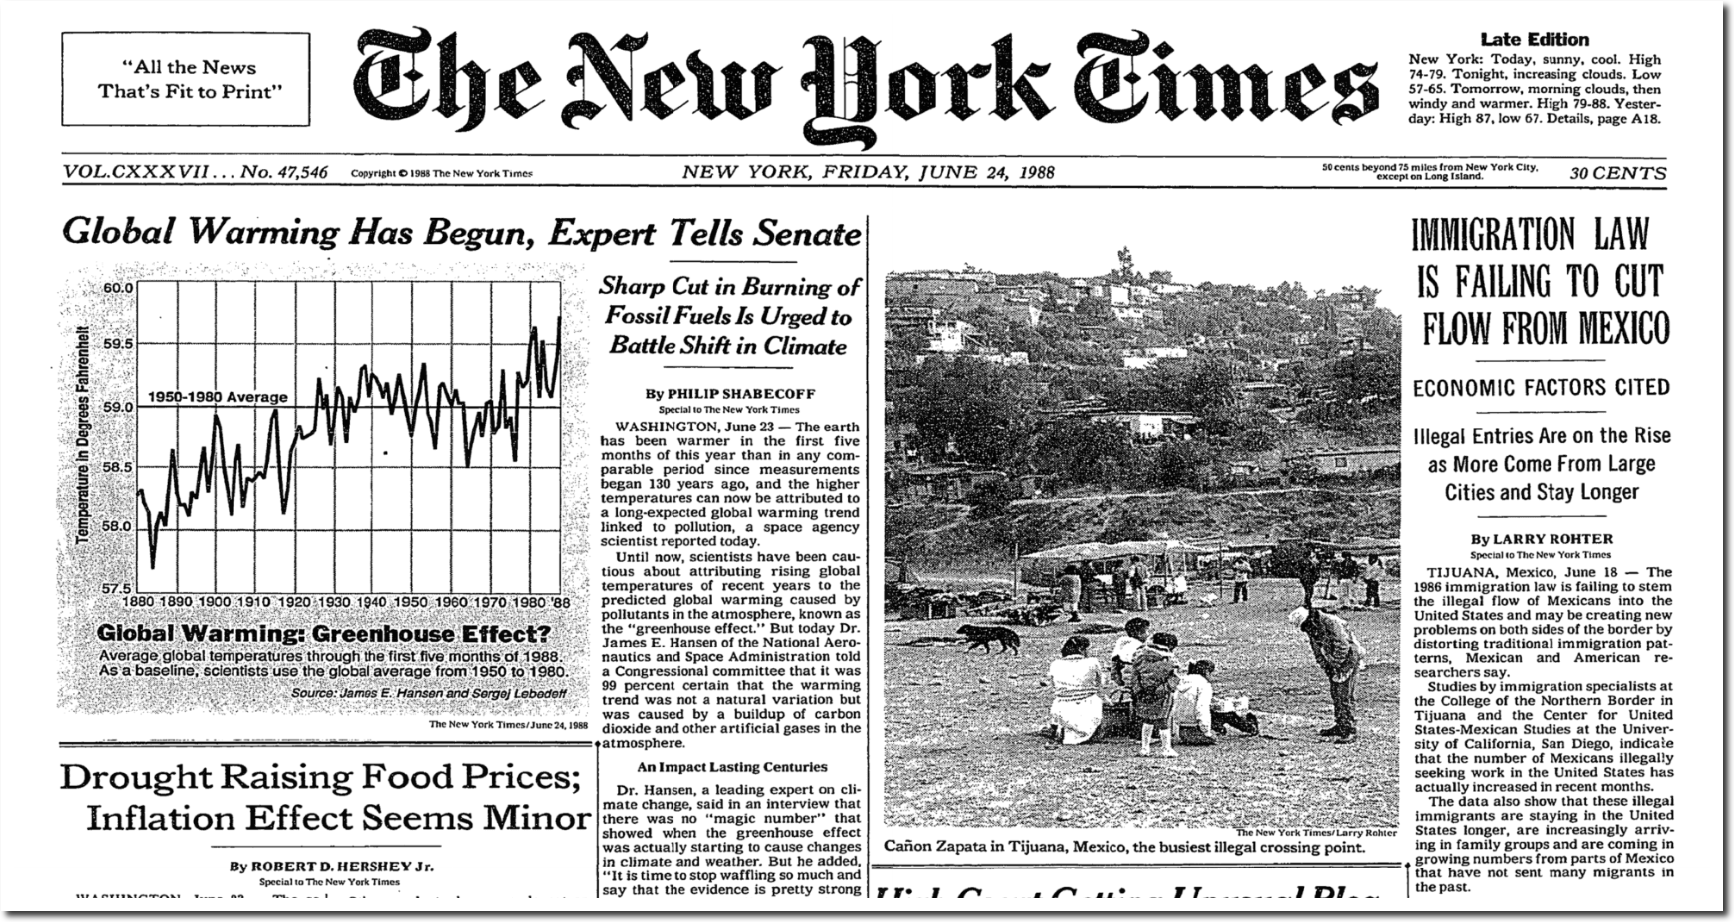
Global Warming Has Begun, Expert Tells Senate – The New York Times
He said Lower Manhattan would be underwater by 2018 and that you wouldn’t be able to get a glass of water in New York restaurants because of the permanent drought.
Stormy weather – Global warming – Salon.com
NOAA issued six different “scenarios” for sea level rise.
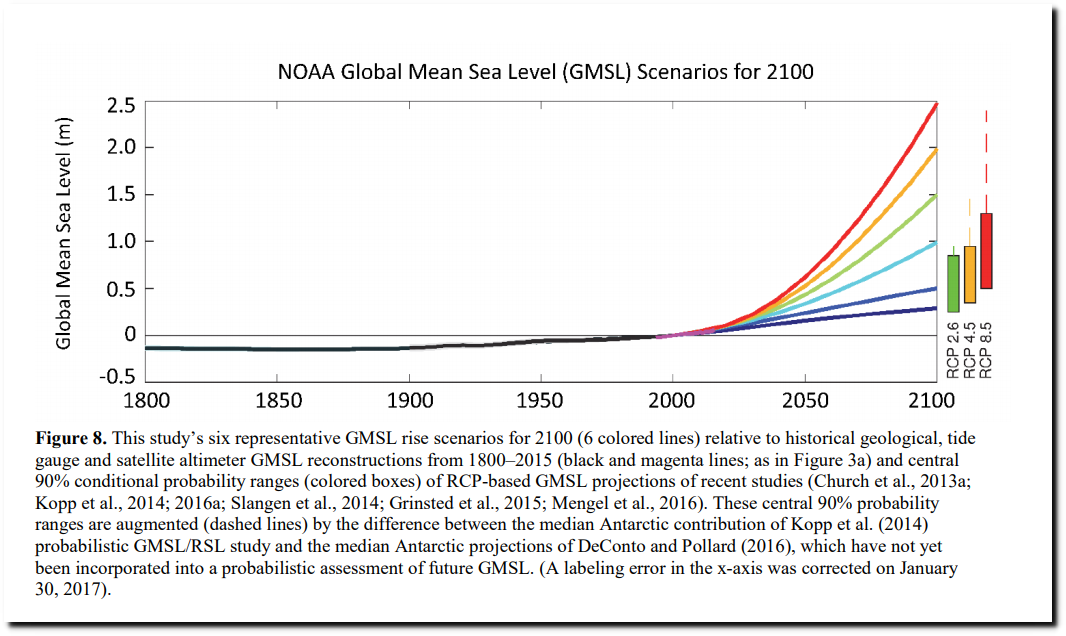
Lower Manhattan is below the “Low Scenario” and sea level is rising there at the same rate it was 150 years ago.

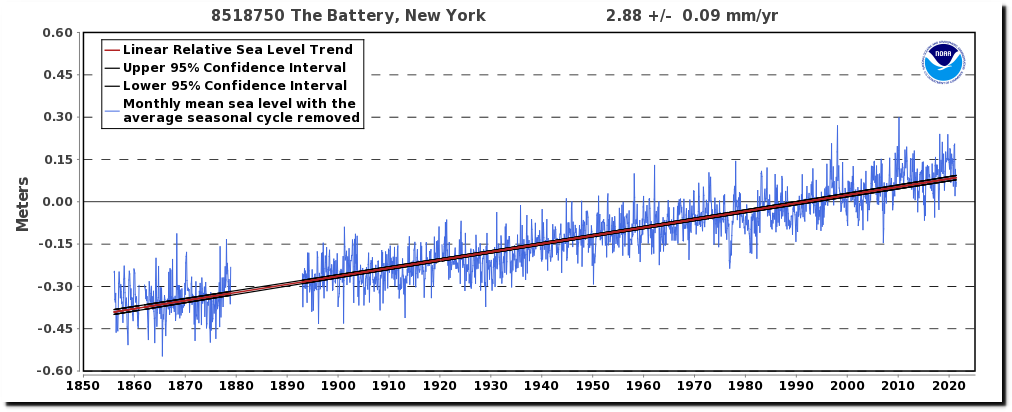
Sea Level Trends – NOAA Tides & Currents
This graph shows the difference between rapid natural sea level rise and imaginary man-made sea level rise.
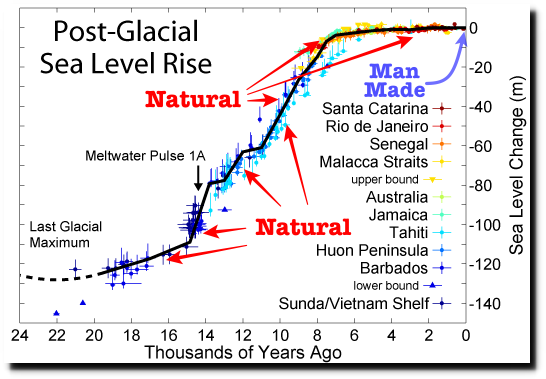
File:Post-Glacial Sea Level.png – Wikimedia Commons
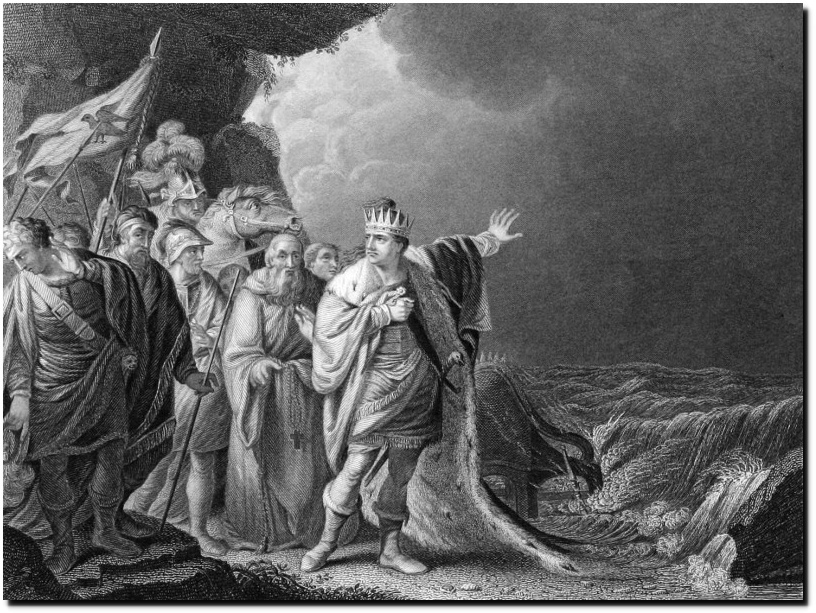
One thousand years ago, King Knut took his subjects to the sea to show them that government doesn’t control sea level. Unfortunately we don’t have politicians that intelligent any more.
Hansen was correct about one thing however. You can’t get a glass of water in a Manhattan restaurant any more.

N.Y.C. to Require Proof of At Least 1 Dose for Indoor Dining – The New York Times
Posted in Uncategorized
Leave a comment
The Safe Climate Of 1974
At the peak of the global cooling scare in 1974, Australian fires burned eleven times as much acreage as this year’s fires.
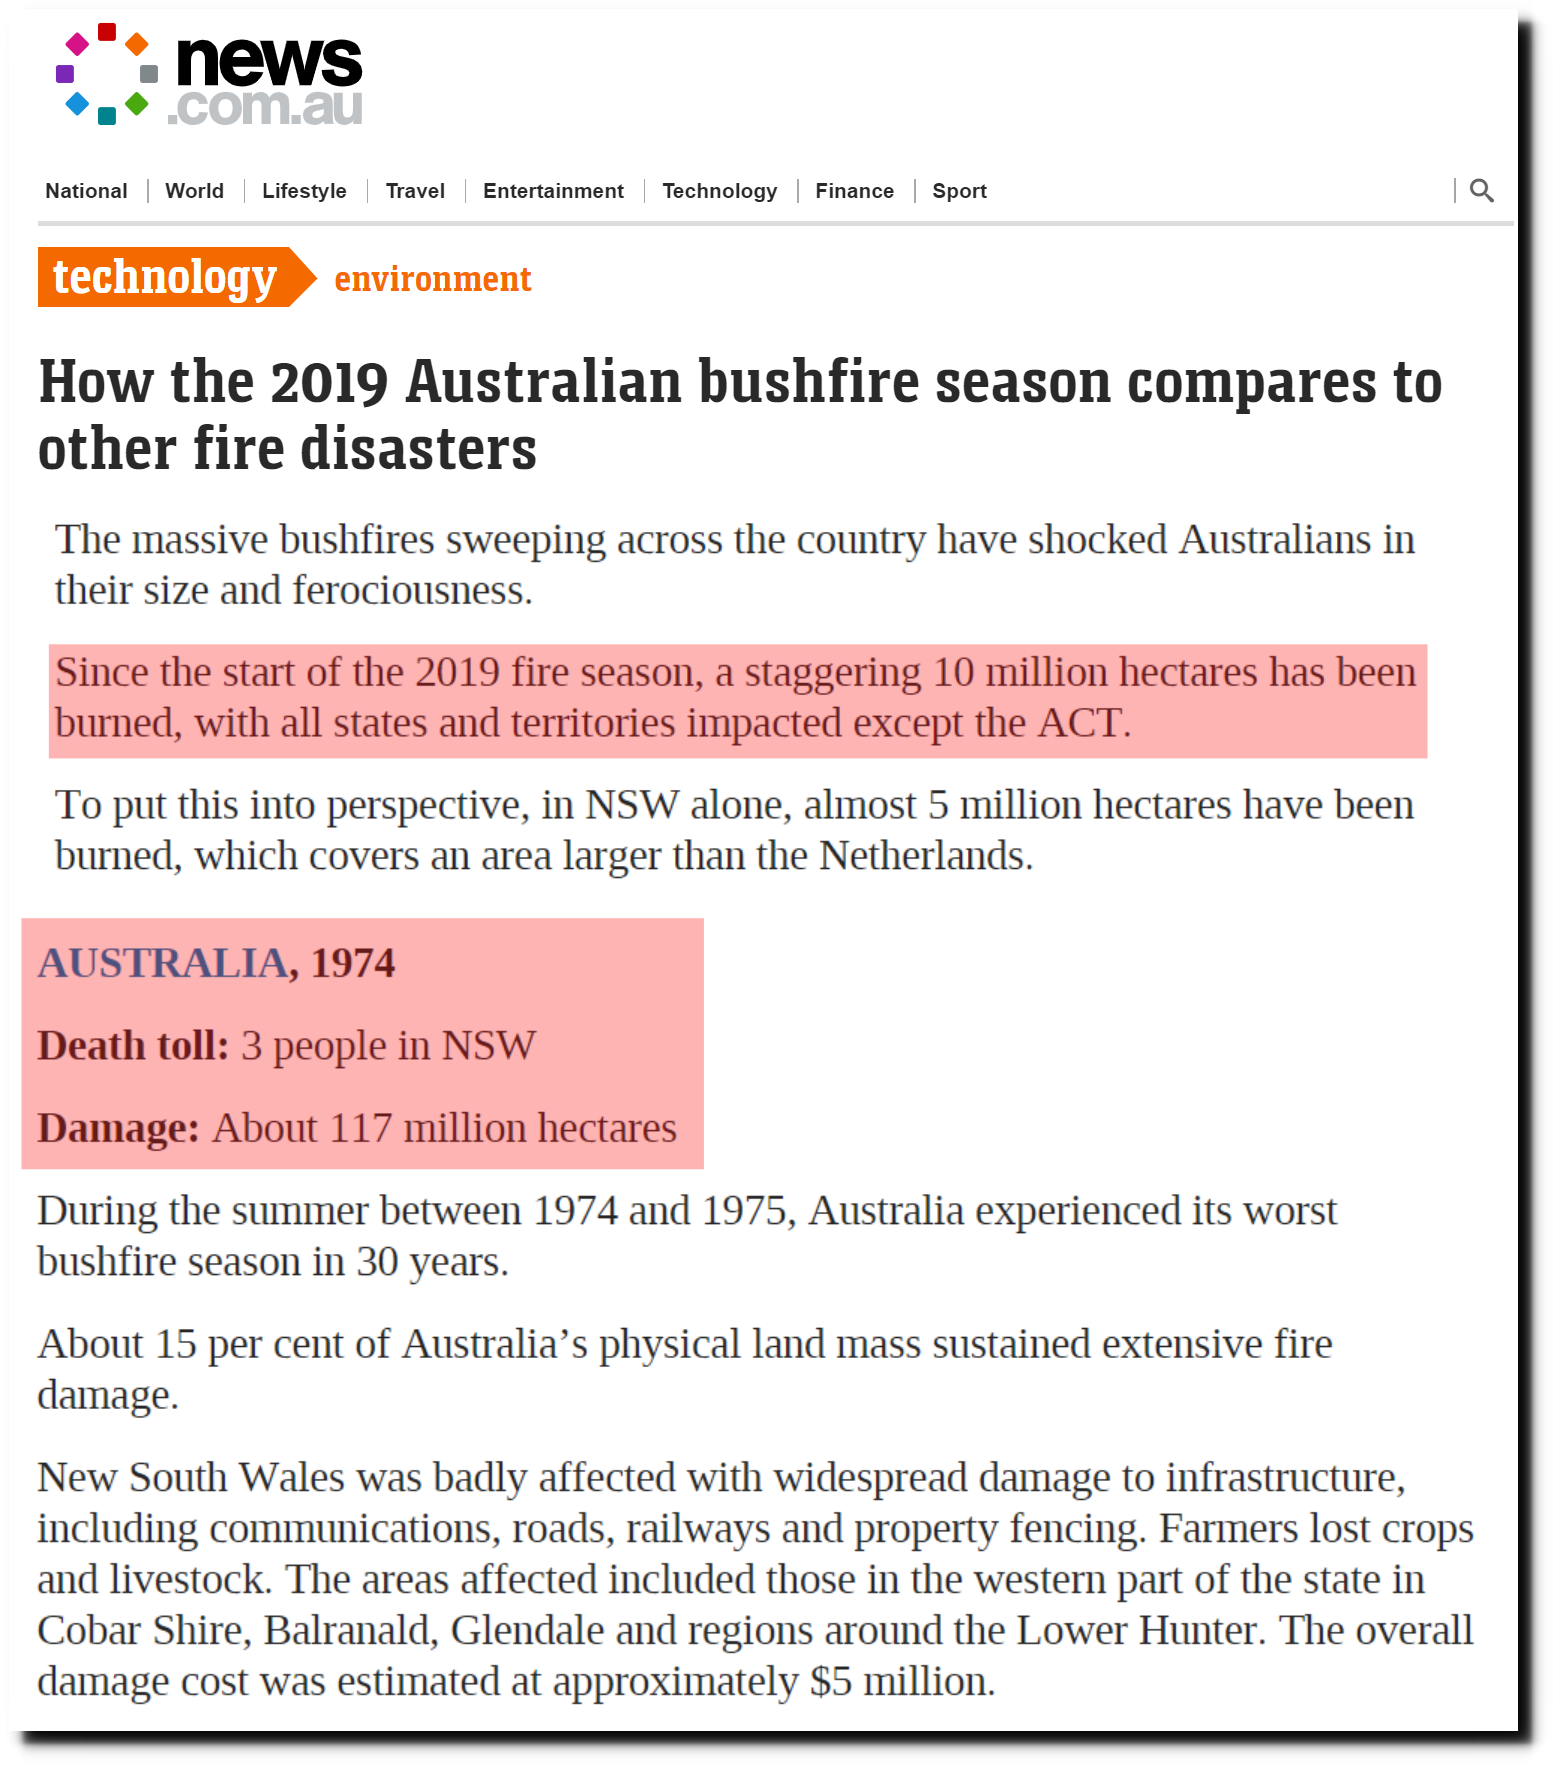
Australian bushfires: Why 2019 fire season is different from others
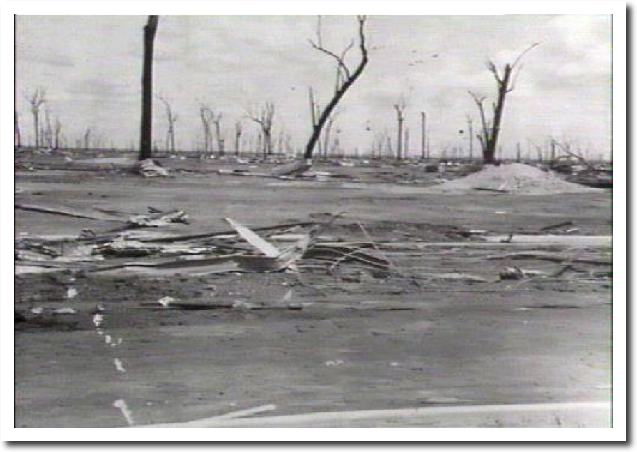
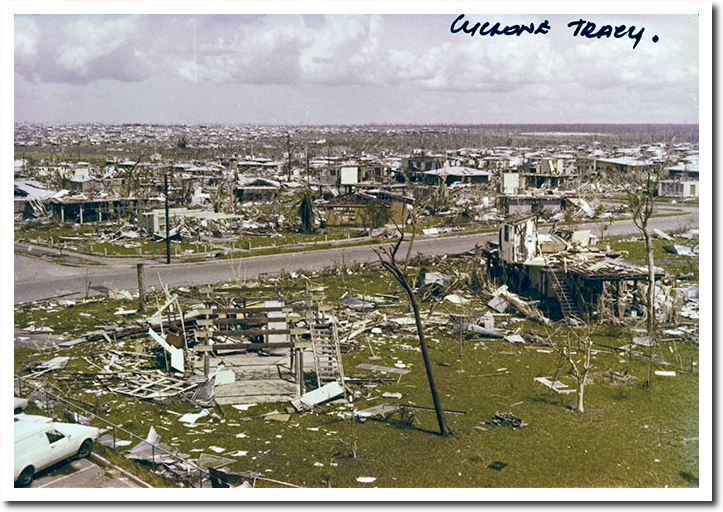
Darwin was destroyed by Cyclone Tracy that year.
Northeast Australia turned into an inland sea due to record rainfall and flooding.
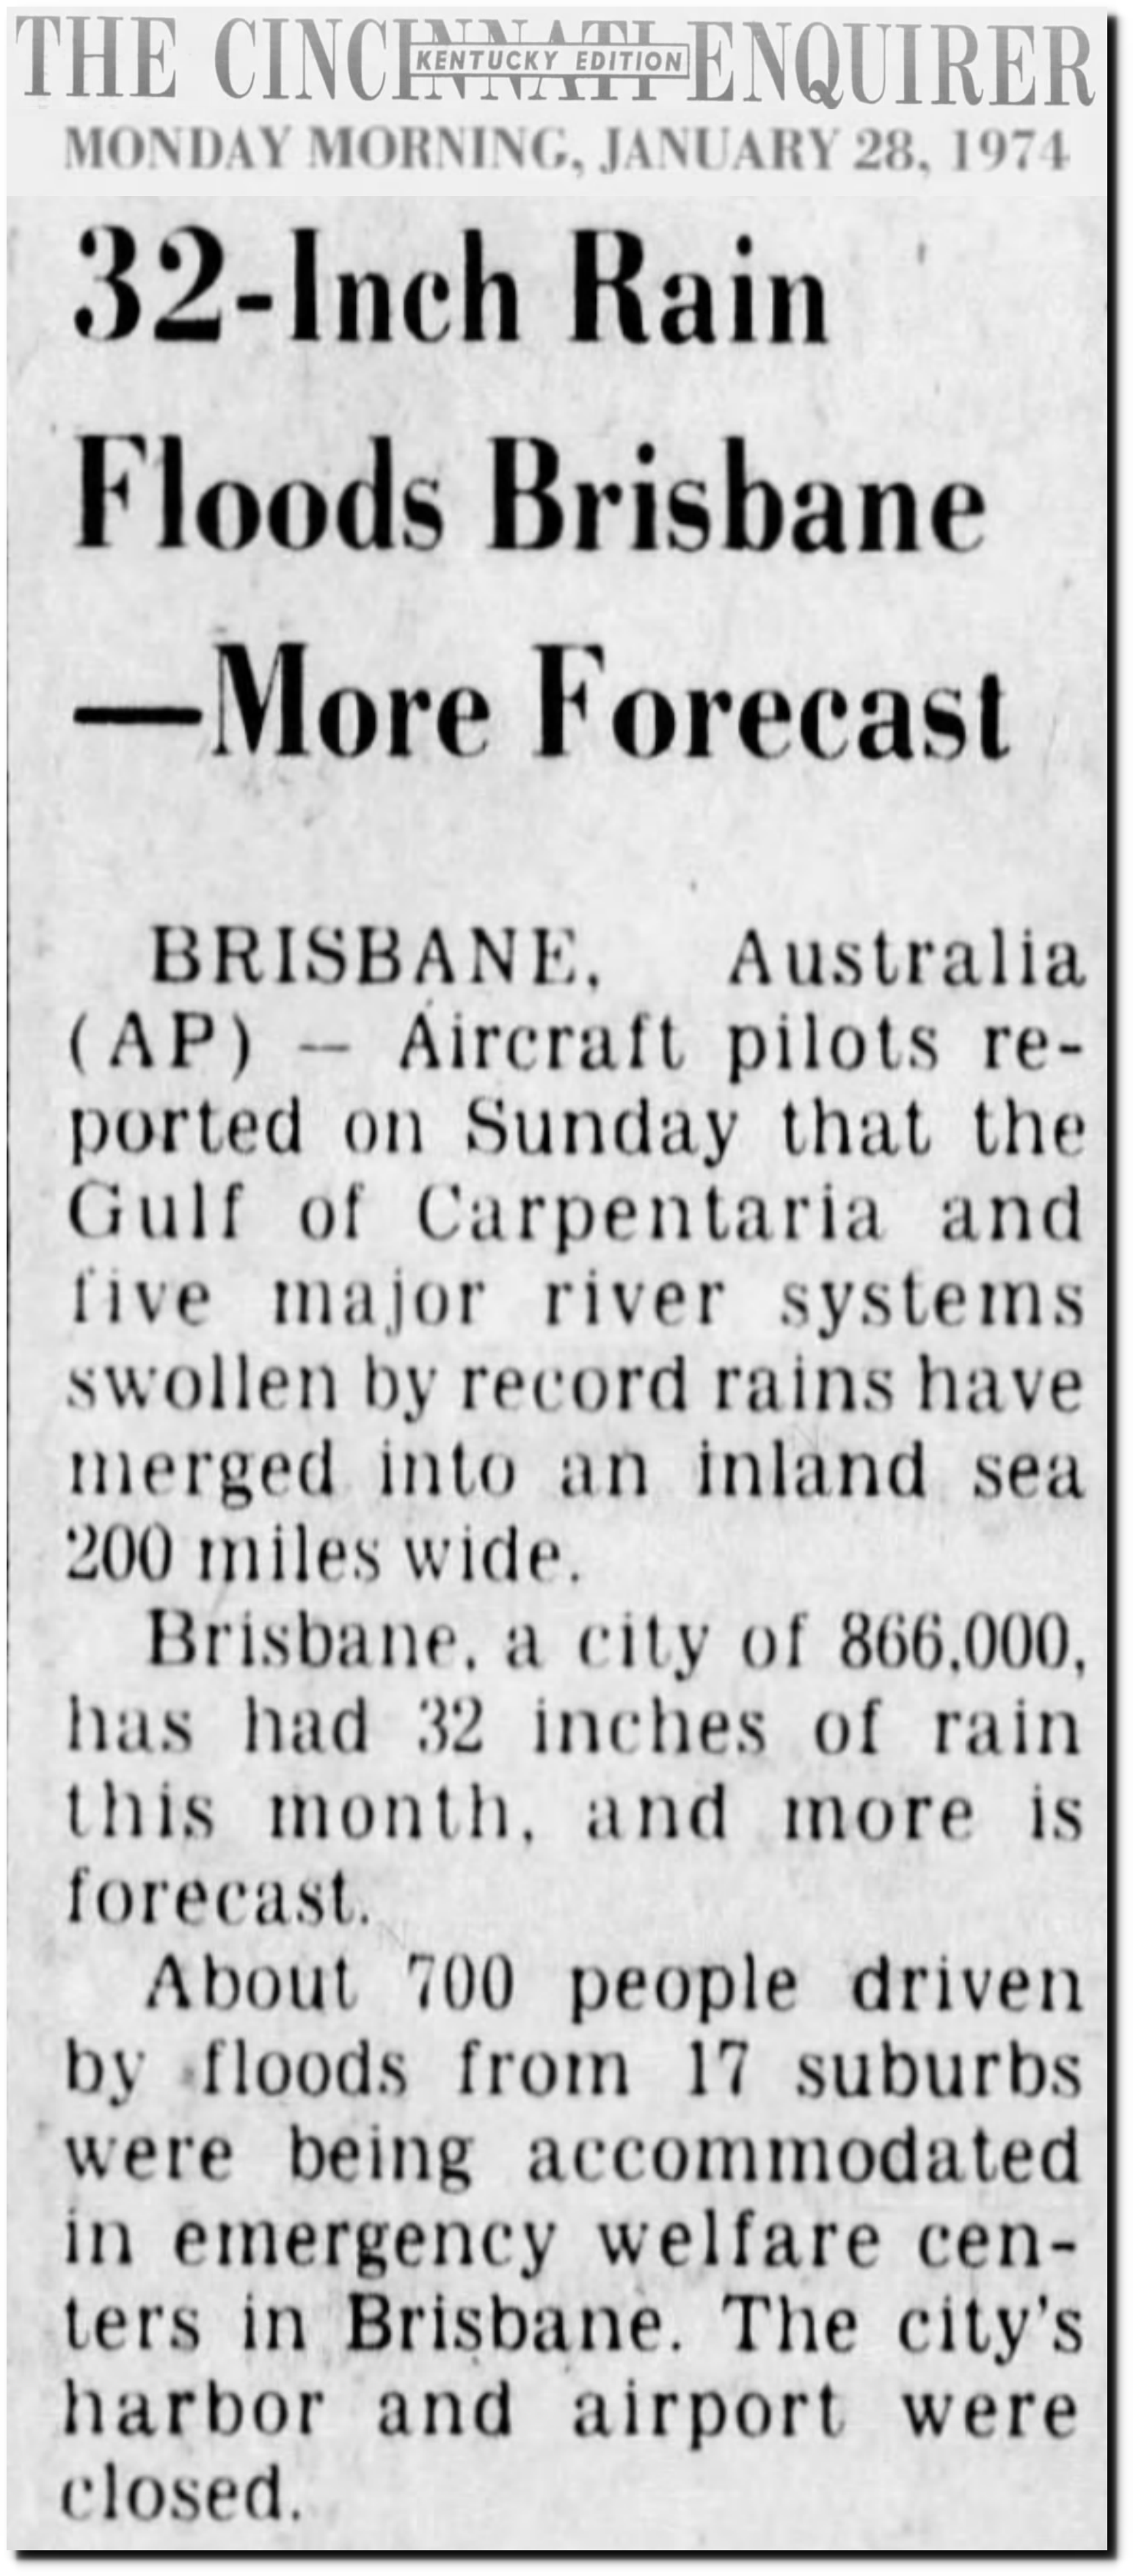
28 Jan 1974, Page 12 – The Cincinnati Enquirer at Newspapers.com
The US had its worst tornado outbreak on record.
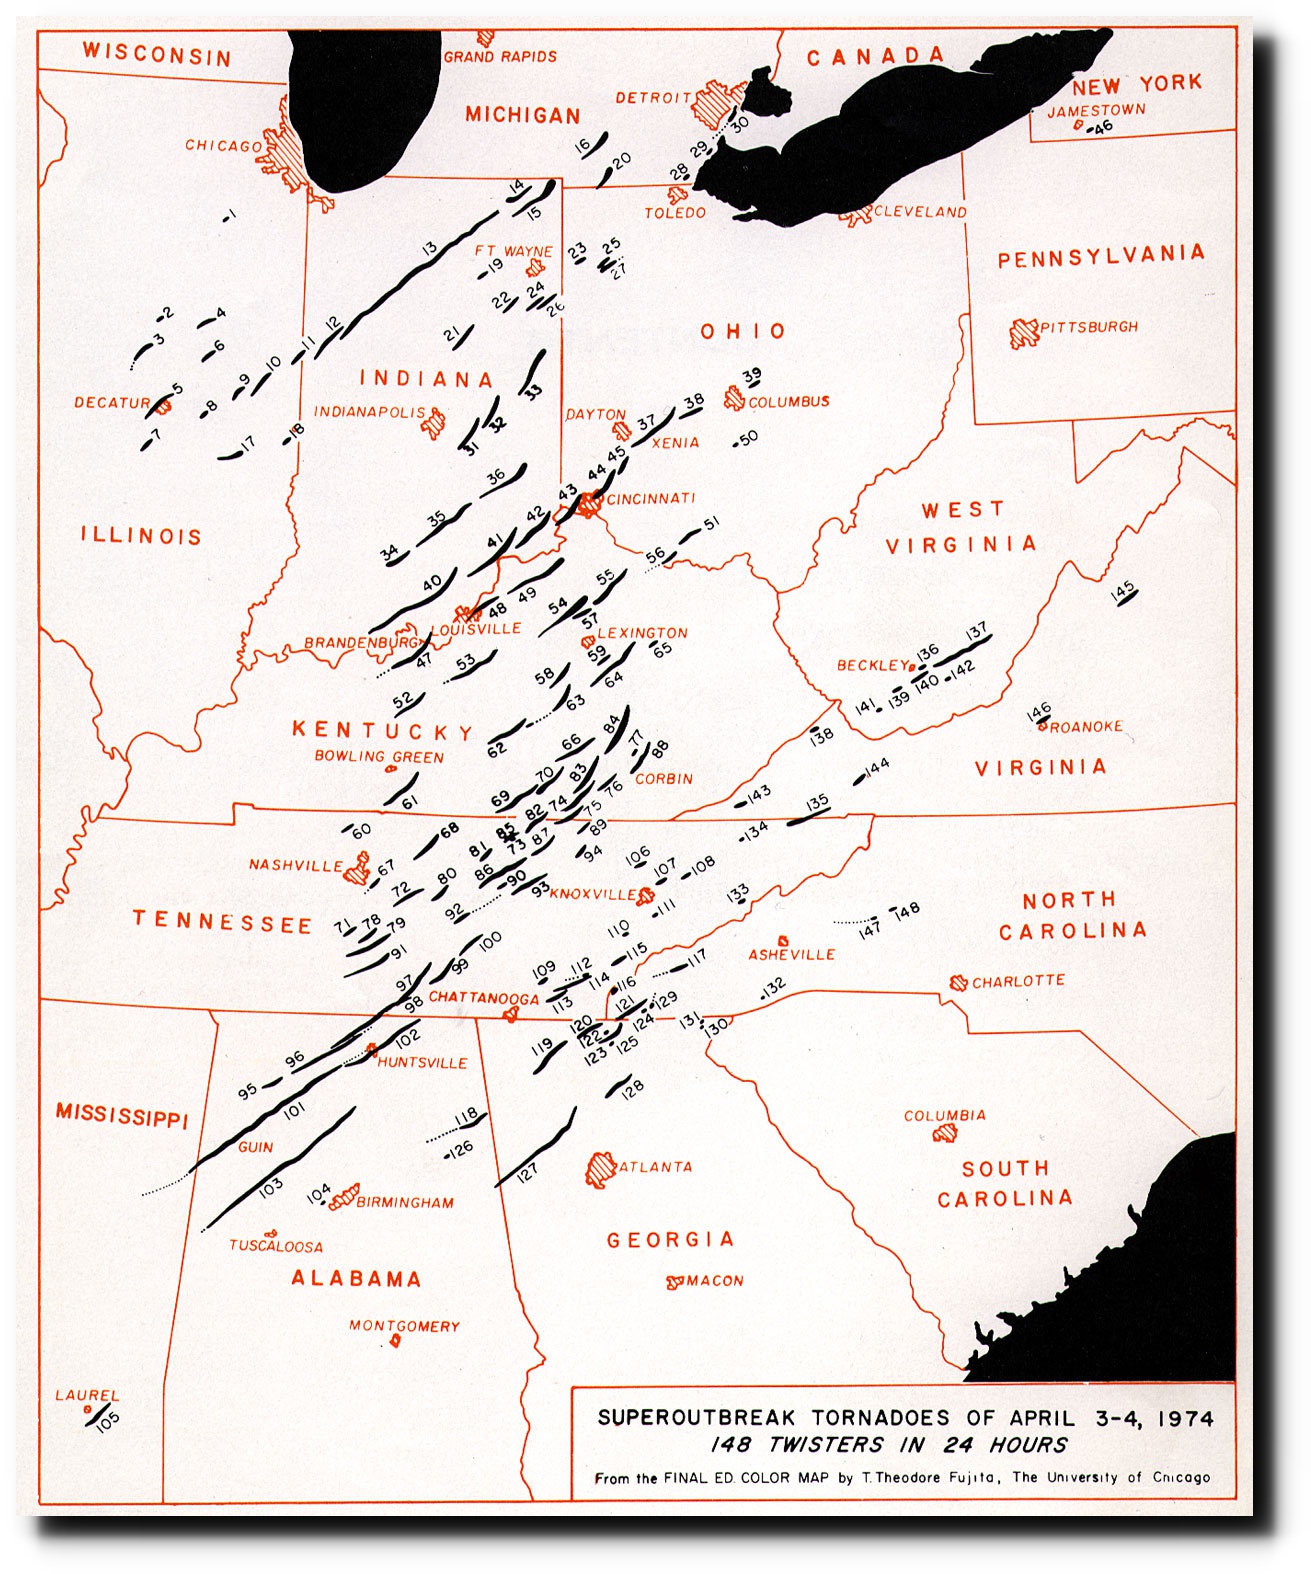
List of tornadoes in the 1974 Super Outbreak – Wikipedia
Phoenix had their worst heatwave.
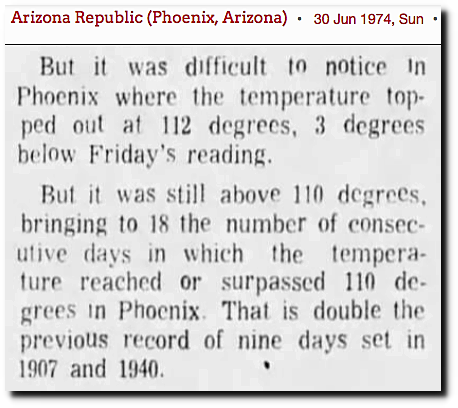
30 Jun 1974, Page 31 – Arizona Republic at Newspapers.com
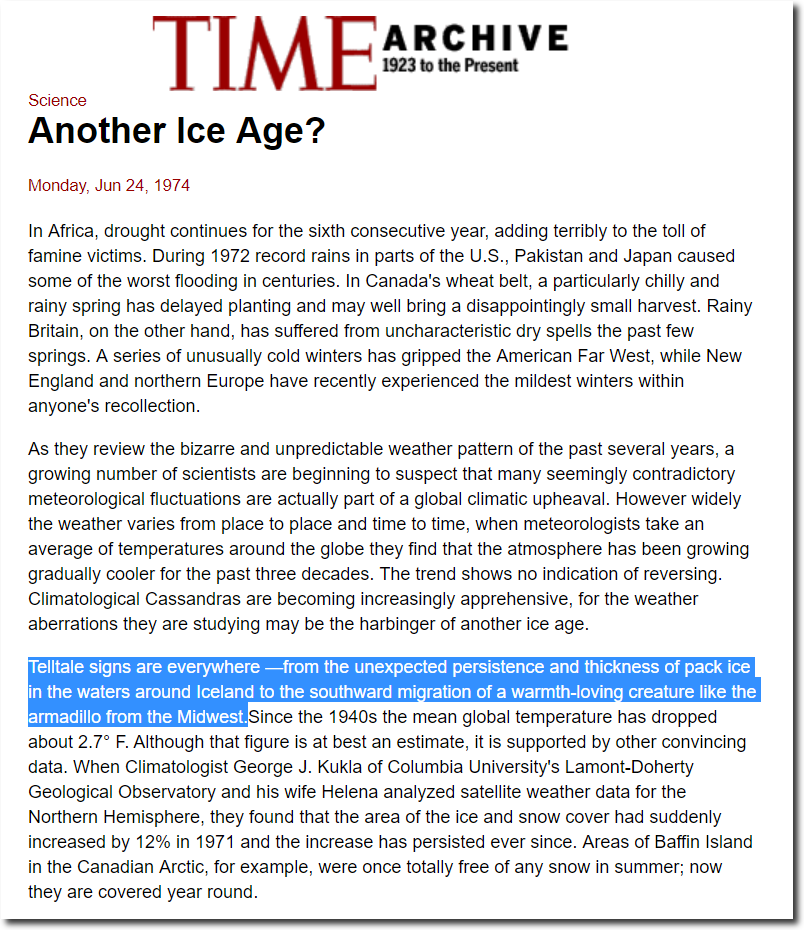
TIME Magazine Archive Article — Another Ice Age? — Jun. 24, 1974
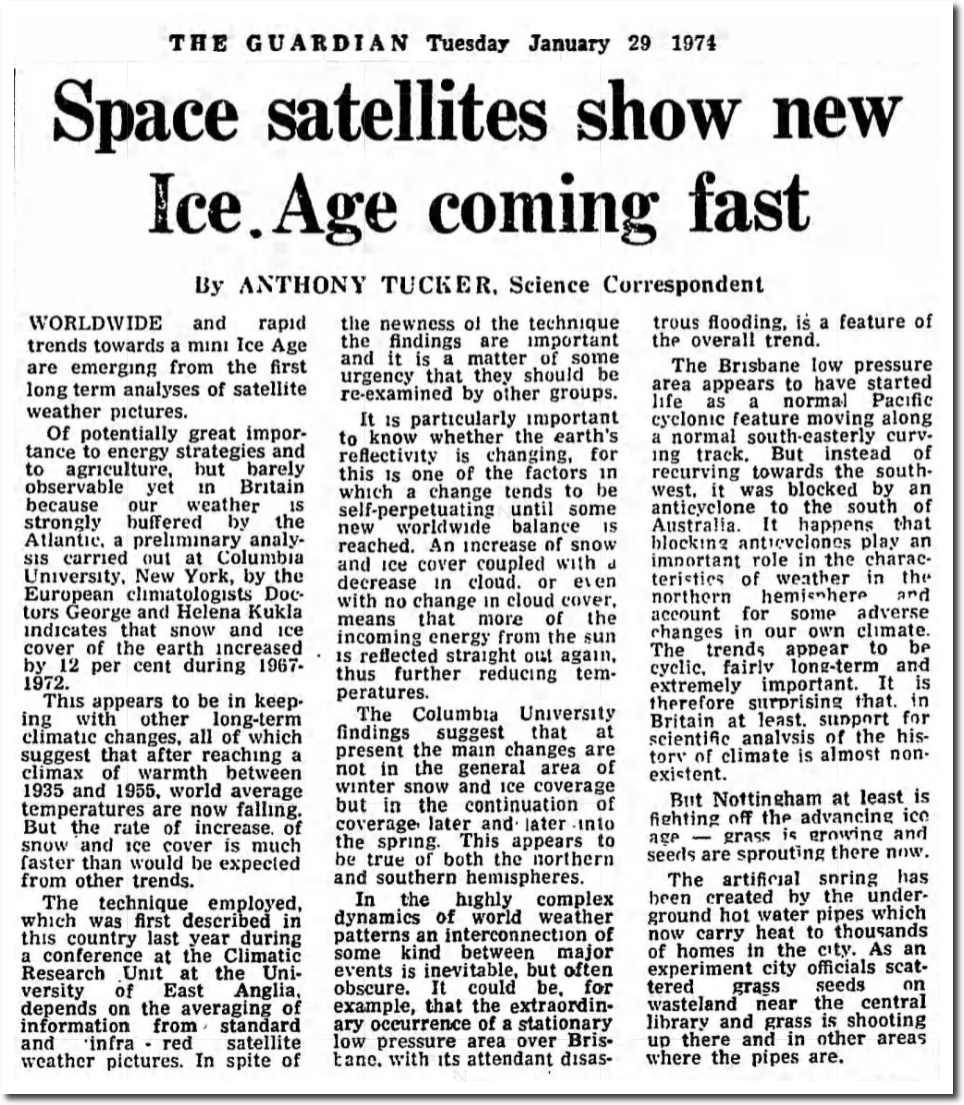
29 Jan 1974, 5 – The Guardian at Newspapers.com
The fourth deadliest Atlantic Hurricane occurred in 1974.
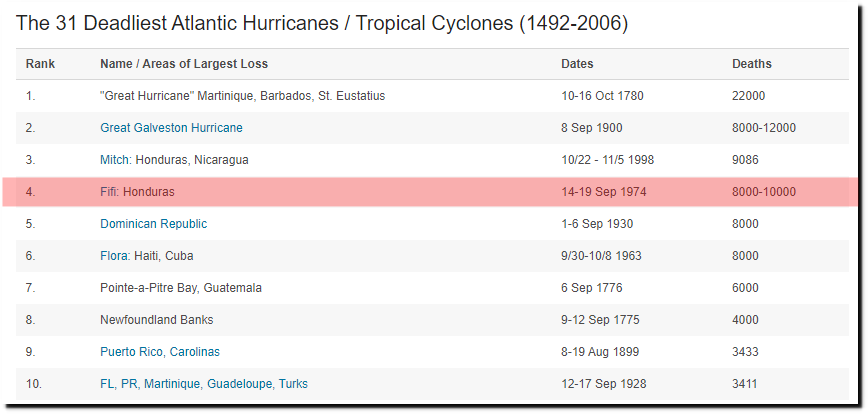
Deadliest Atlantic Hurricanes | Weather Underground
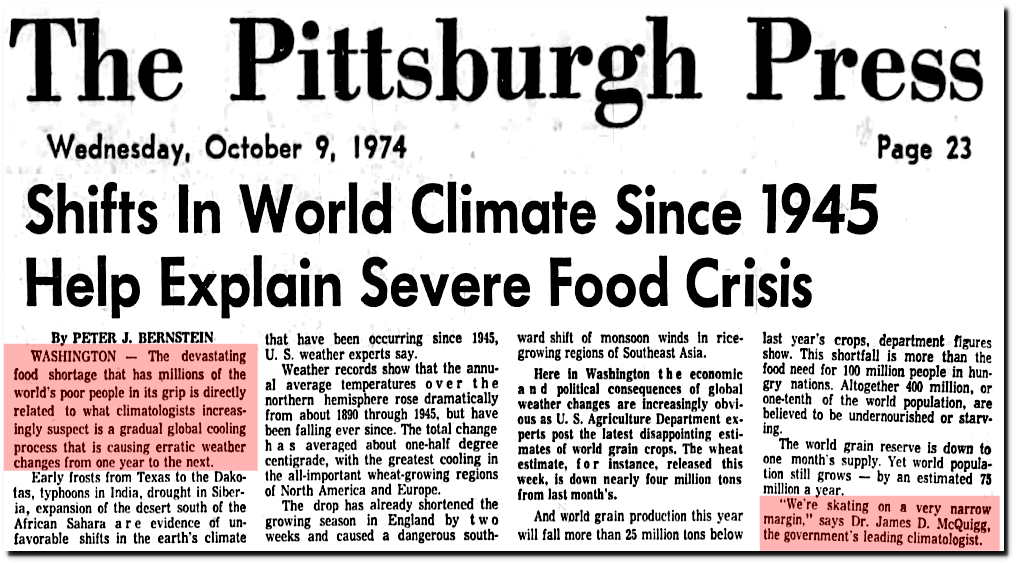
9 Oct 1974, Page 25 – The Pittsburgh Press at Newspapers.com
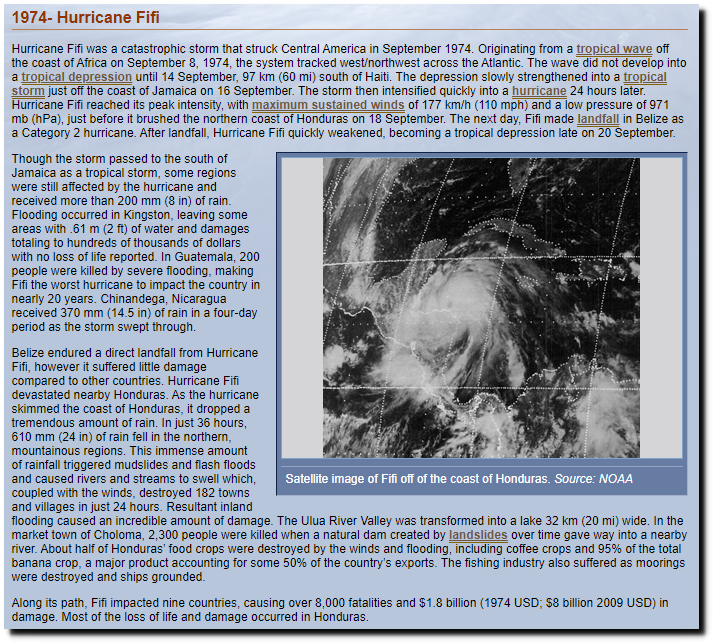
Hurricanes: Science and Society: 1974- Hurricane Fifi

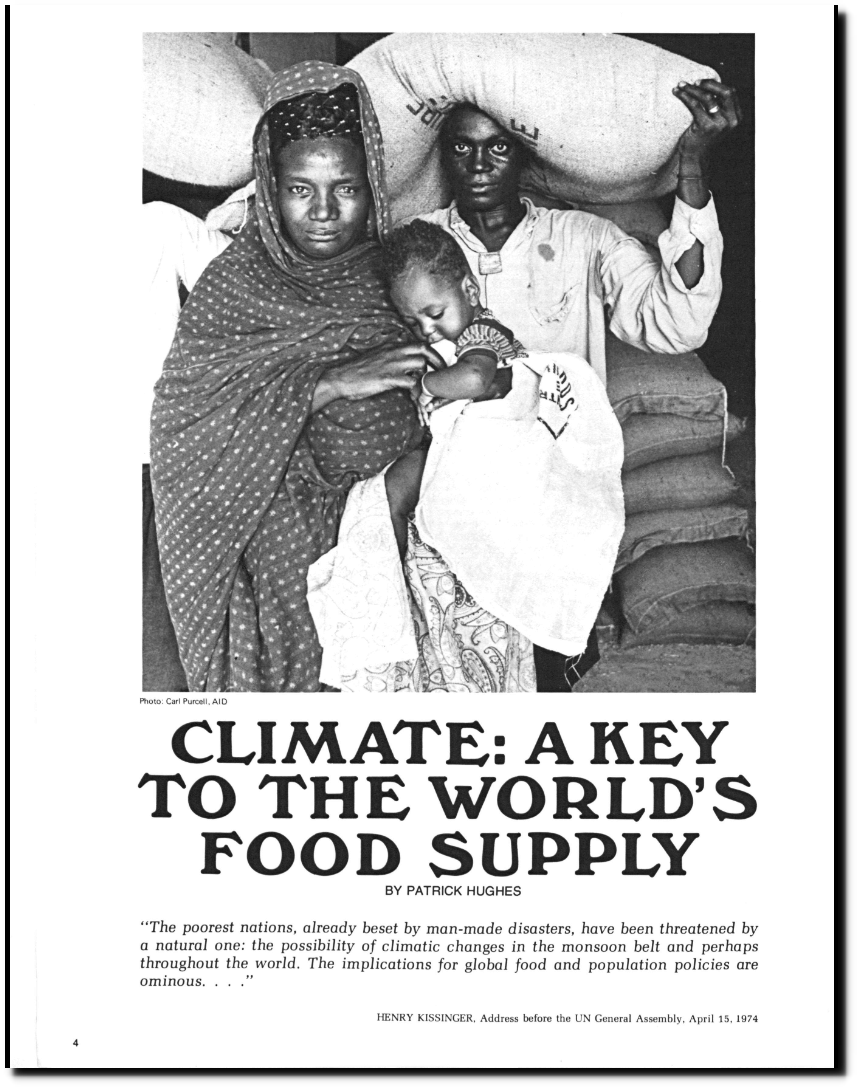
Bangladesh famine of 1974 – Wikipedia
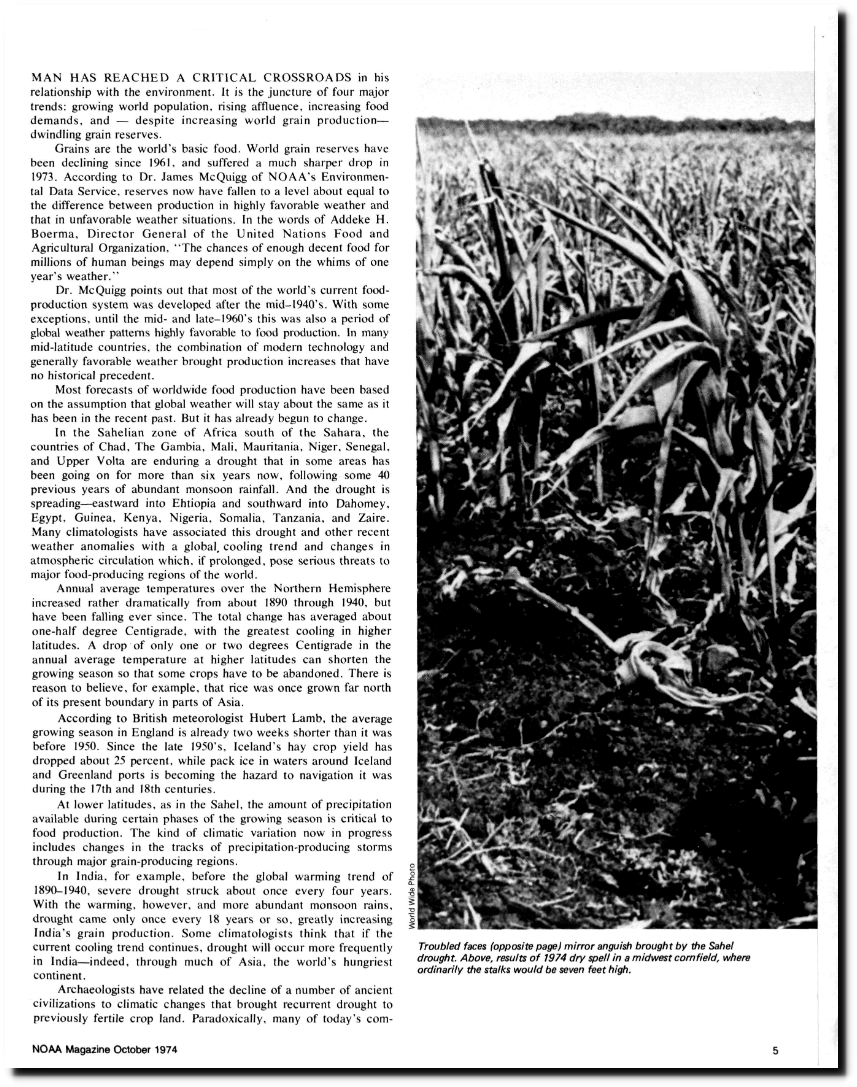
Most forecasts of worldwide food production have been based on the assumption that global weather will stay “Many climatologists have associated this drought and other recent weather anomalies with a global cooling trend and changes in atmospheric circulation which, if prolonged, pose serious threats to major food-producing regions of the world”
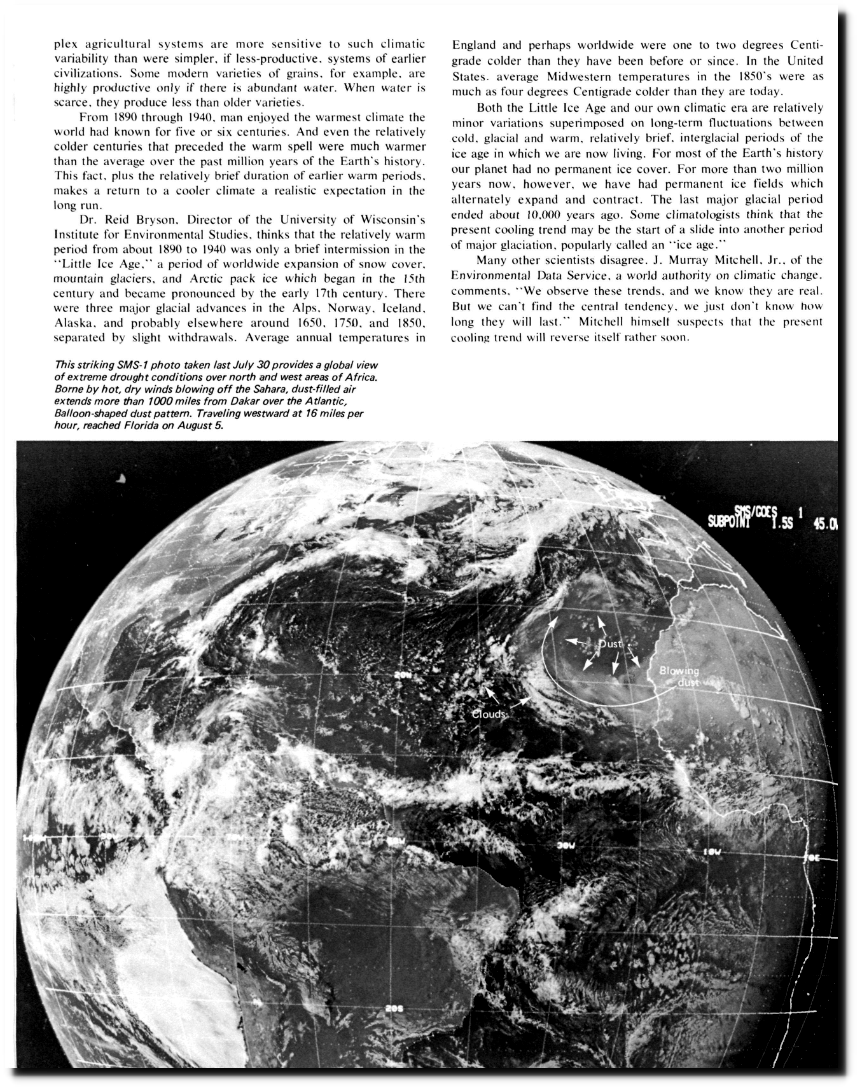
“In India, for example, before the global warming trend of 1890-1940. severe drought struck about once every four years. With the warming, however, and more abundant monsoon rains, drought came only once every 18 years or so, greatly increasing India’s grain production.””Annual average temperatures over the Northern Hemisphere increased rather dramatically from about 1890 through 1940, but have been falling ever since. The total change has averaged about one-half degree Centigrade”
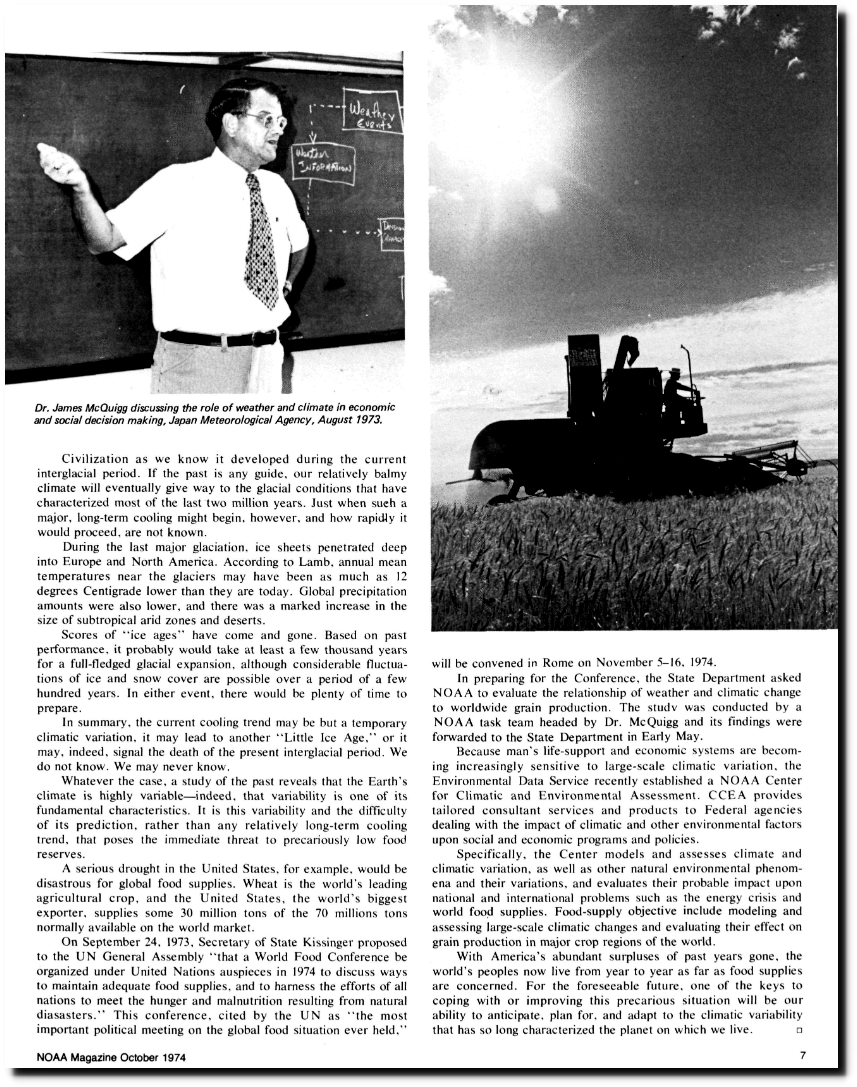
“a study of the past reveals that the Earth’s climate is highly variable—indeed, that variability is one of its fundamental characteristics”

ftp://ftp.library.noaa.gov/docs.lib/htdocs/rescue/journals/noaa/QC851U461974oct.pdf
Britain’s longest and most severe droughts occurred from 1971 to 1976.
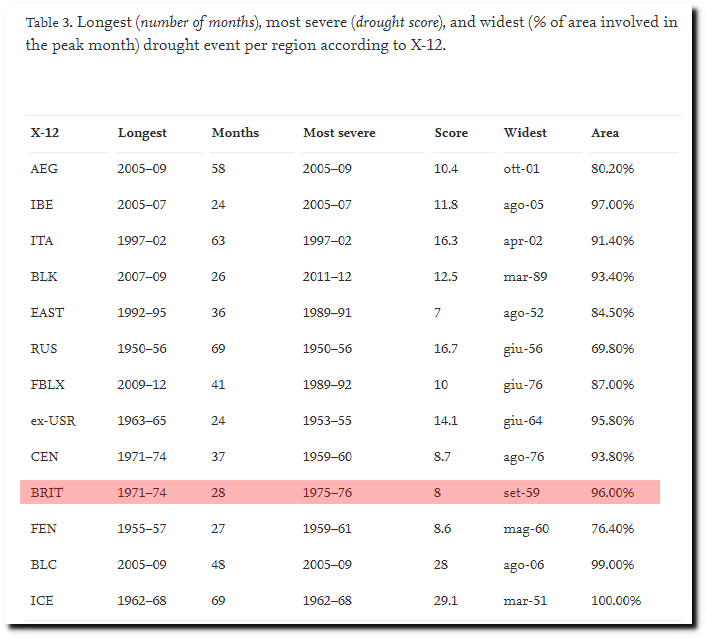
The biggest drought events in Europe from 1950 to 2012 – ScienceDirect
Posted in Uncategorized
Leave a comment
Removing The 1940s Blip
In 1974, government land temperature graphs showed no warming over a century and that the 1920s through the 1950s were very warm.
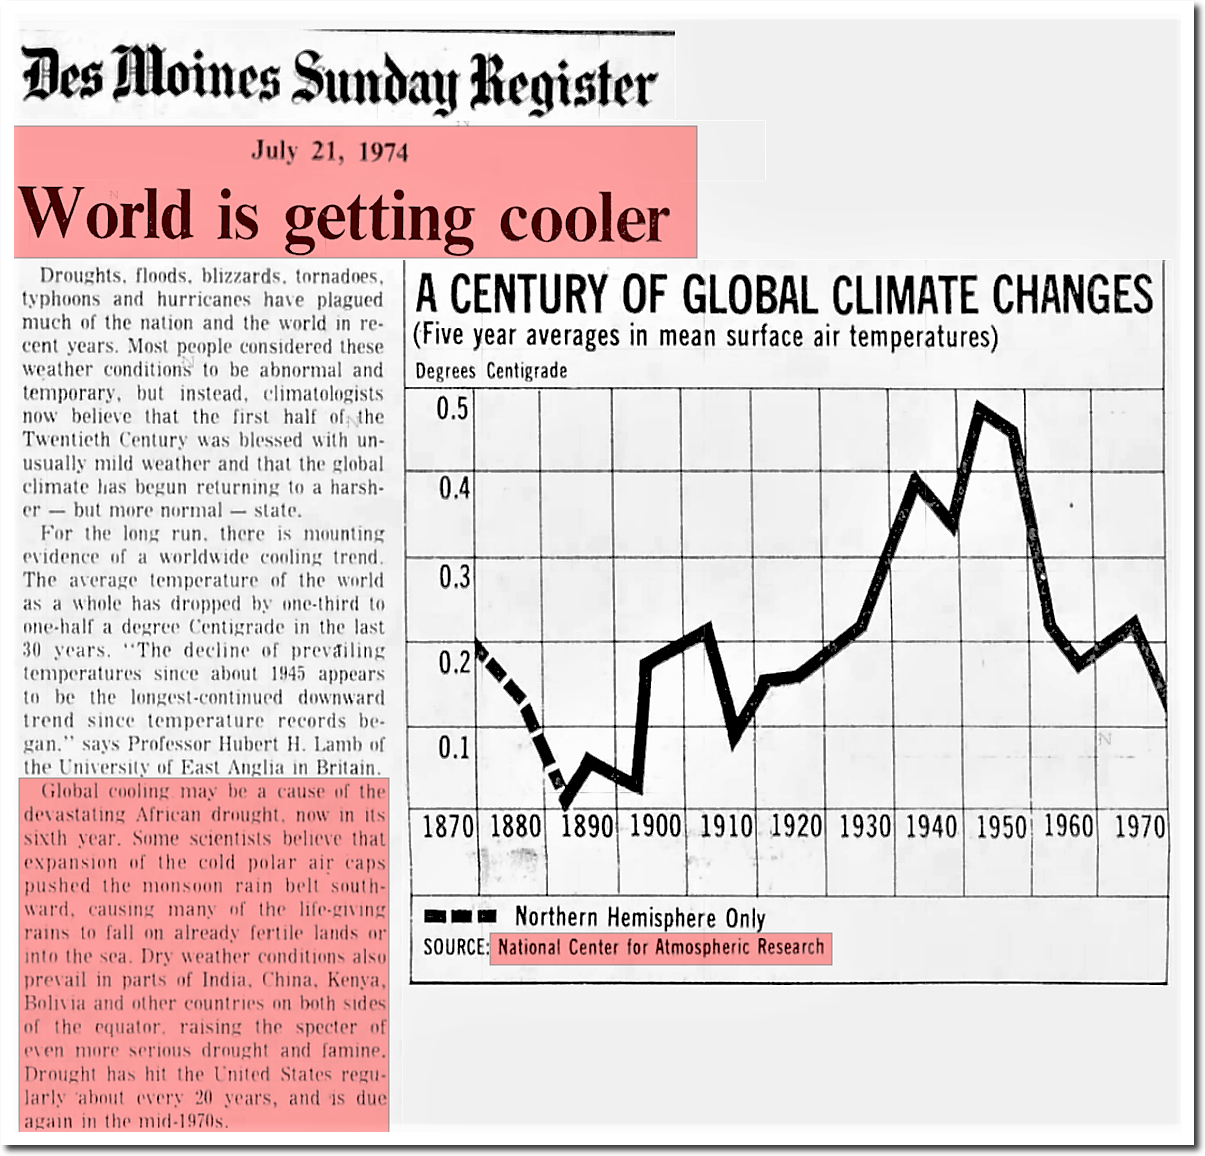
21 Jul 1974, 13 – The Des Moines Register at Newspapers.com
NOAA’s Tom Karl confirmed this in 1989.
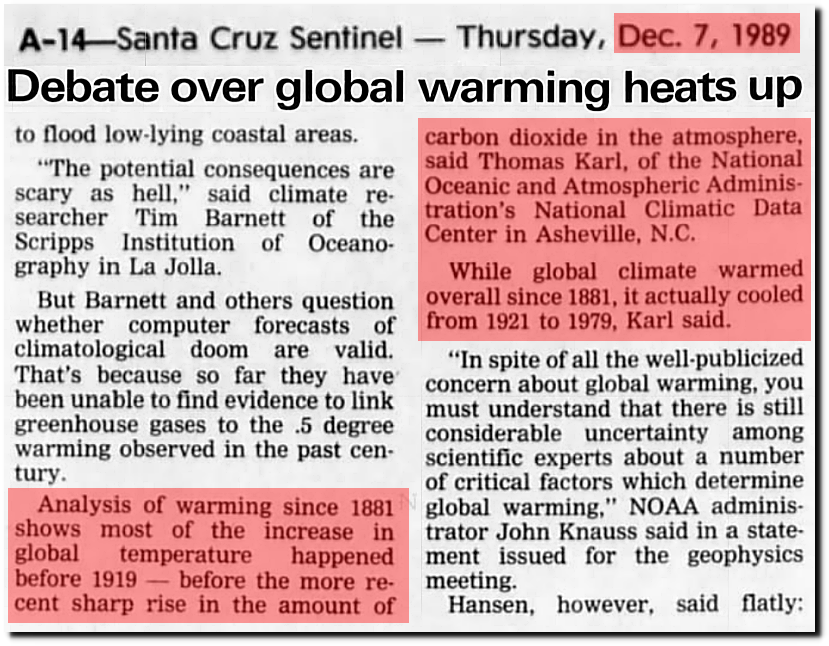
07 Dec 1989, Page 14 – Santa Cruz Sentinel at Newspapers.com
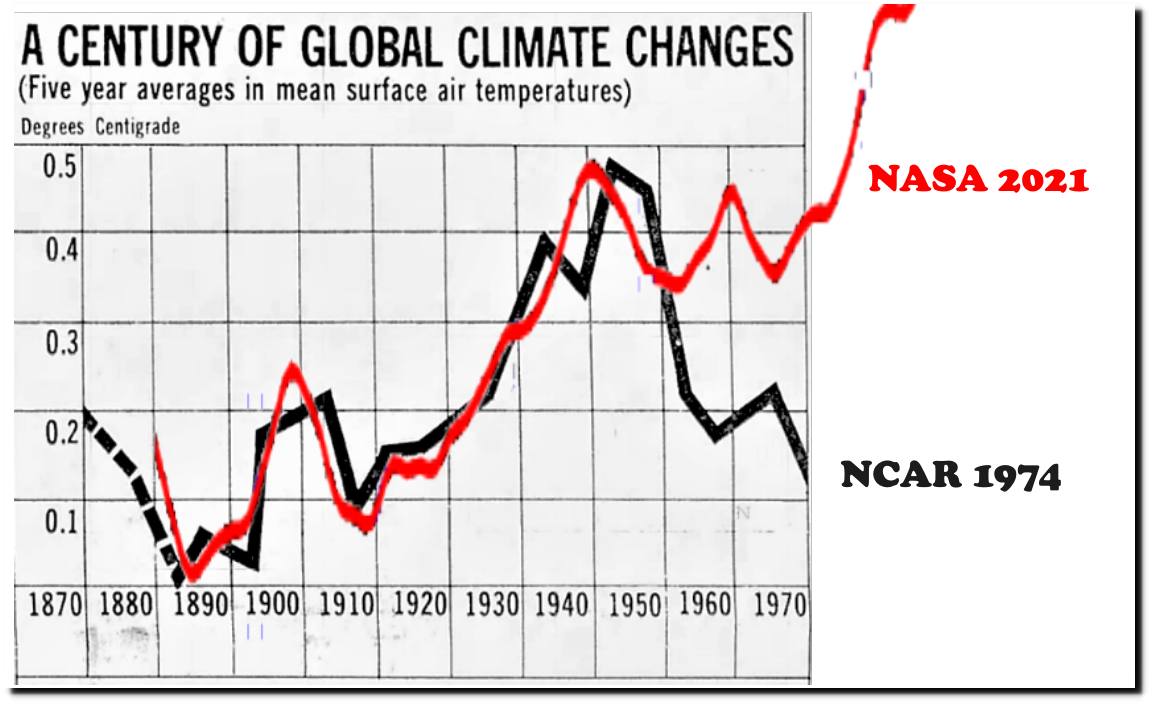
But the world’s leading climate scientists agreed that the past had to change. And that is exactly what they did.

NASA’s land temperatures have completely erased the 1940s warmth. 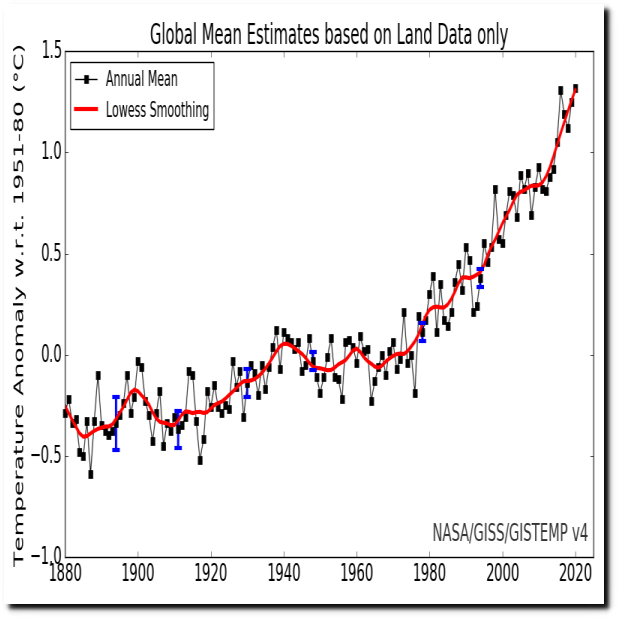
Posted in Uncategorized
Leave a comment