NOAA says they know what the climate will be like in 100 years, but can’t predict it two weeks into the future.
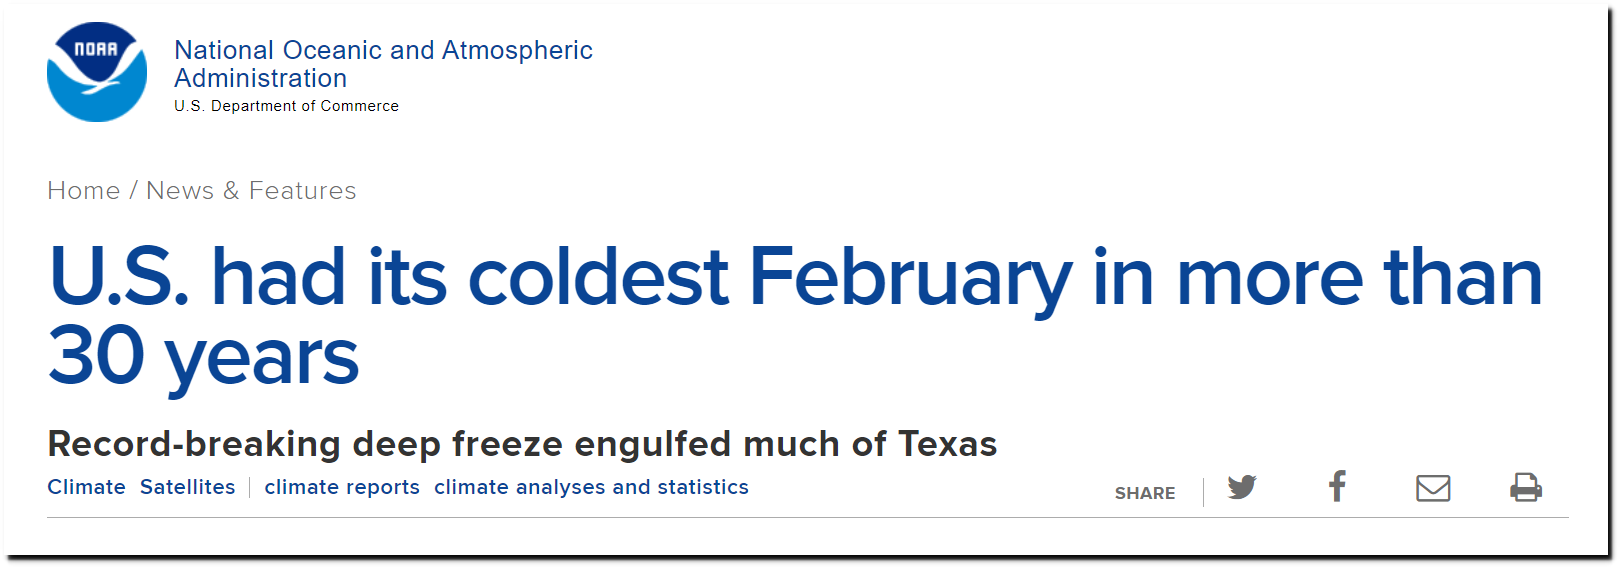
They predicted a warm February, and it was the coldest in more than 30 years.
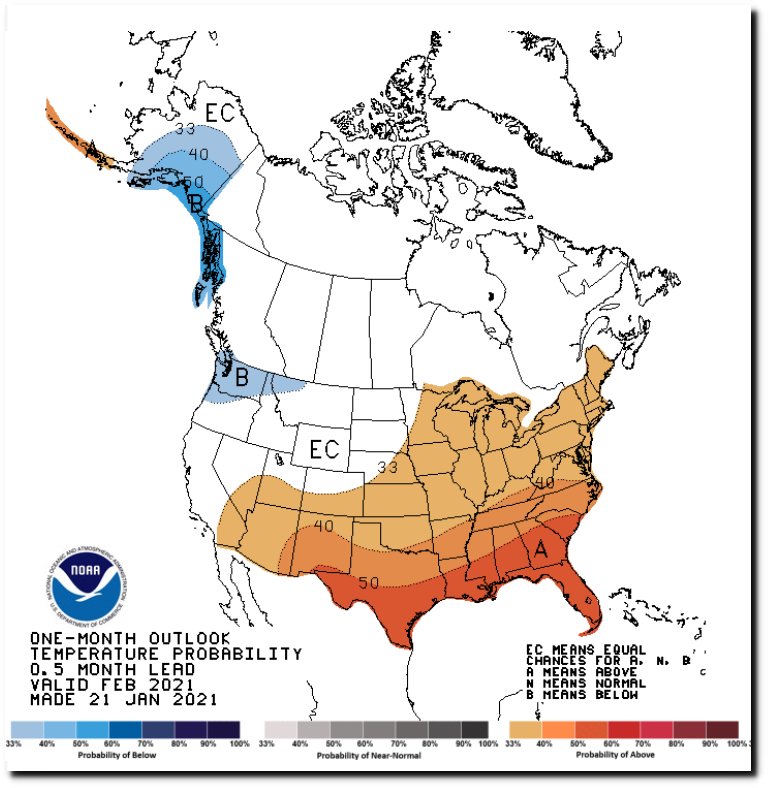
Climate Prediction Center – OFFICIAL 30-Day Forecasts
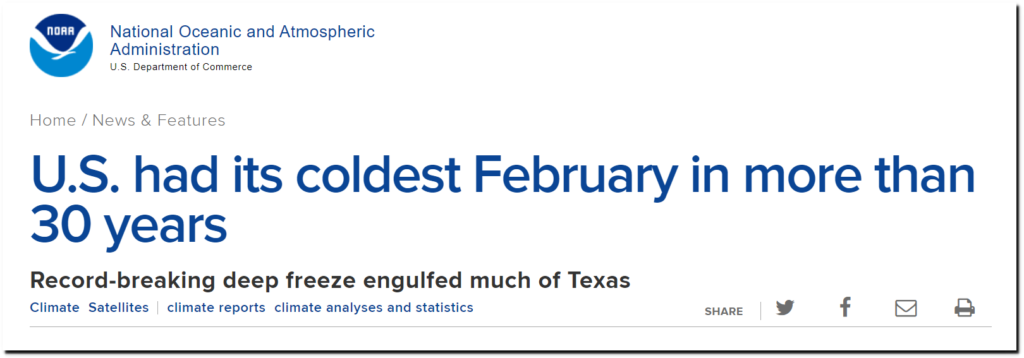
U.S. had its coldest February in more than 30 years | National Oceanic and Atmospheric Administration
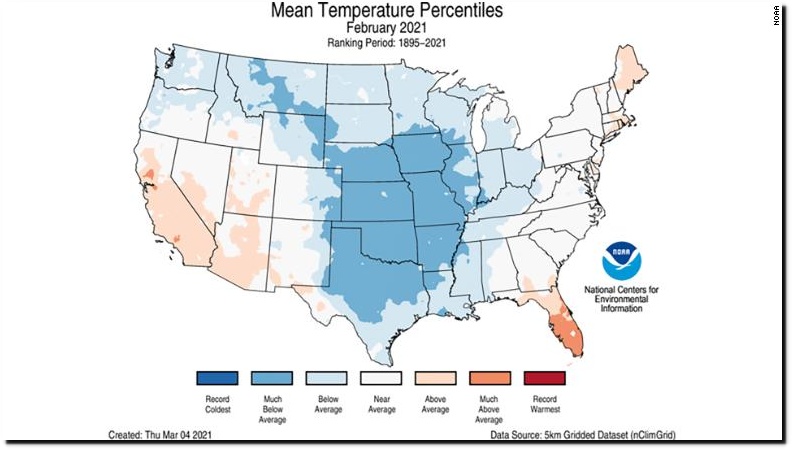
February 2021 was the coldest February on record since 1989 – CNN
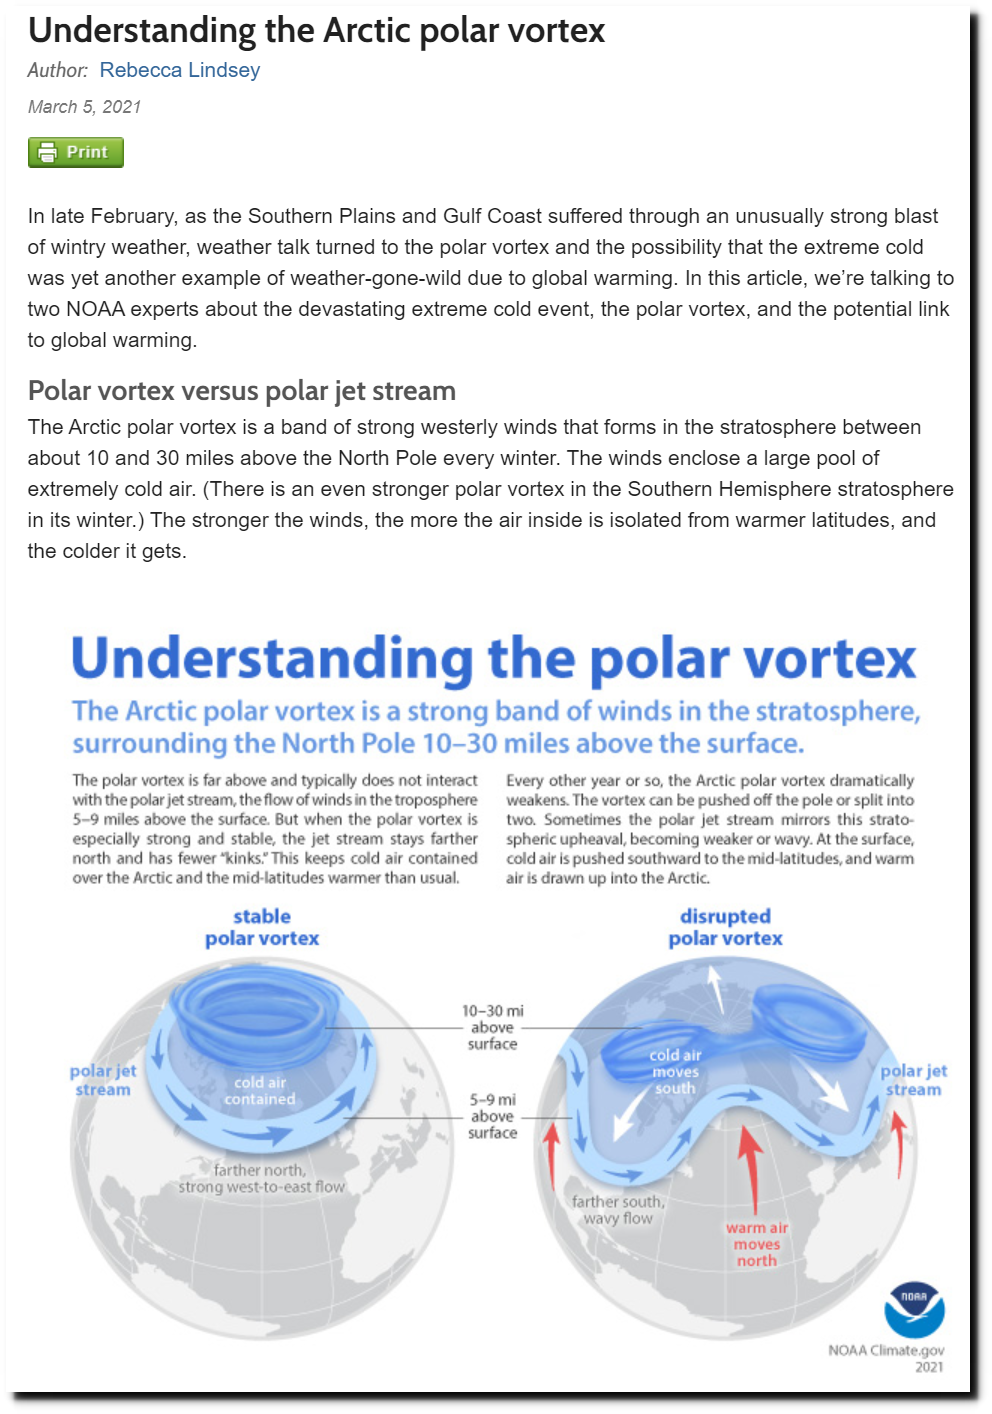
After their forecast failed, they blamed it on a disrupted polar vortex caused by global warming.
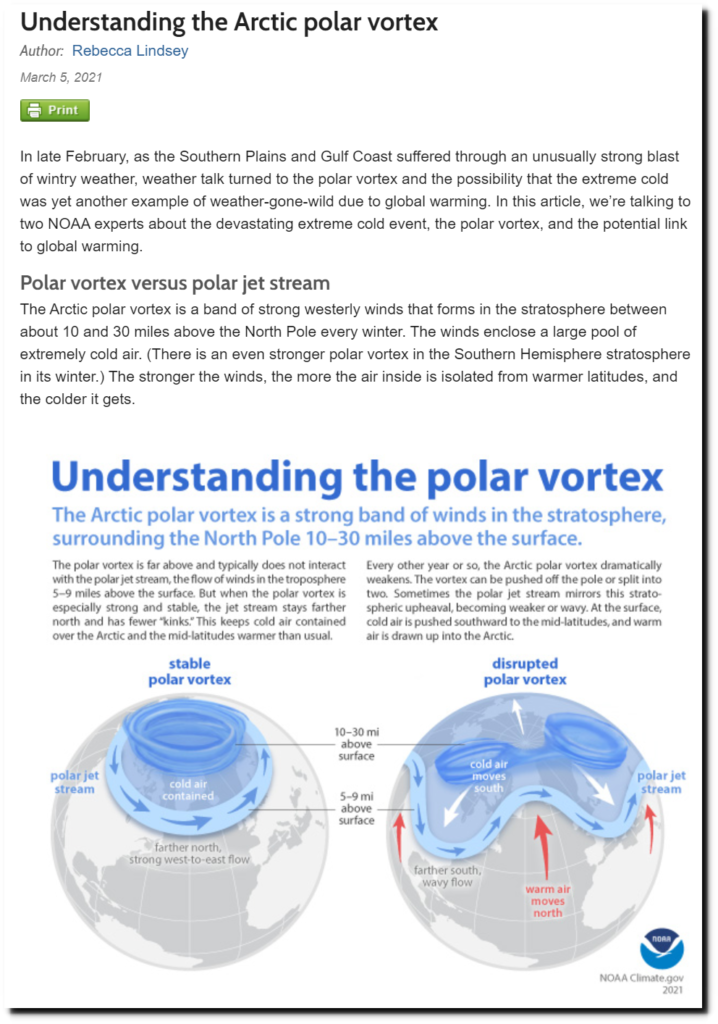
Understanding the Arctic polar vortex | NOAA Climate.gov
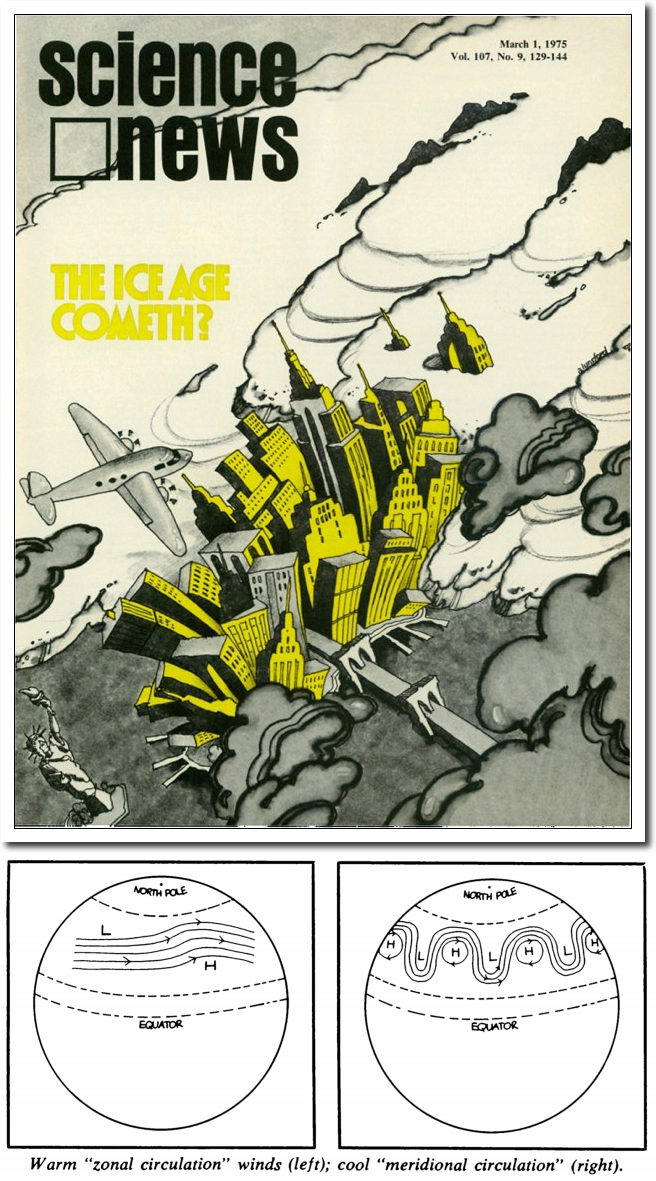
They used the same diagram which Science News in 1975 used to explain global cooling.

March 1, 1975 | Science News
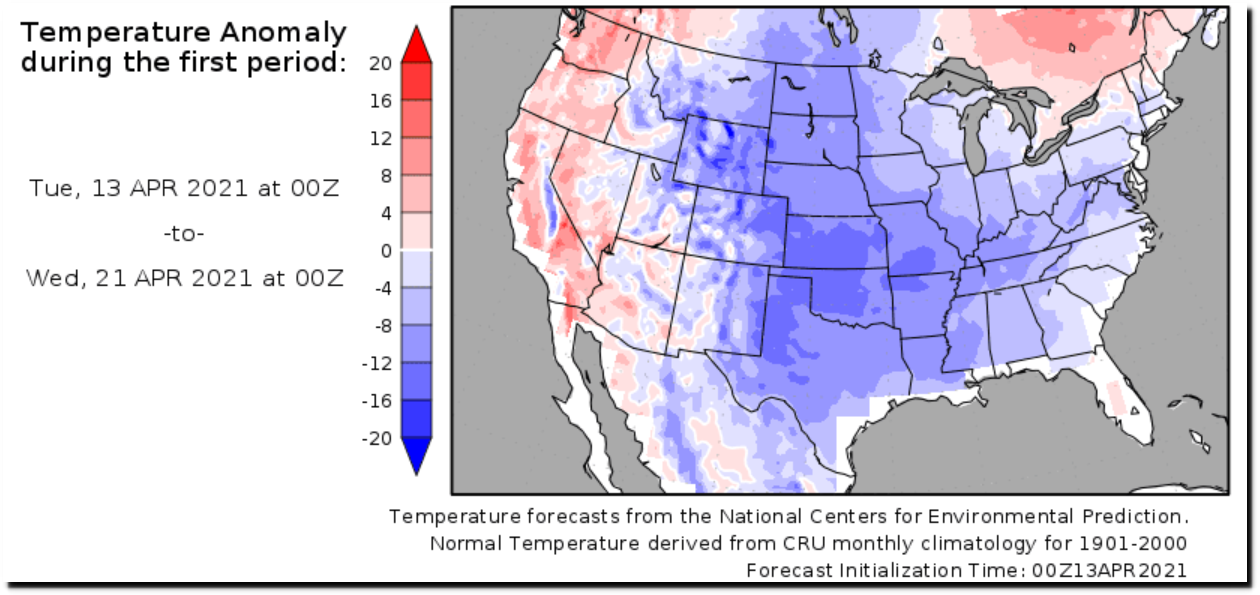
Two weeks ago they predicted a warm April, and got that forecast backwards.
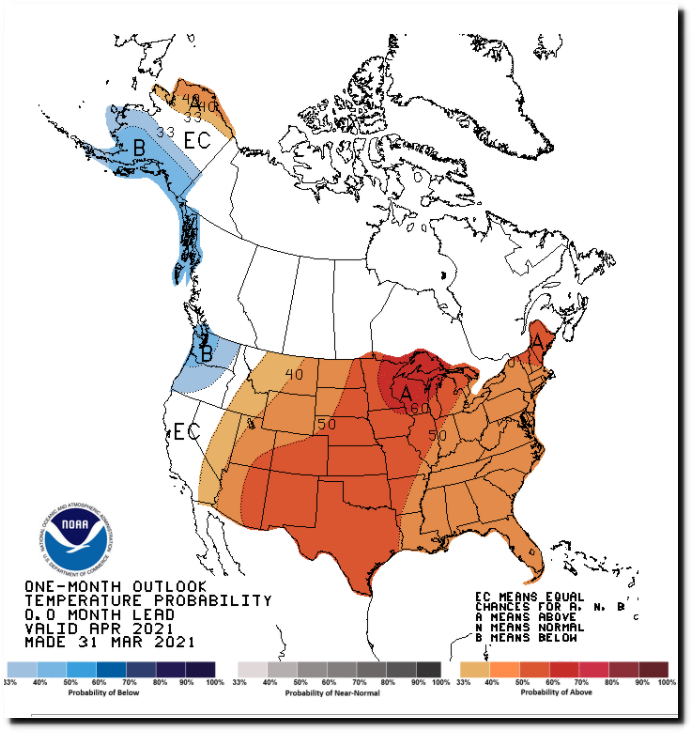
Climate Prediction Center – Revised OFFICIAL 30-Day Forecasts
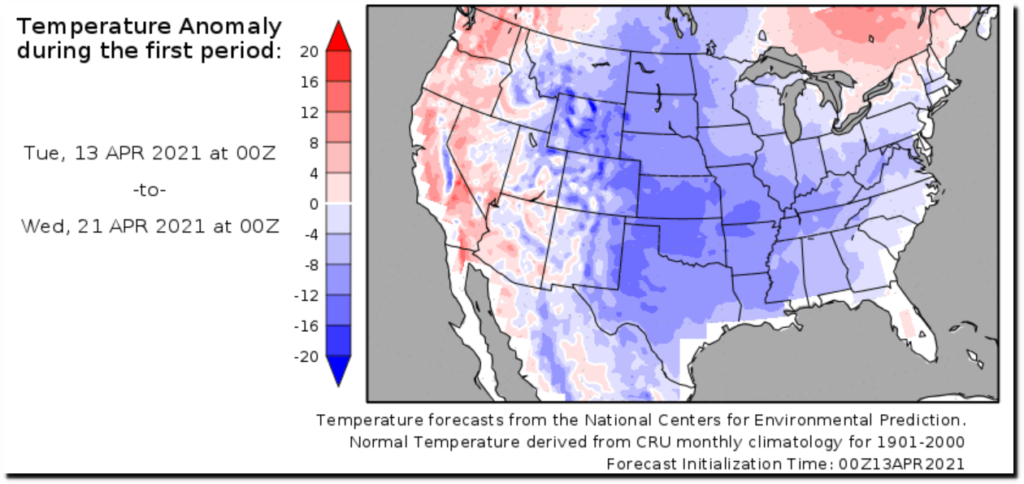
10-Day Temperature Outlook for the Conterminous U.S.
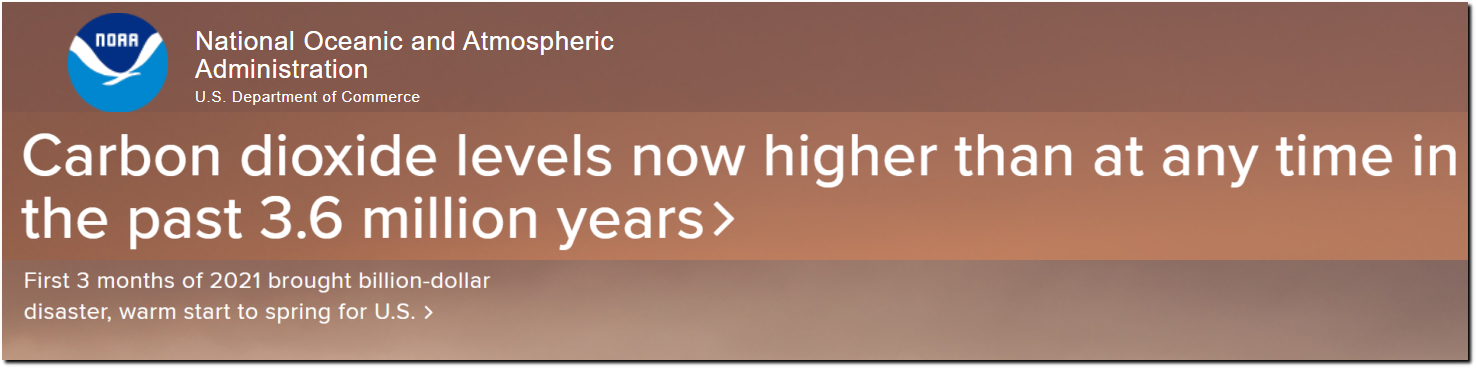
This is what is currently showing on NOAA’s main page :

National Oceanic and Atmospheric Administration | U.S. Department of Commerce
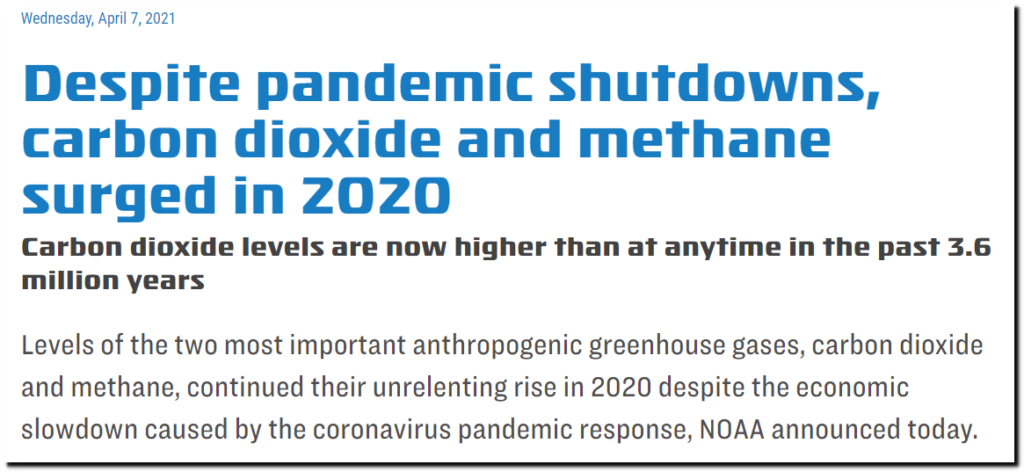
Despite pandemic shutdowns, carbon dioxide and methane surged in 2020 – Welcome to NOAA Research
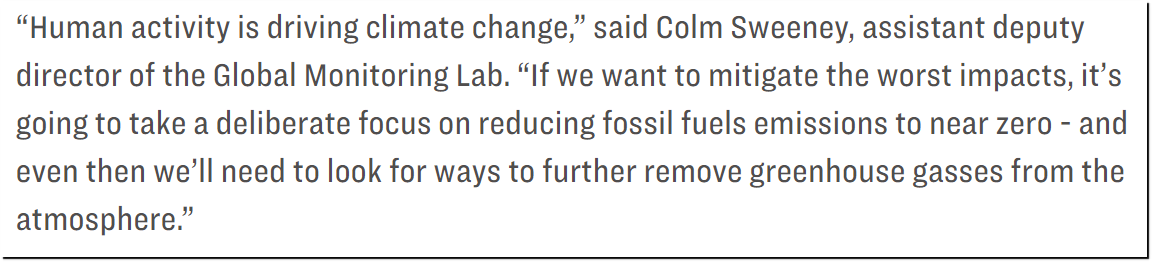
First they acknowledge that government doesn’t control greenhouse gases, then they say government has to control greenhouse gases.

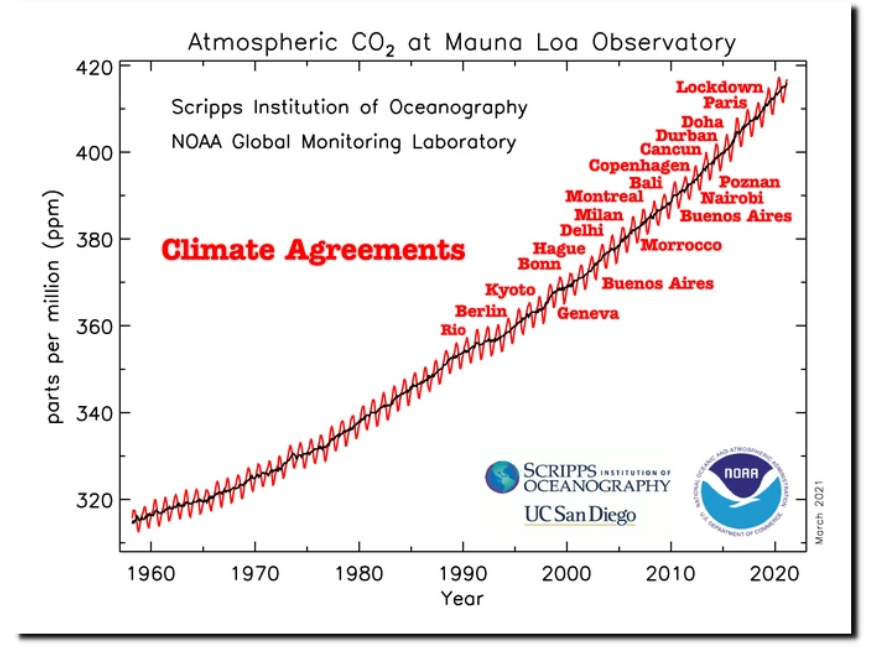
Global Monitoring Laboratory – Carbon Cycle Greenhouse Gases
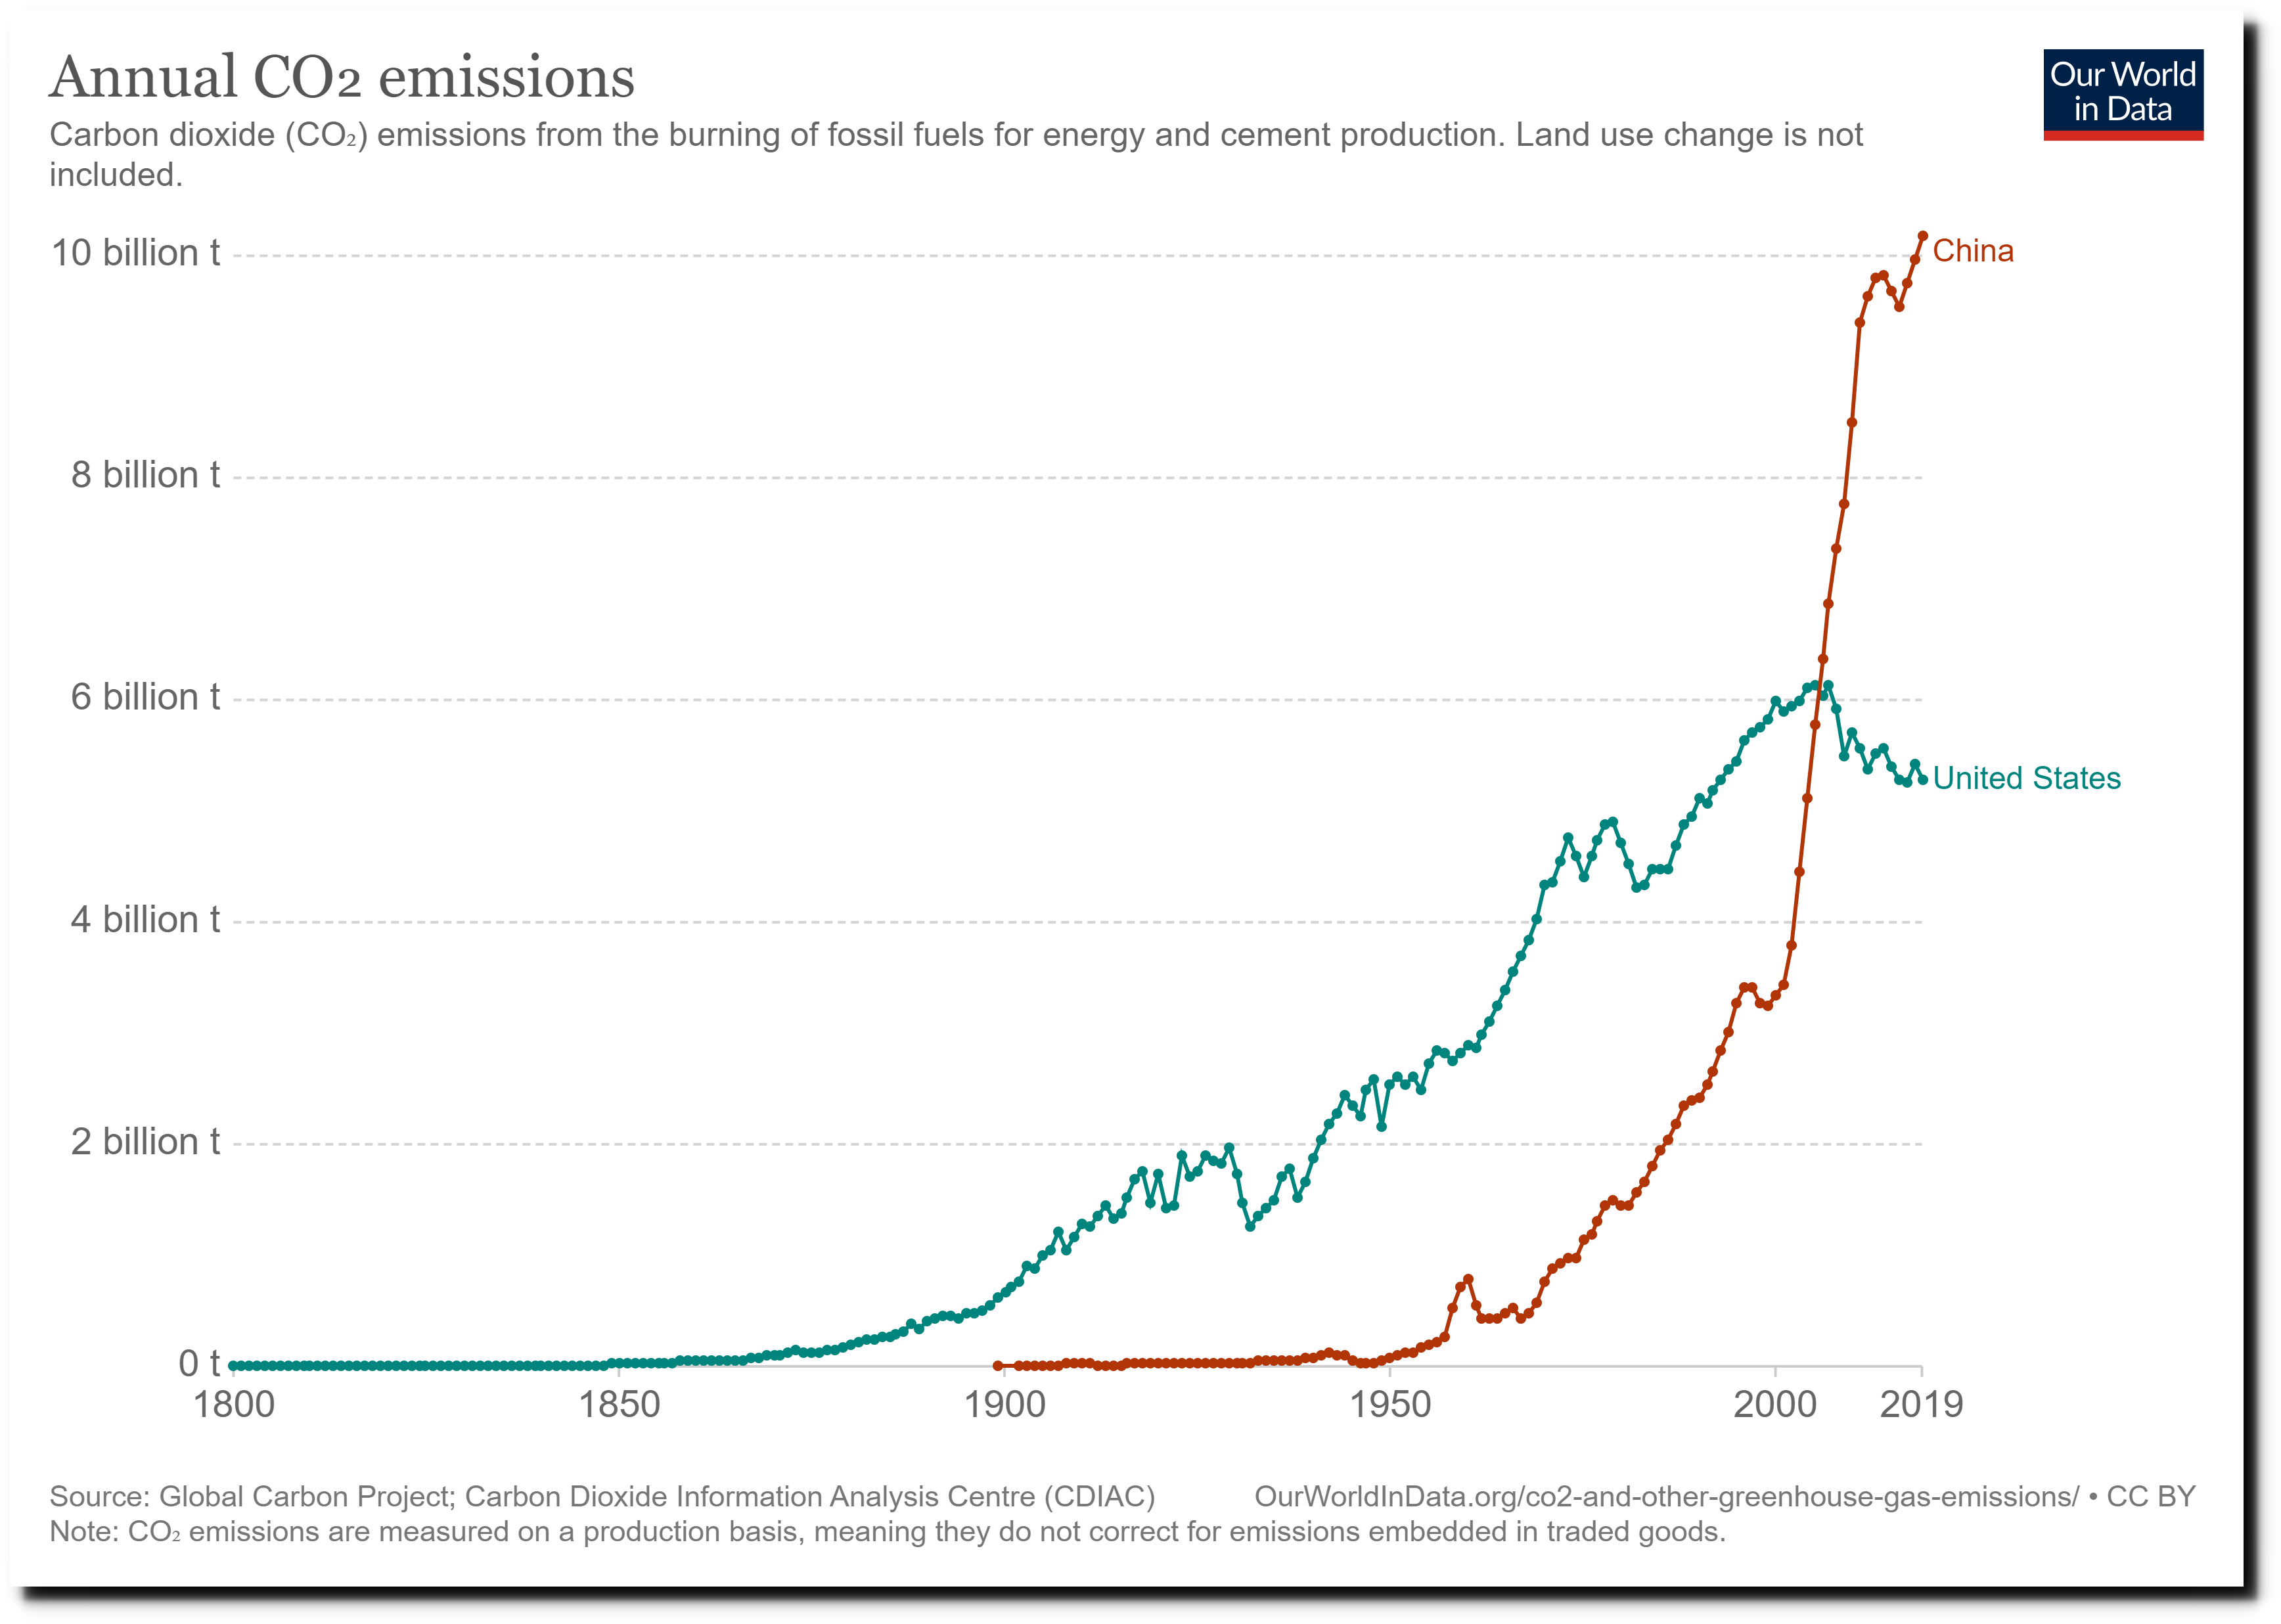
US CO2 emissions have been declining for fifteen years, as China’s have skyrocketed.
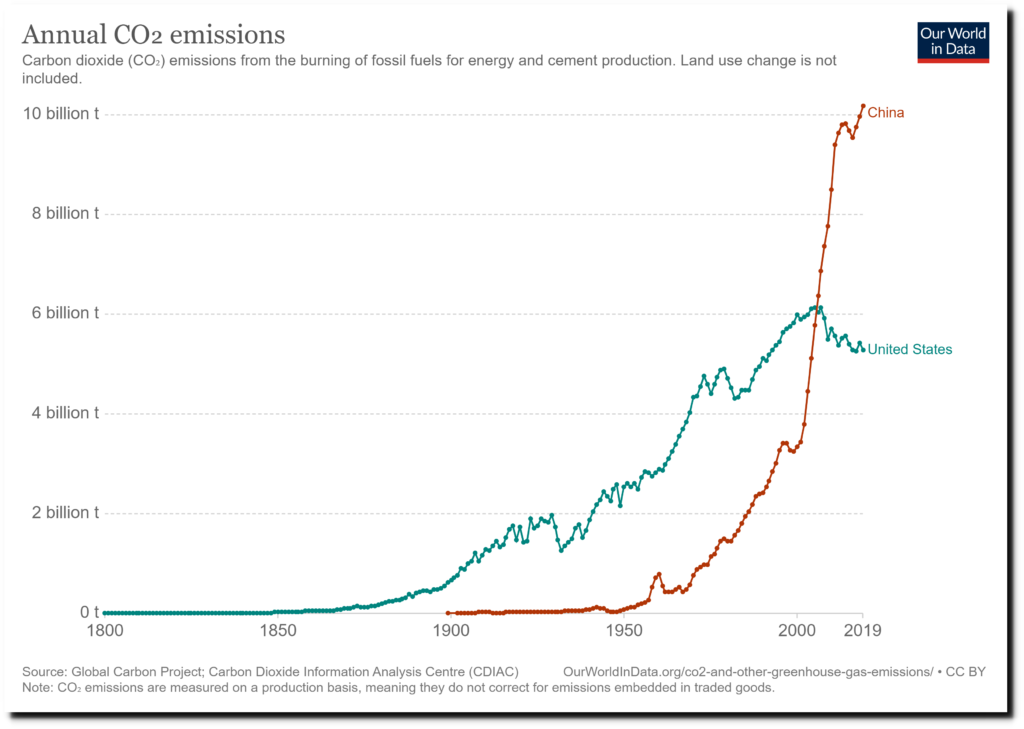
Annual CO? emissions
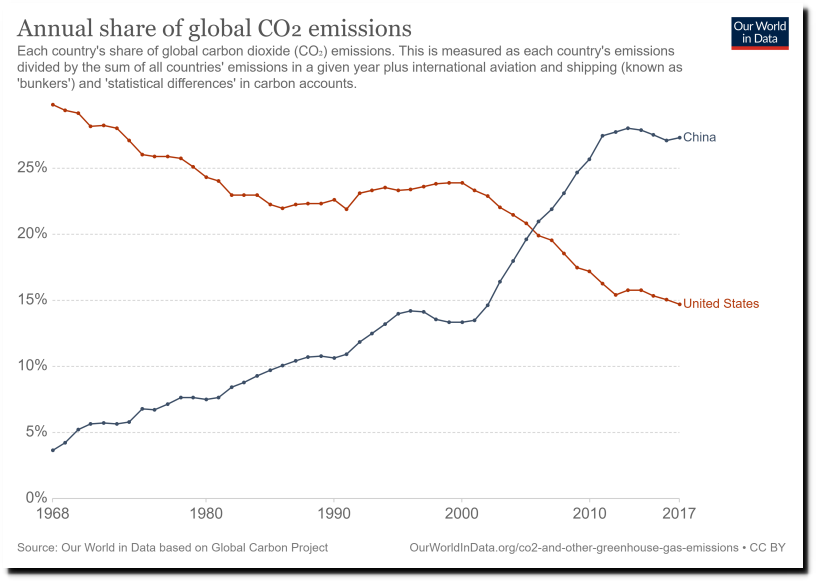
Annual share of global CO? emissions
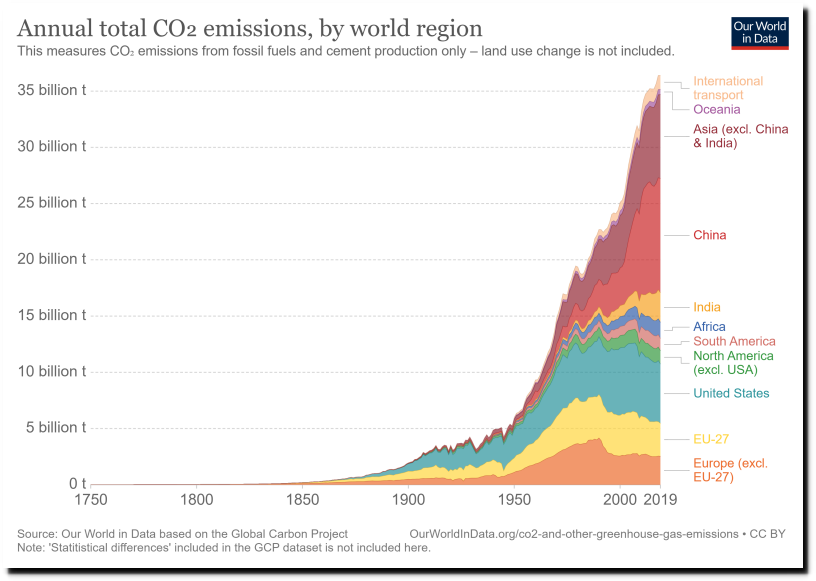
Annual total CO? emissions, by world region
Wayback Machine
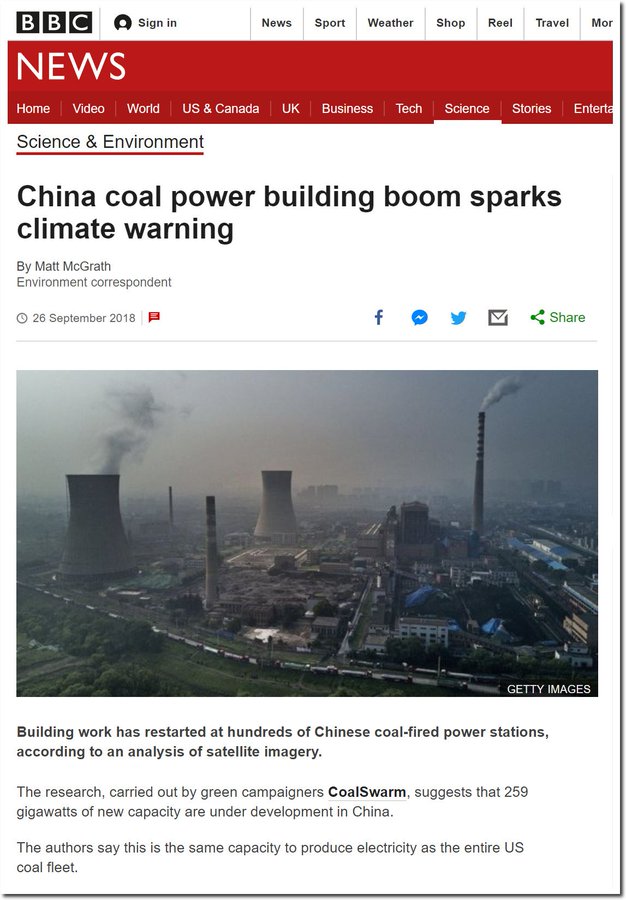
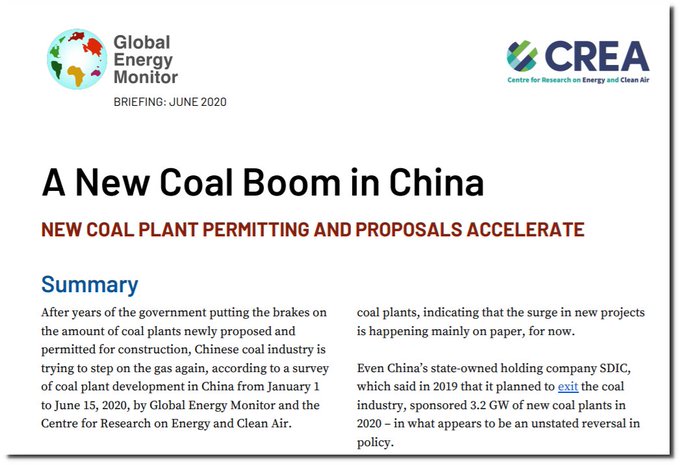
China coal power building boom sparks climate warning – BBC News
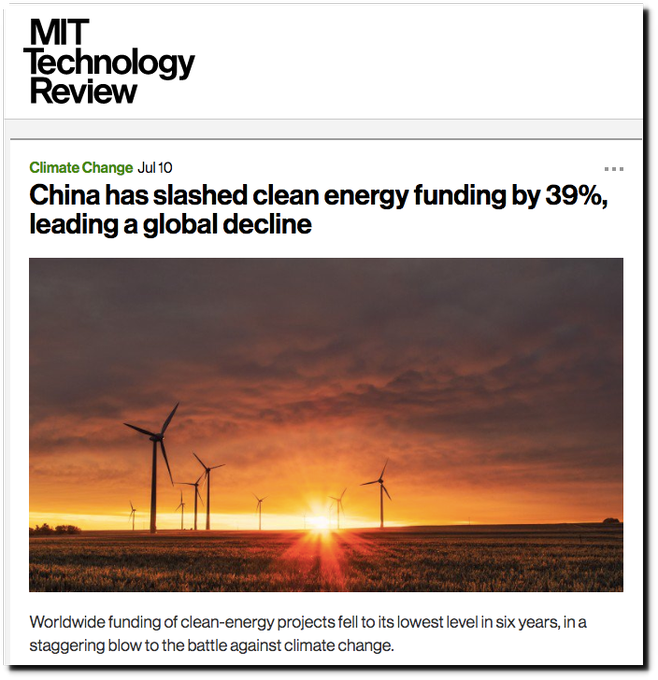
China has slashed clean energy funding by 39%, leading a global decline | MIT Technology Review
John Kerry admits that the US doesn’t control atmospheric CO2 and says that he is hopeful China will collaborate.
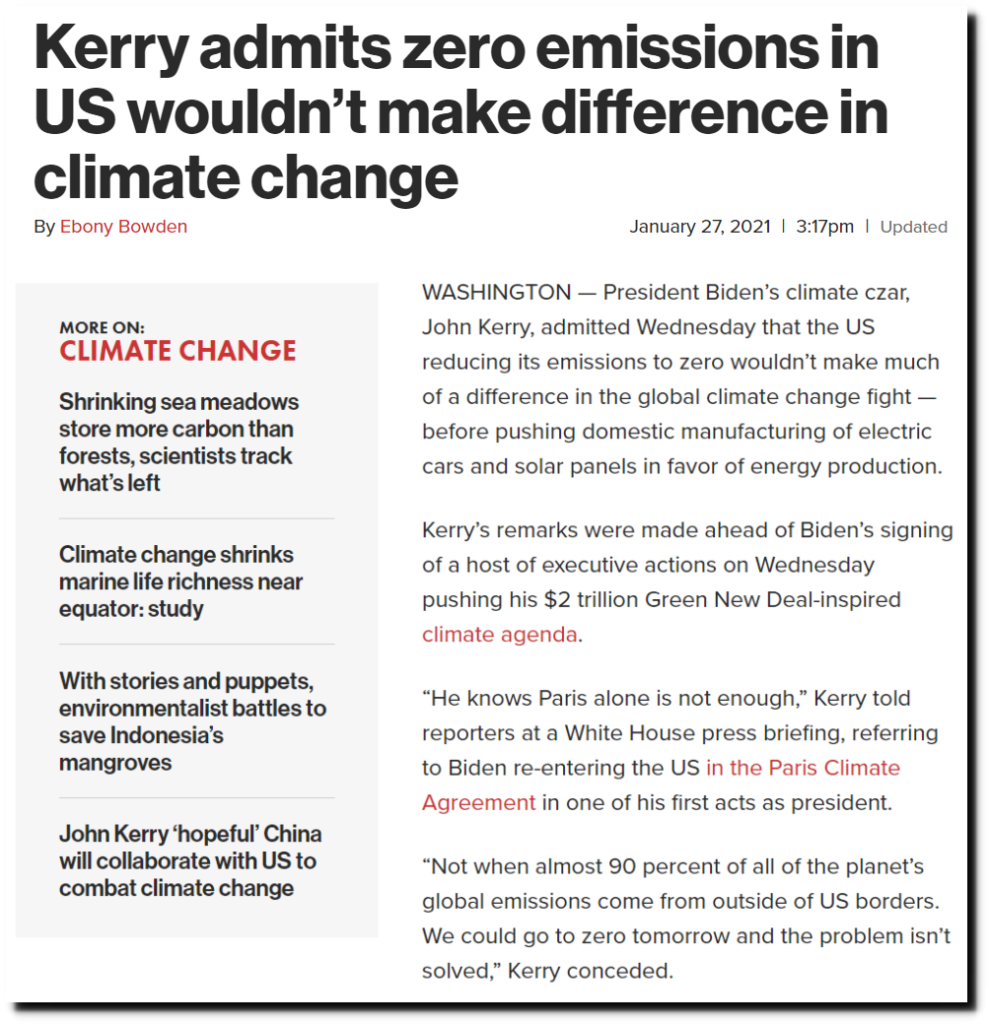
Kerry: Zero emissions won’t make difference in climate change
The last time Biden was in the White House, they pulled the same scam.
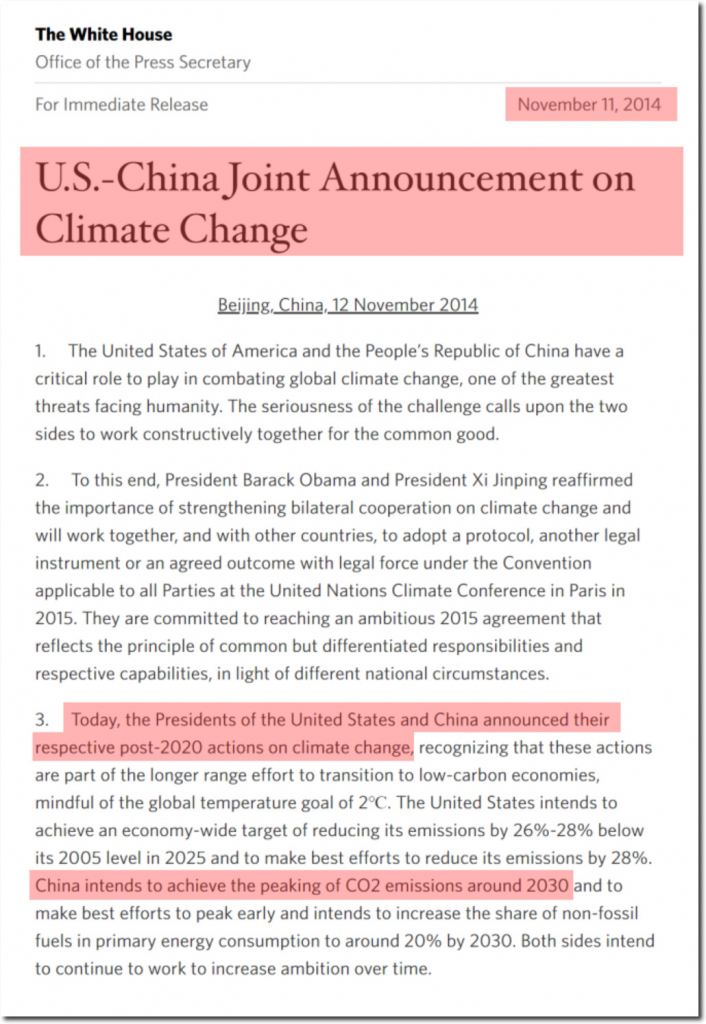
U.S.-China Joint Announcement on Climate Change | whitehouse.gov
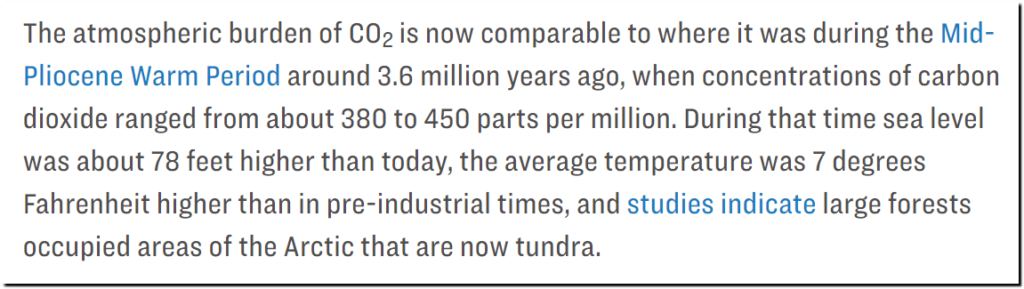
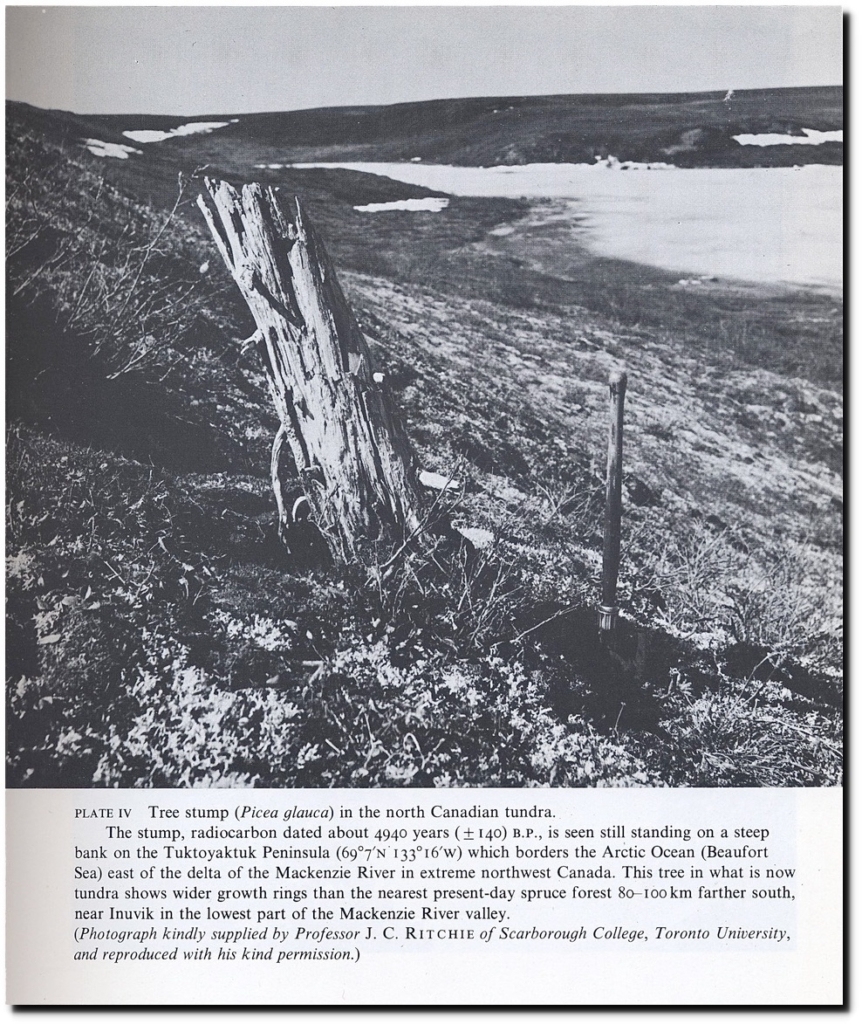
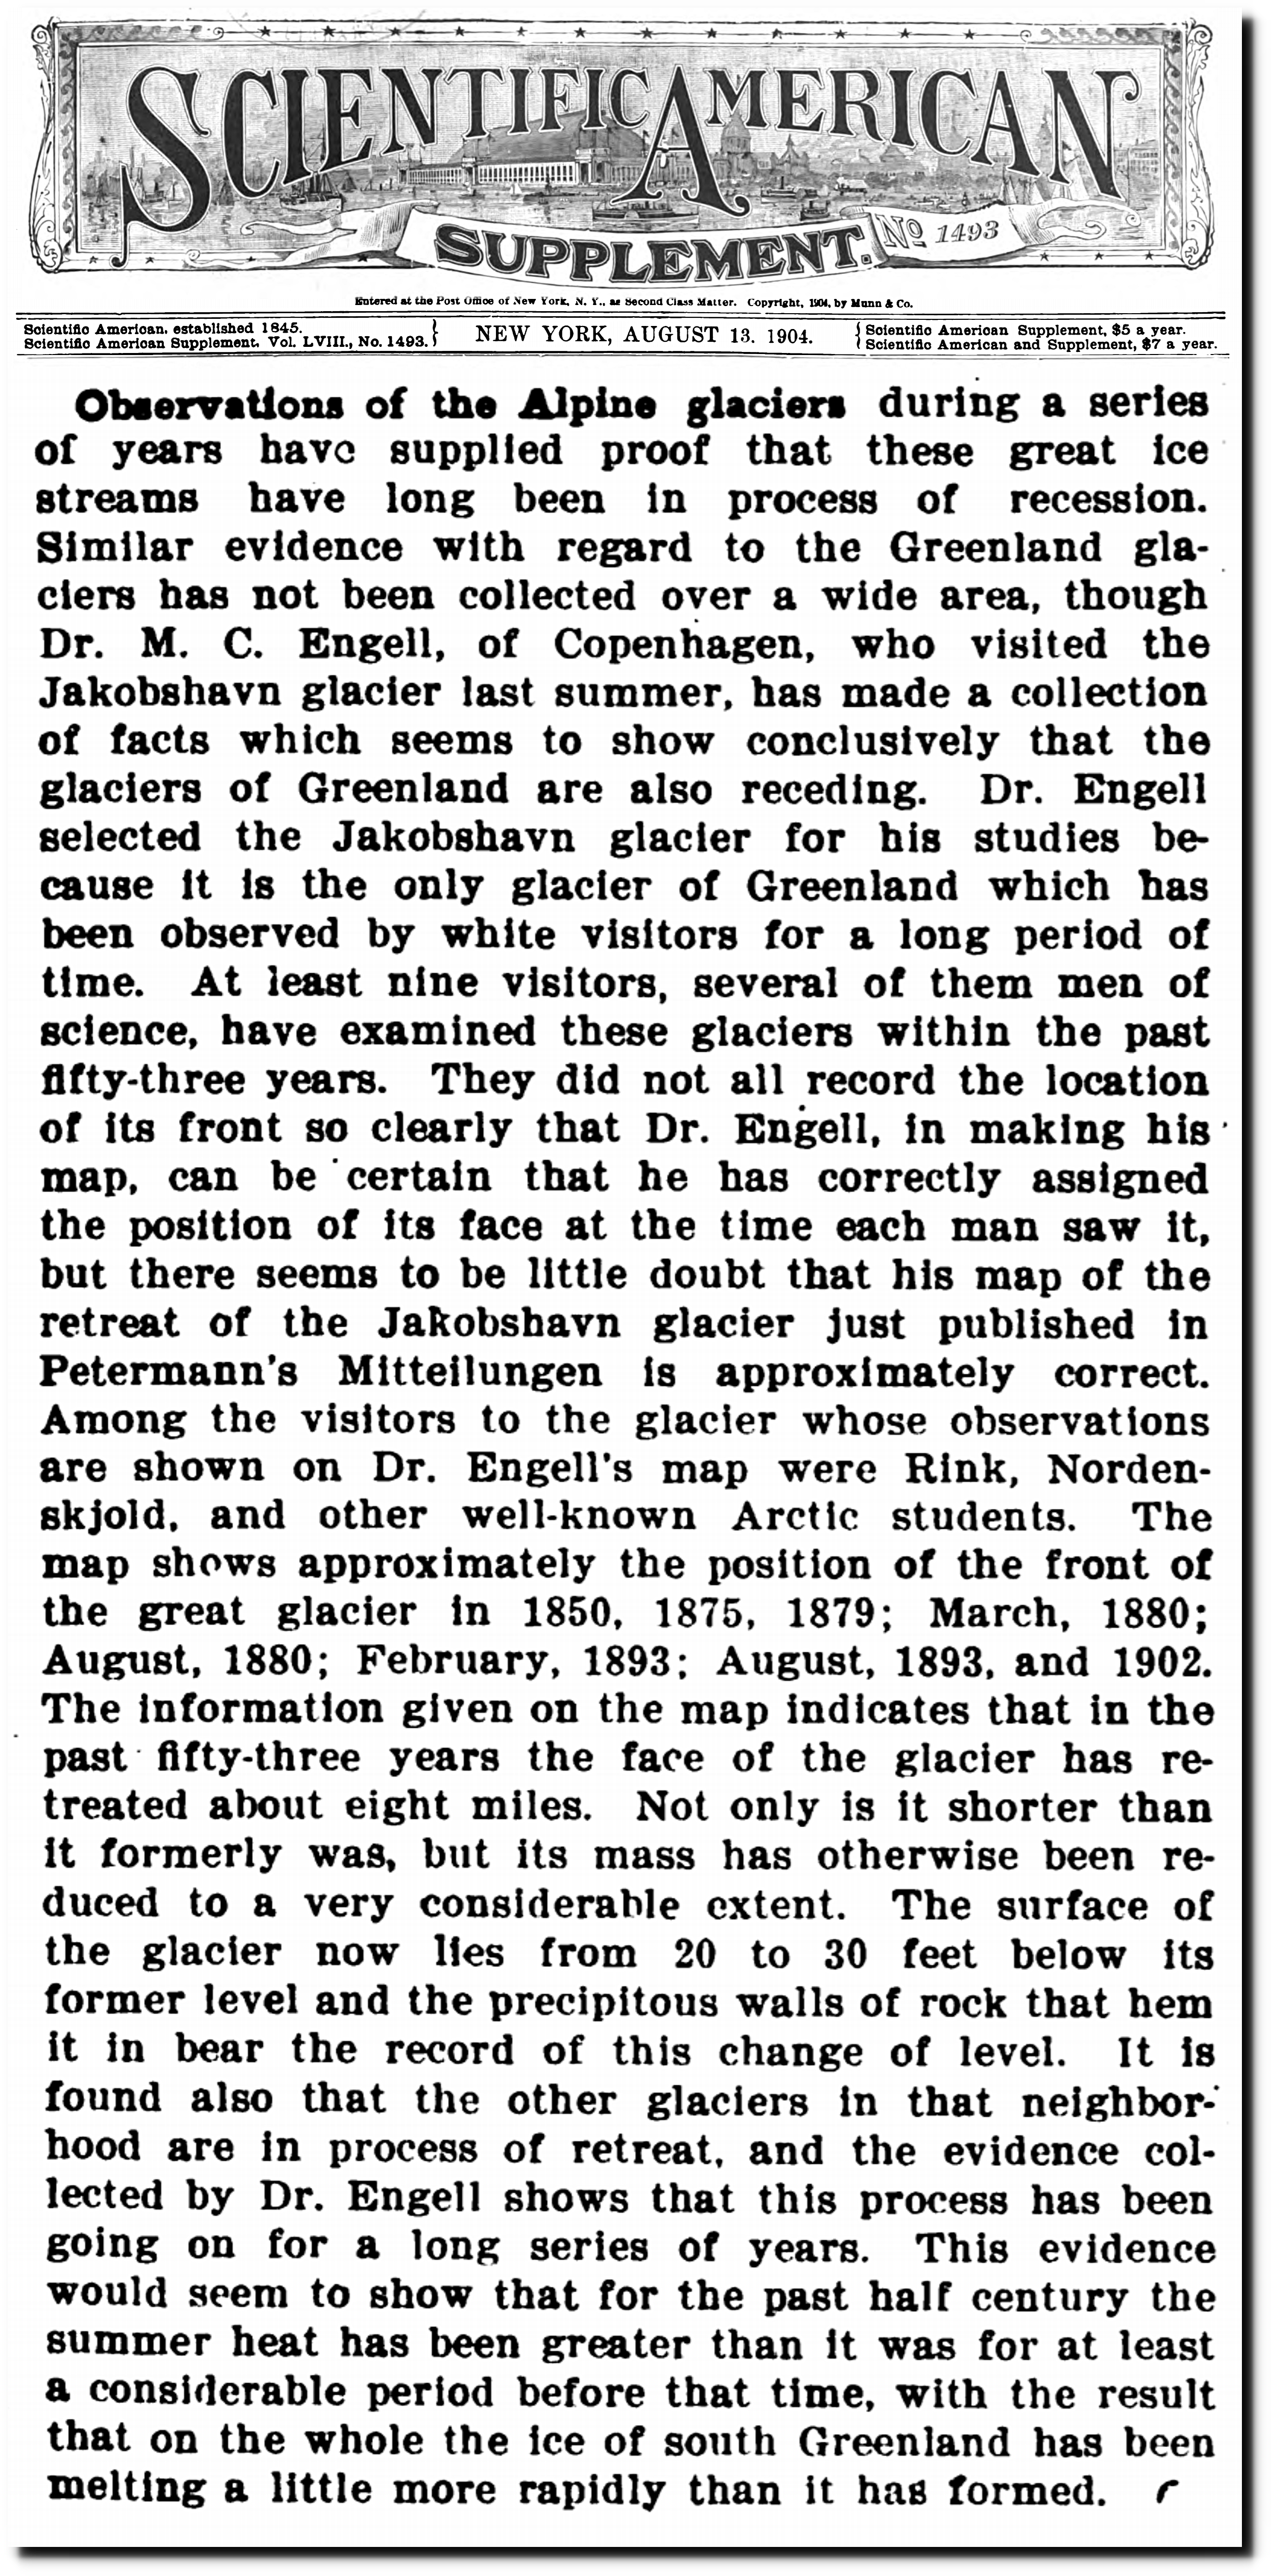
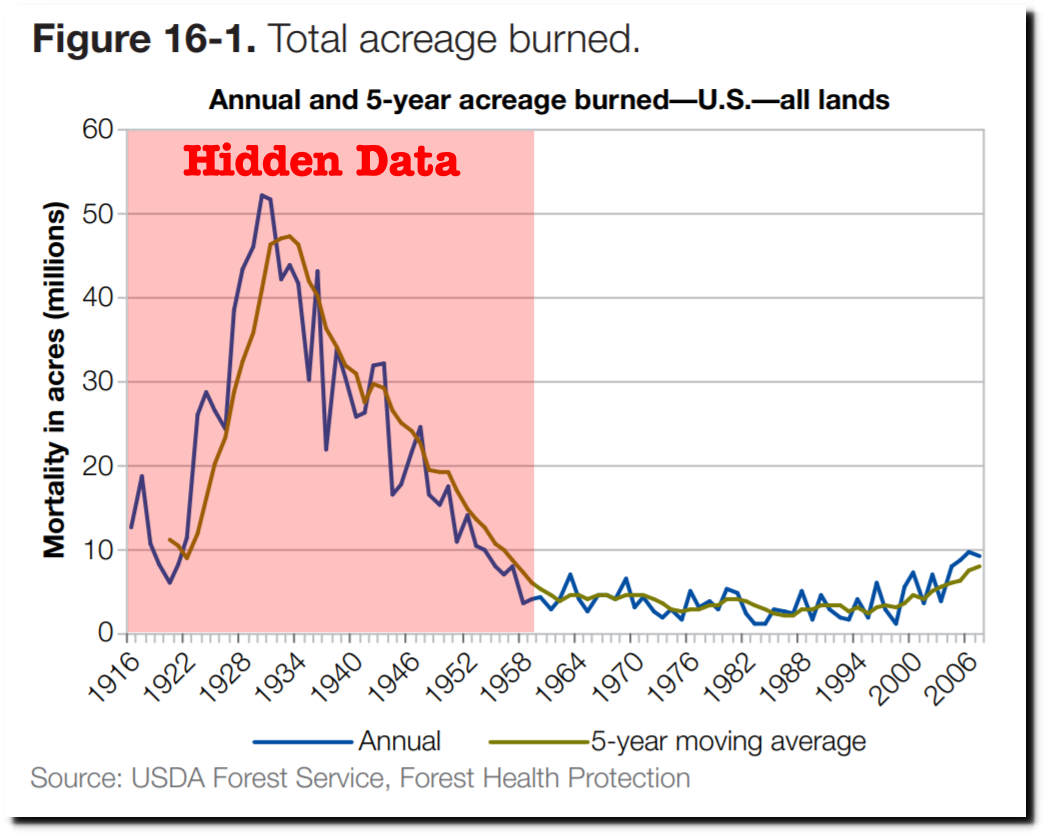
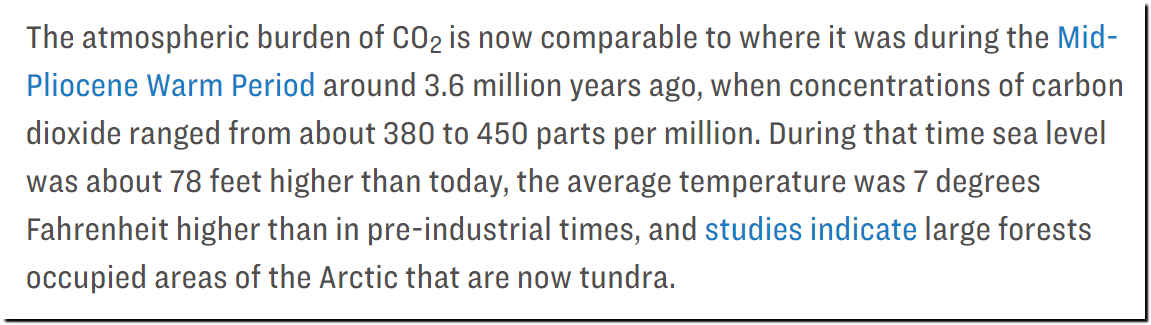
NOAA predicts 78 feet of sea level rise, and forests growing in what is now tundra due to increased levels of CO2.
Despite pandemic shutdowns, carbon dioxide and methane surged in 2020 – Welcome to NOAA Research
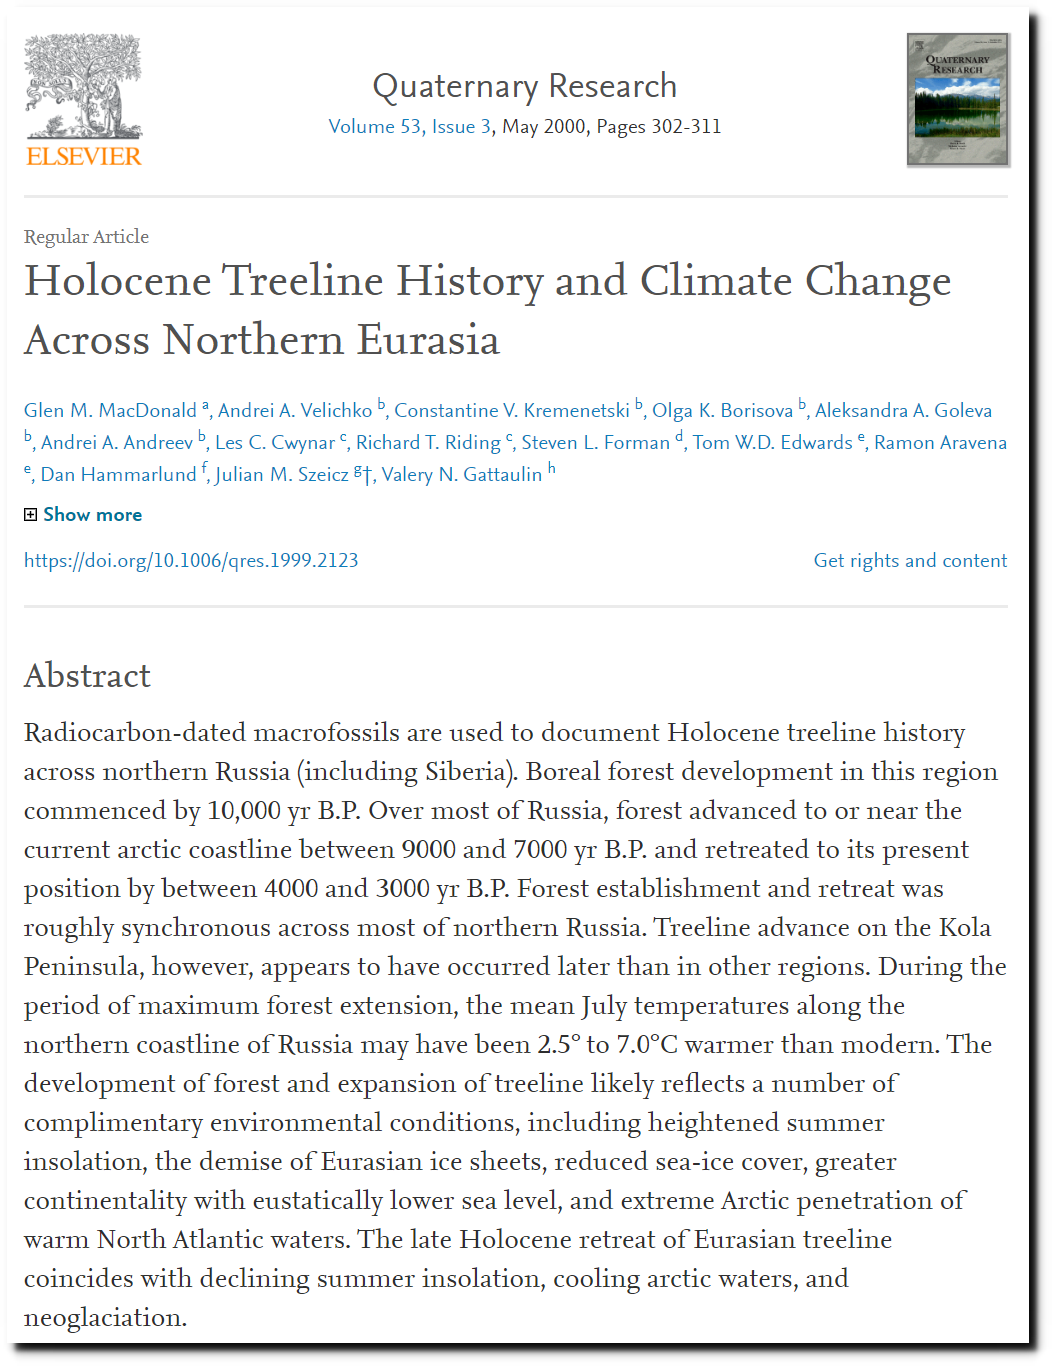
The Arctic was ice-free and trees grew all the way to the edge of the Arctic Ocean from 4,000 to 9,000 years ago, when CO2 levels were much lower.
Less Ice In Arctic Ocean 6000-7000 Years Ago — ScienceDaily

Holocene Treeline History and Climate Change Across Northern Eurasia – ScienceDirect
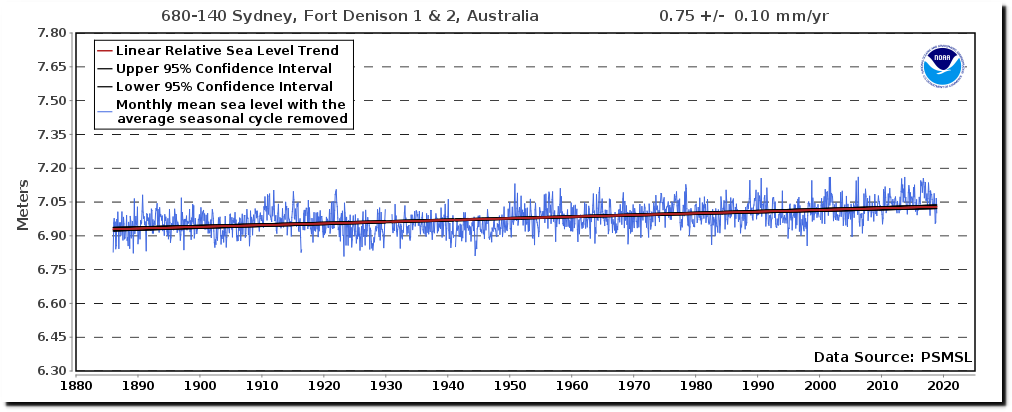
The sea level story is the same as 30 years ago, when globalists said we would drown unless we submitted to global governance.
“GOVERNMENTS must yield national sovereignty to multilateral authorities able to enforce laws “across environmentally invisible frontiers” if the green-house effect, which threatens the future of whole nations, is to be overcome, the Commonwealth Secretary-General, Sir Shridath Ramphal, said on Tuesday.”
“A Commonwealth Expert Group set up to look at climate change estimated there was a 90 per cent certainty that sea levels would rise by between one and four metres by the year 2030.”
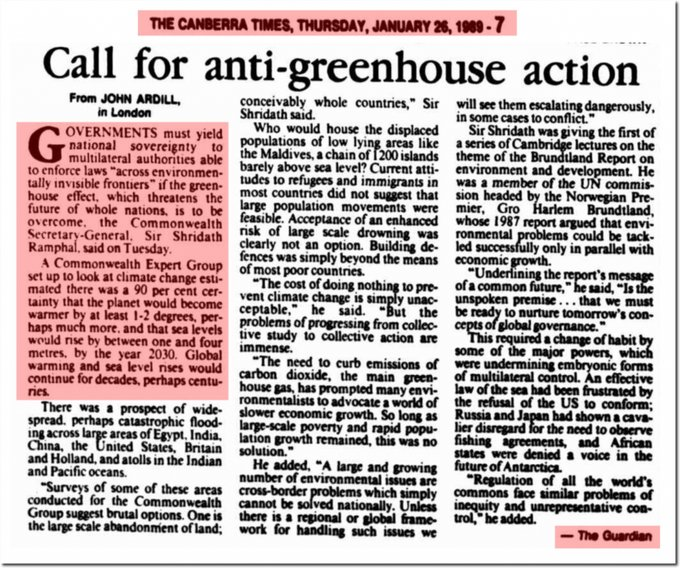
26 Jan 1989 – Call for anti-greenhouse action – Trove
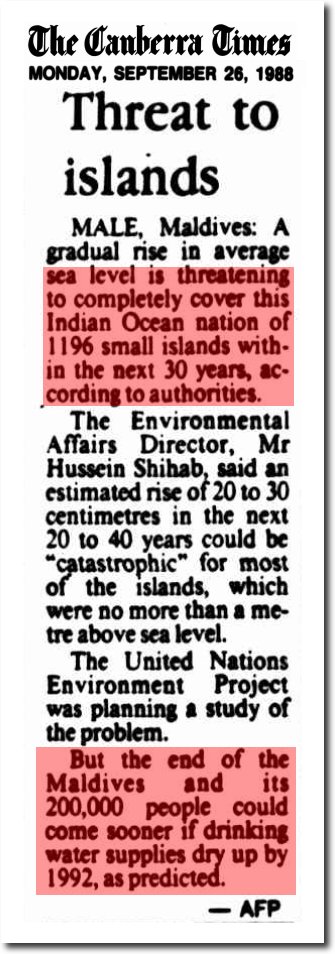
26 Sep 1988 – Threat to islands – Trove
Stormy weather – Global warming – Salon.com
Mercury News: Search Results
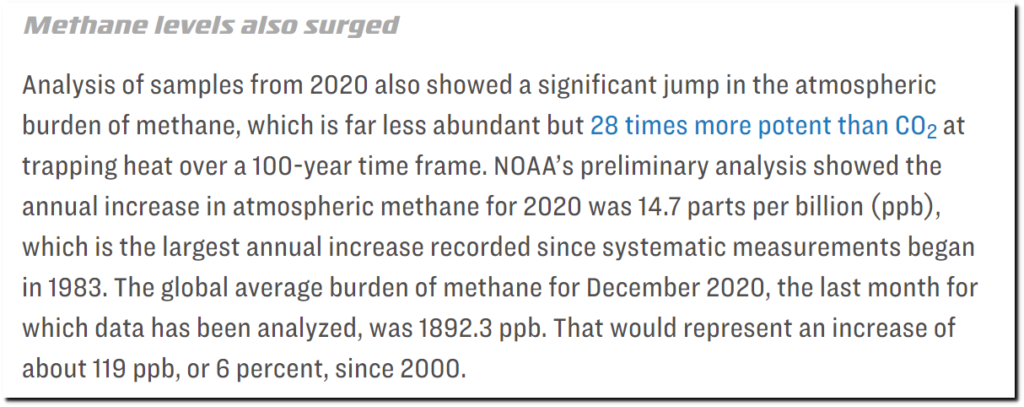
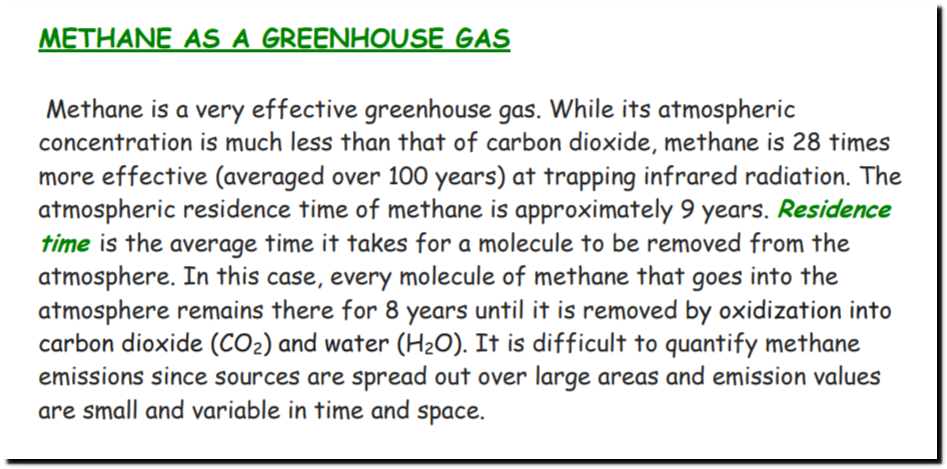
And NOAA is fearmongering about methane “over a 100 year time frame”
Despite pandemic shutdowns, carbon dioxide and methane surged in 2020 – Welcome to NOAA Research
If NOAA scientists bothered to read NOAA research, they would know that the residence time of methane in the atmosphere is only nine years.
CTA_the_methane_cycle.pdf
There are lots of other reasons why the methane story is bogus. The graph below was generated using the RRTM-LW model from AER, with their standard mid-latitude summer atmosphere parameters as input. This is the model used by the National Center for Atmospheric Research in their weather and climate models. The Y-axis shows the amount of downwelling longwave radiation (i.e. greenhouse effect) produced by different levels of greenhouse gases in the mid-latitude summer lower troposphere (952 mb.) The X-axis is logarithmic, with four values plotted for each gas.
- 0% of current levels
- 10% of current levels
- 100% of current levels
- 1000% of current levels
Each of the three curves assumes constant (current) values for the other two gases.
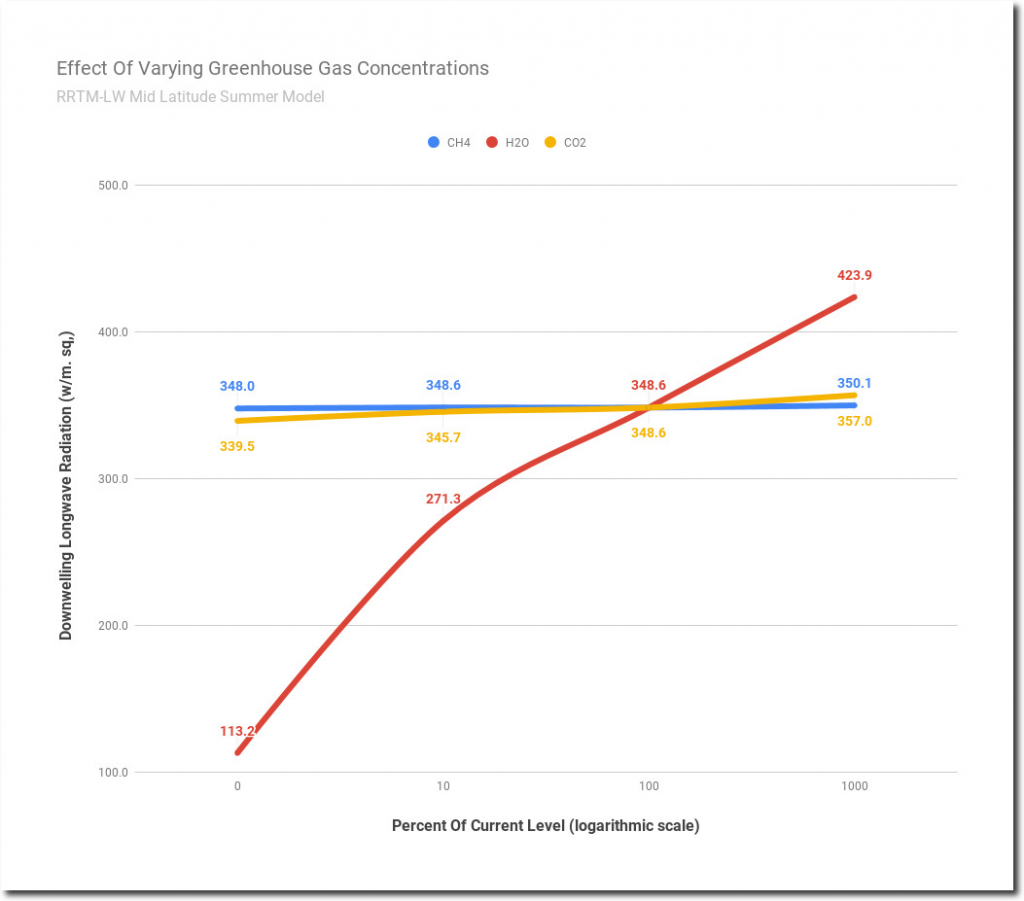
Water vapor (H2O) is far and away the dominant greenhouse gas. With no water vapor, the amount of DLWR would be less than one third of its current value.
CO2 is significant, but much smaller than H2O. CH4 (methane) is nearly inconsequential. If you reduce methane by 10X or increase it by 10X, the change in DLWR (downwelling longwave radiation) is small. Claims that CH4 is 28X stronger than H2O are complete nonsense and have no basis in science.
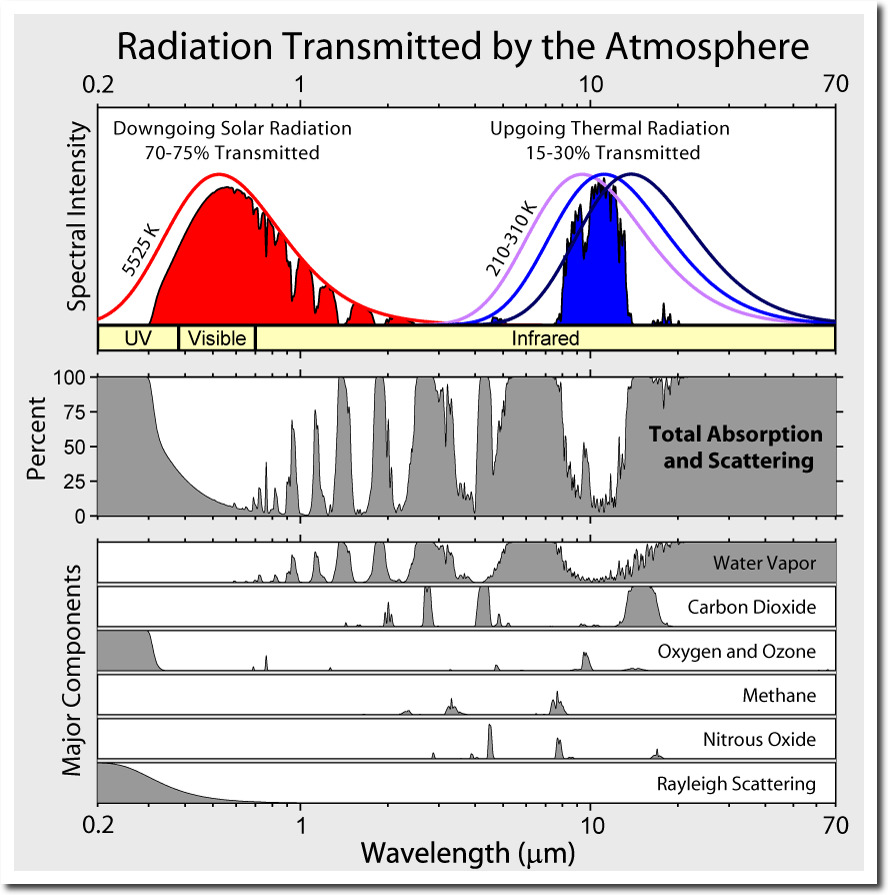
It is easy to see why methane is inconsequential in the spectral diagram below. Methane only has three small peaks, compared with the much larger and broader peaks of H2O and CO2. A good way to estimate greenhouse gas potential is to measure the area under the curve for each gas. The area under the methane curve is quite small compared to the areas under the H2O and CO2 curves.
File:Atmospheric Transmission.png – Wikimedia Commons
But methane has another problem, its peaks line up with H2O peaks, so those spectral bands are nearly saturated.
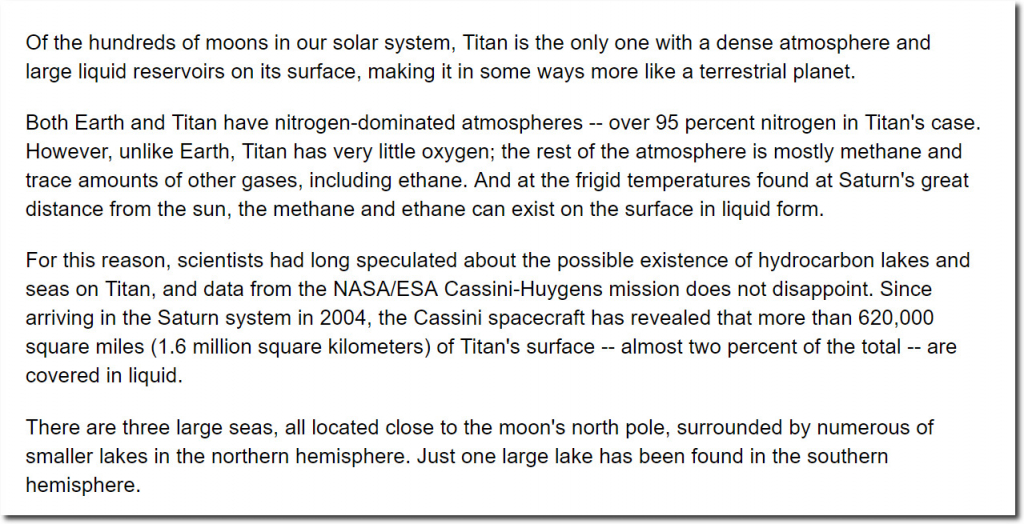
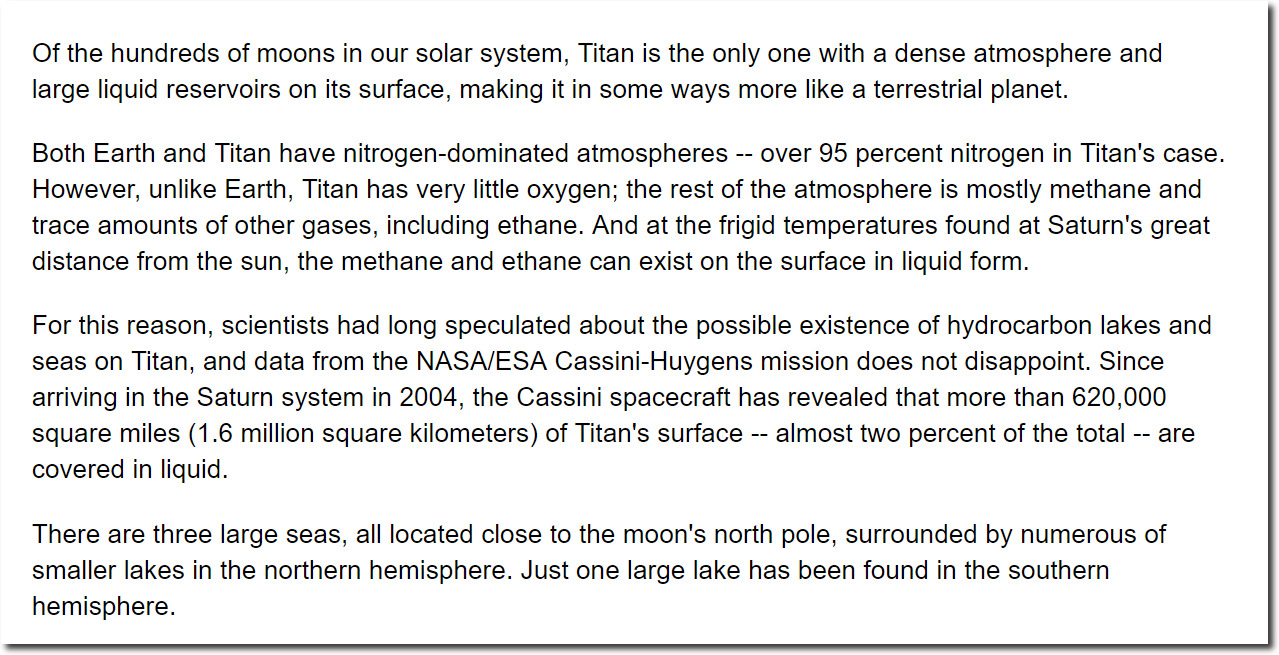
It is also impossible to build up large amounts of methane in an atmosphere which contains oxygen, because it quickly oxidizes in the presence of oxygen into H2O and CO2. That is why we use it for a fuel. The concentration of methane during mid-latitude summer is a tiny 1.7 PPM, but planets (including Earth) emit a lot of methane. Saturn’s moon Titan has methane seas. The reason Titan is able to hold its methane is because it has almost no oxygen.

Cassini Explores a Methane Sea on Titan | NASA
Earth is nothing like Titan, because we have oxygen. The global warming potential of methane on Earth is thus very small, and is nearly inconsequential compared to water vapor.


