


Disrupting the Borg is expensive and time consuming!

Google Search
-
Recent Posts
- One Atomic Bomb Per Hour
- New Video : Analyzing Oil And Gas
- Is Antarctica Melting?
- High Speed Analysis And Visualization
- El Nino To The Rescue?
- Fake News Update
- Growth Of Antarctic Sea Ice
- 65 Years Of Progress!
- El Nino To The Rescue?
- Worst March Drought On Record
- ChartGL Process Control Demo
- The Biggest Money Laundering Scam
- Drought In The Headwaters Of Lake Powell
- Unrealistic Expectations Of Water Availability
- Did Bill Gates Do This?
- Worst March Drought On Record In The US
- The Real Hockey Stick Graph
- Analyzing The Western Water Crisis
- Gaslighting 1924
- “Why Do You Resist?”
- Climate Attribution Model
- Fact Checking NASA
- Fact Checking Grok
- Fact Checking The New York Times
- New Visitech Features
Recent Comments
- Gordon Vigurs on One Atomic Bomb Per Hour
- Gordon Vigurs on One Atomic Bomb Per Hour
- Gordon Vigurs on One Atomic Bomb Per Hour
- BenV on One Atomic Bomb Per Hour
- Jack the Insider on One Atomic Bomb Per Hour
- conrad ziefle on One Atomic Bomb Per Hour
- Bob G on New Video : Analyzing Oil And Gas
- conrad ziefle on New Video : Analyzing Oil And Gas
- Bob G on Is Antarctica Melting?
- arn on Is Antarctica Melting?
The Biden Eagle
Posted in Uncategorized
Leave a comment
Taking America Over The Cliff
Al Gore started America down a dangerous path 30 years ago, and Joe Biden is poised to push America over the cliff now. This video covers the last 30 years of global warming superstition, corruption and madness.
Posted in Uncategorized
Leave a comment
Making The Pause Disappear
“The fact is that we can’t account for the lack of warming at the moment and it is a travesty that we can’t”
– Kevin Trenberth NCAR 2009
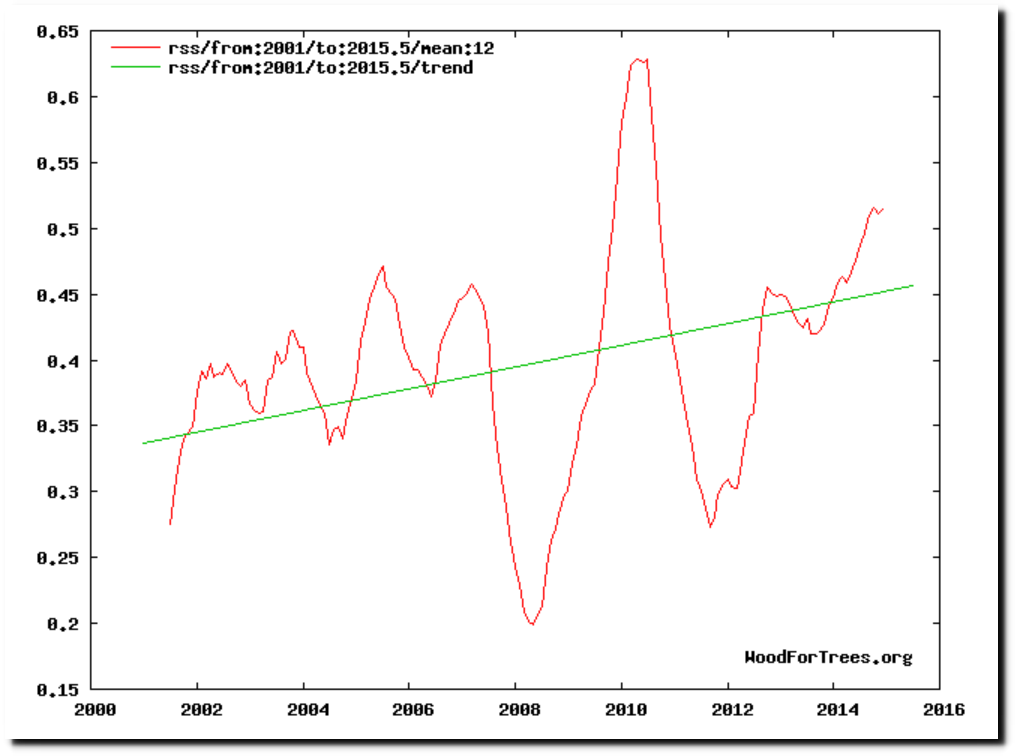
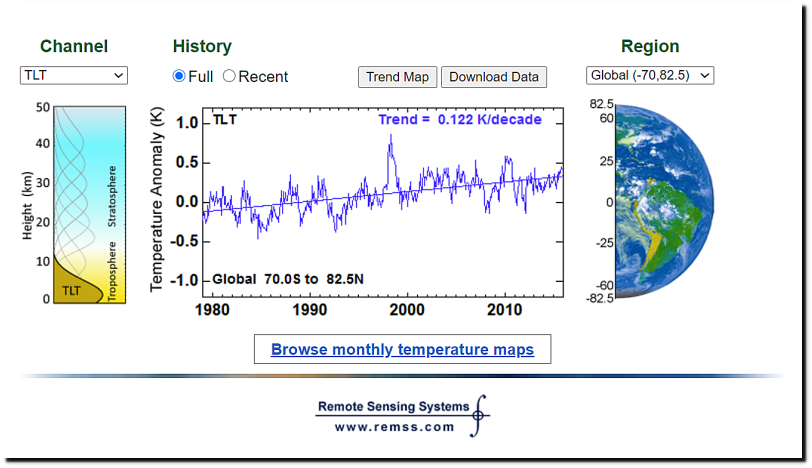
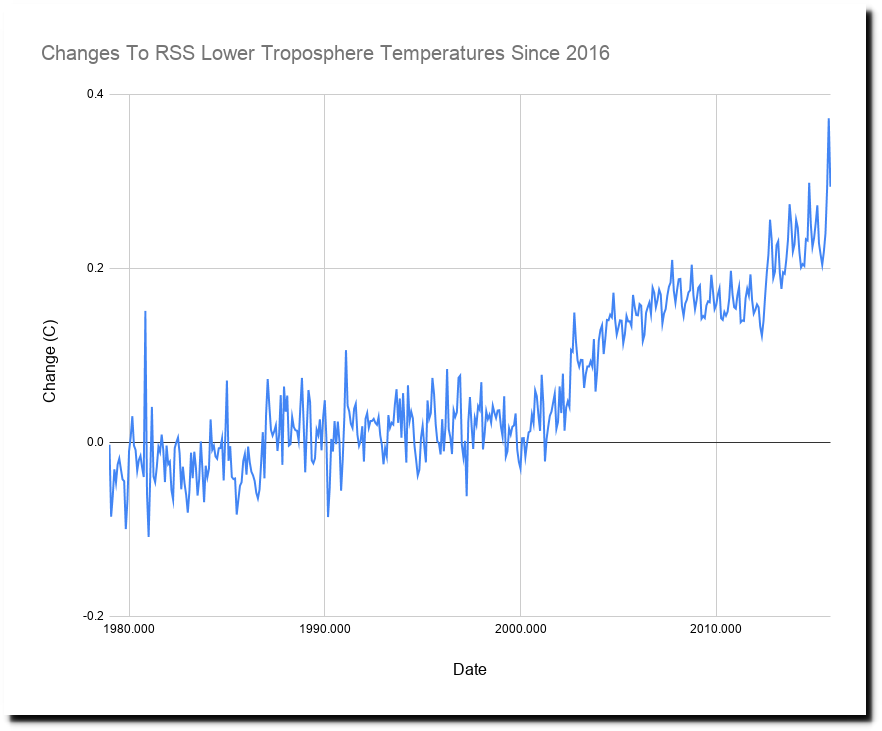
In 2015, satellites showed that the world had cooled since the beginning of the century.
A Pattern Of Repeated Fraud By Climate Scientists | Real Climate Science
This didn’t suit the agenda, so government scientists declared the “pause” to be invalid.
US scientists: Global warming pause ‘no longer valid’ – BBC News
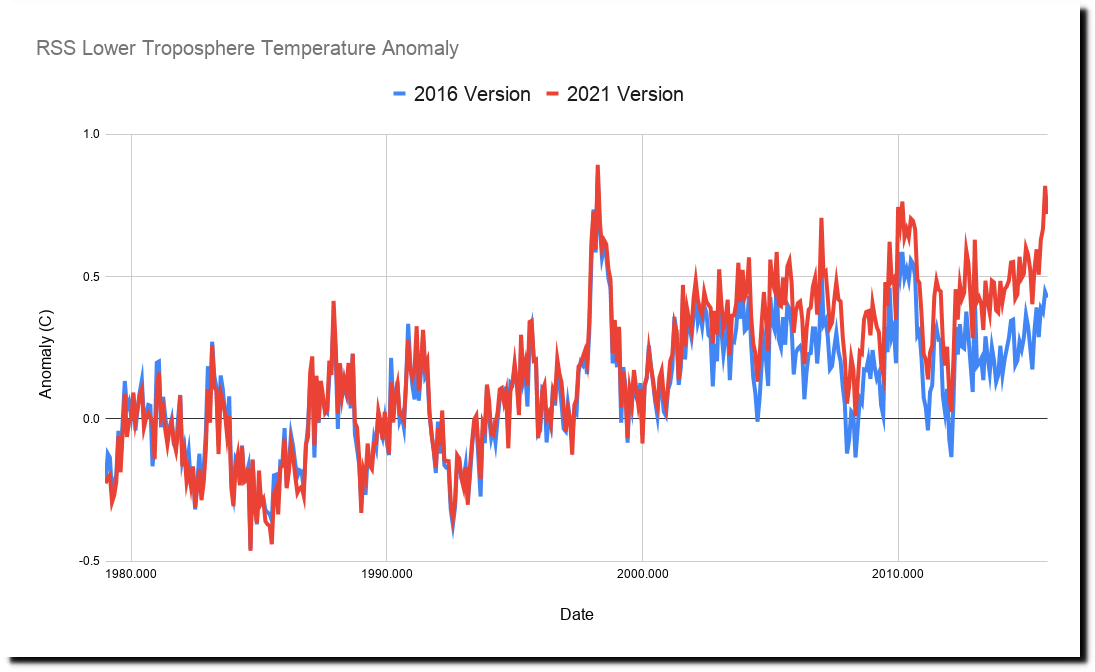
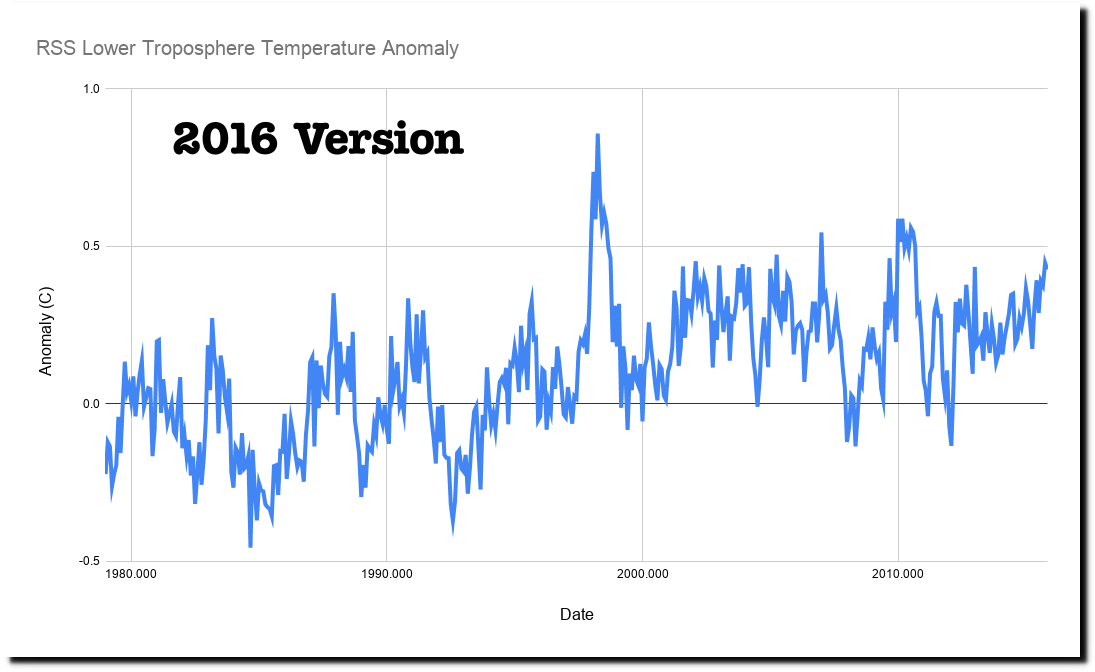
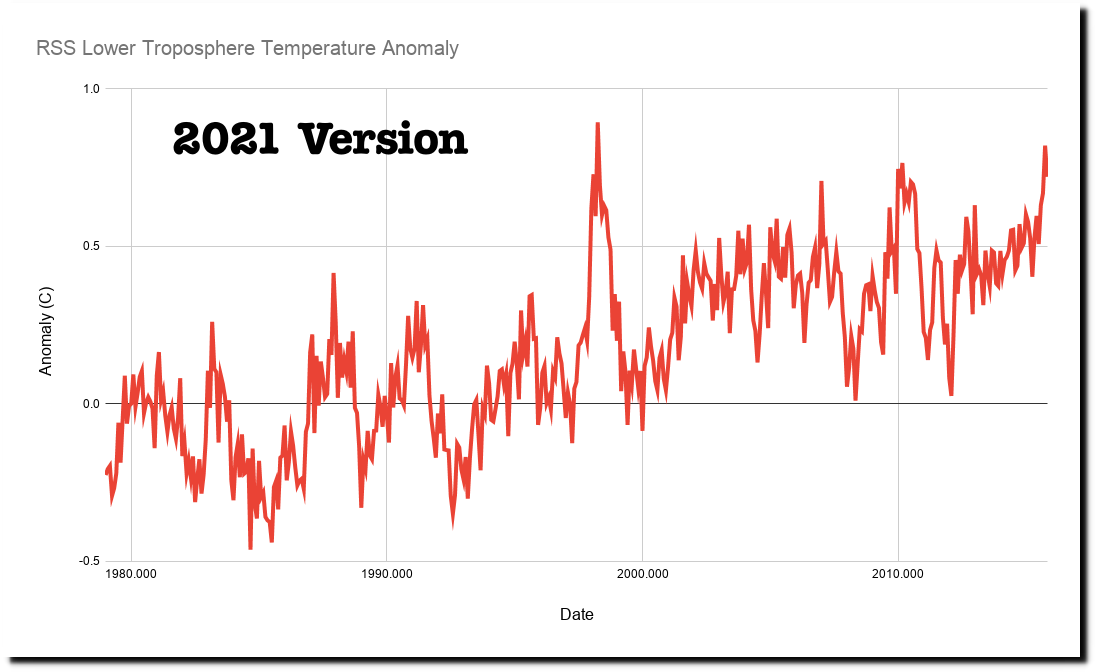
And Carl Mears at RSS complied by turning the cooling trend into a warming trend.
Wood for Trees: Interactive Graphs
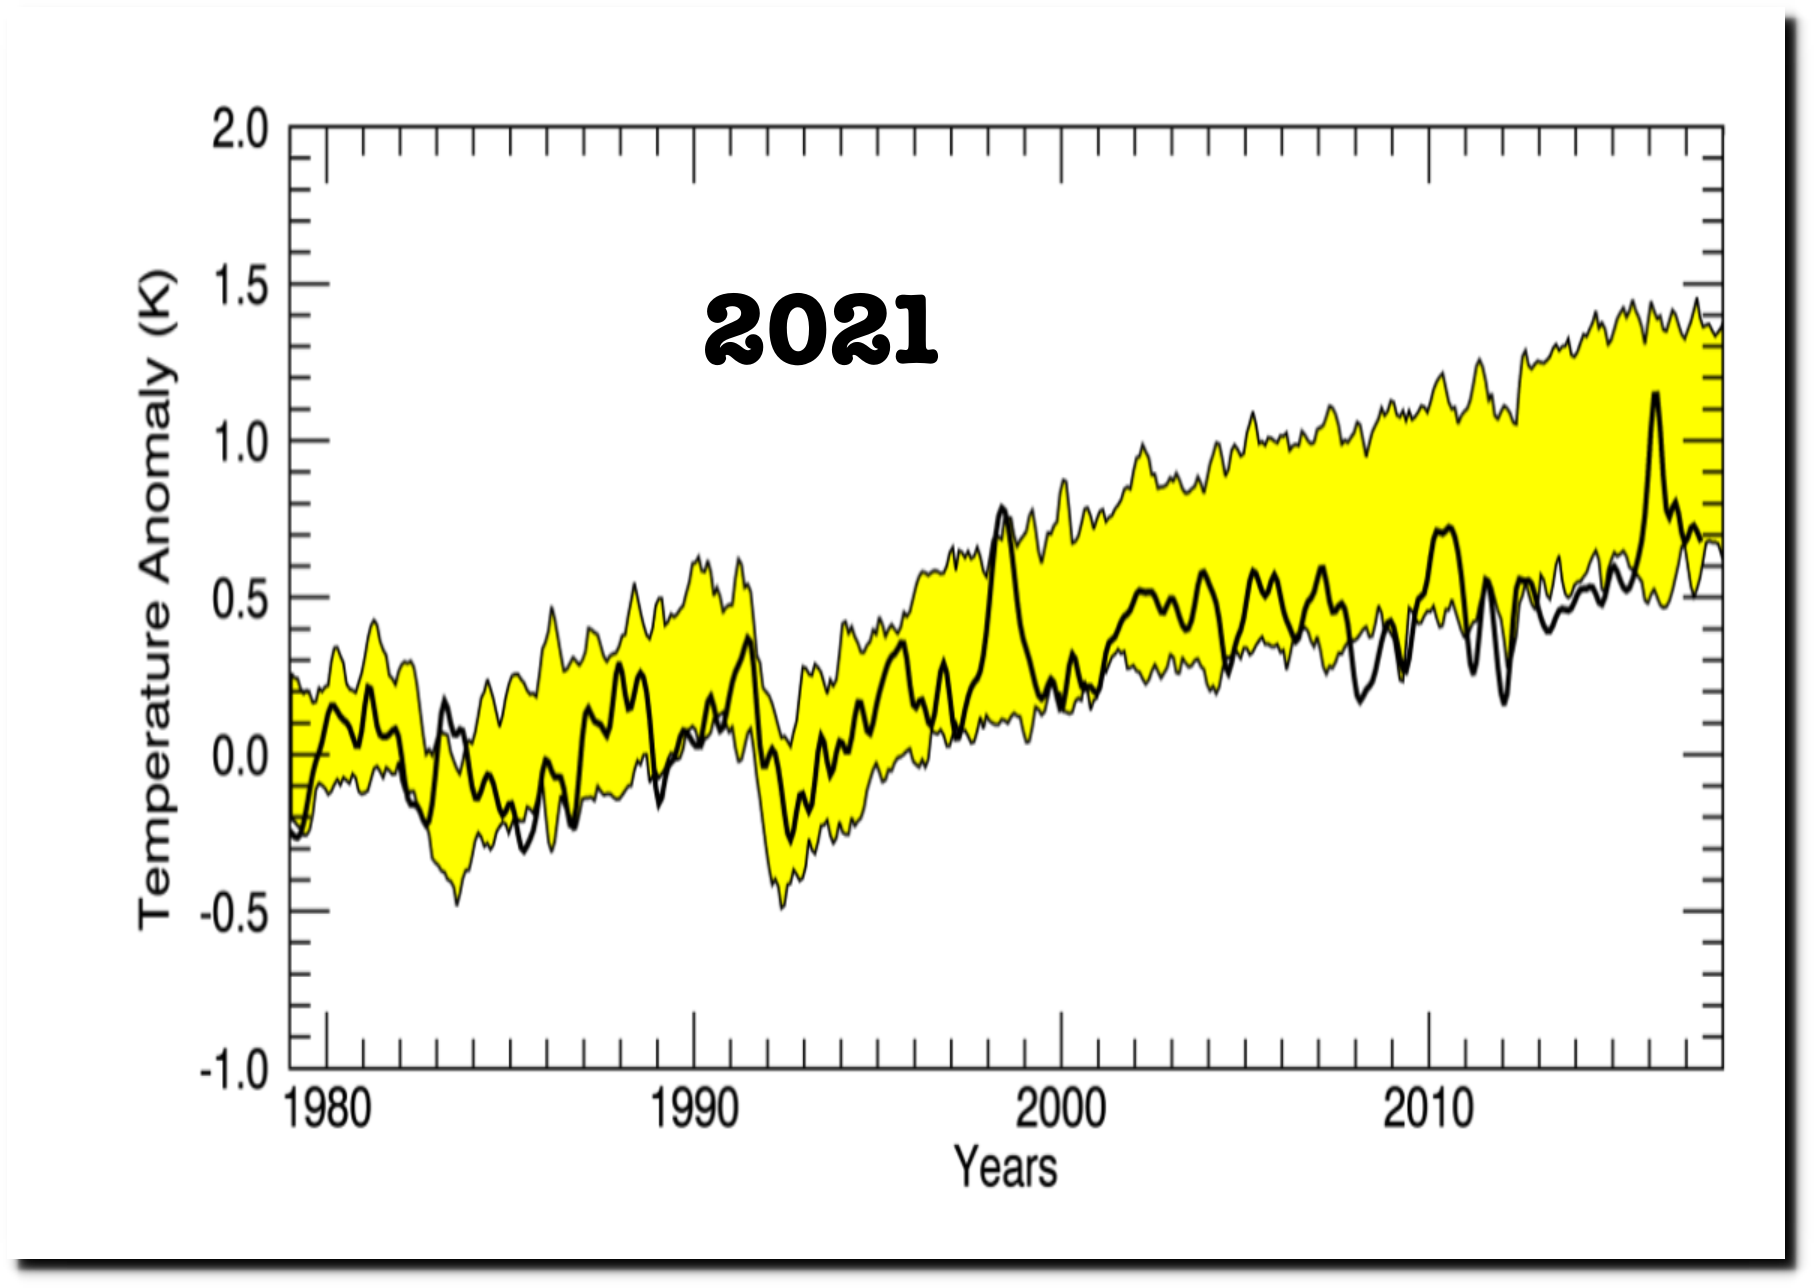
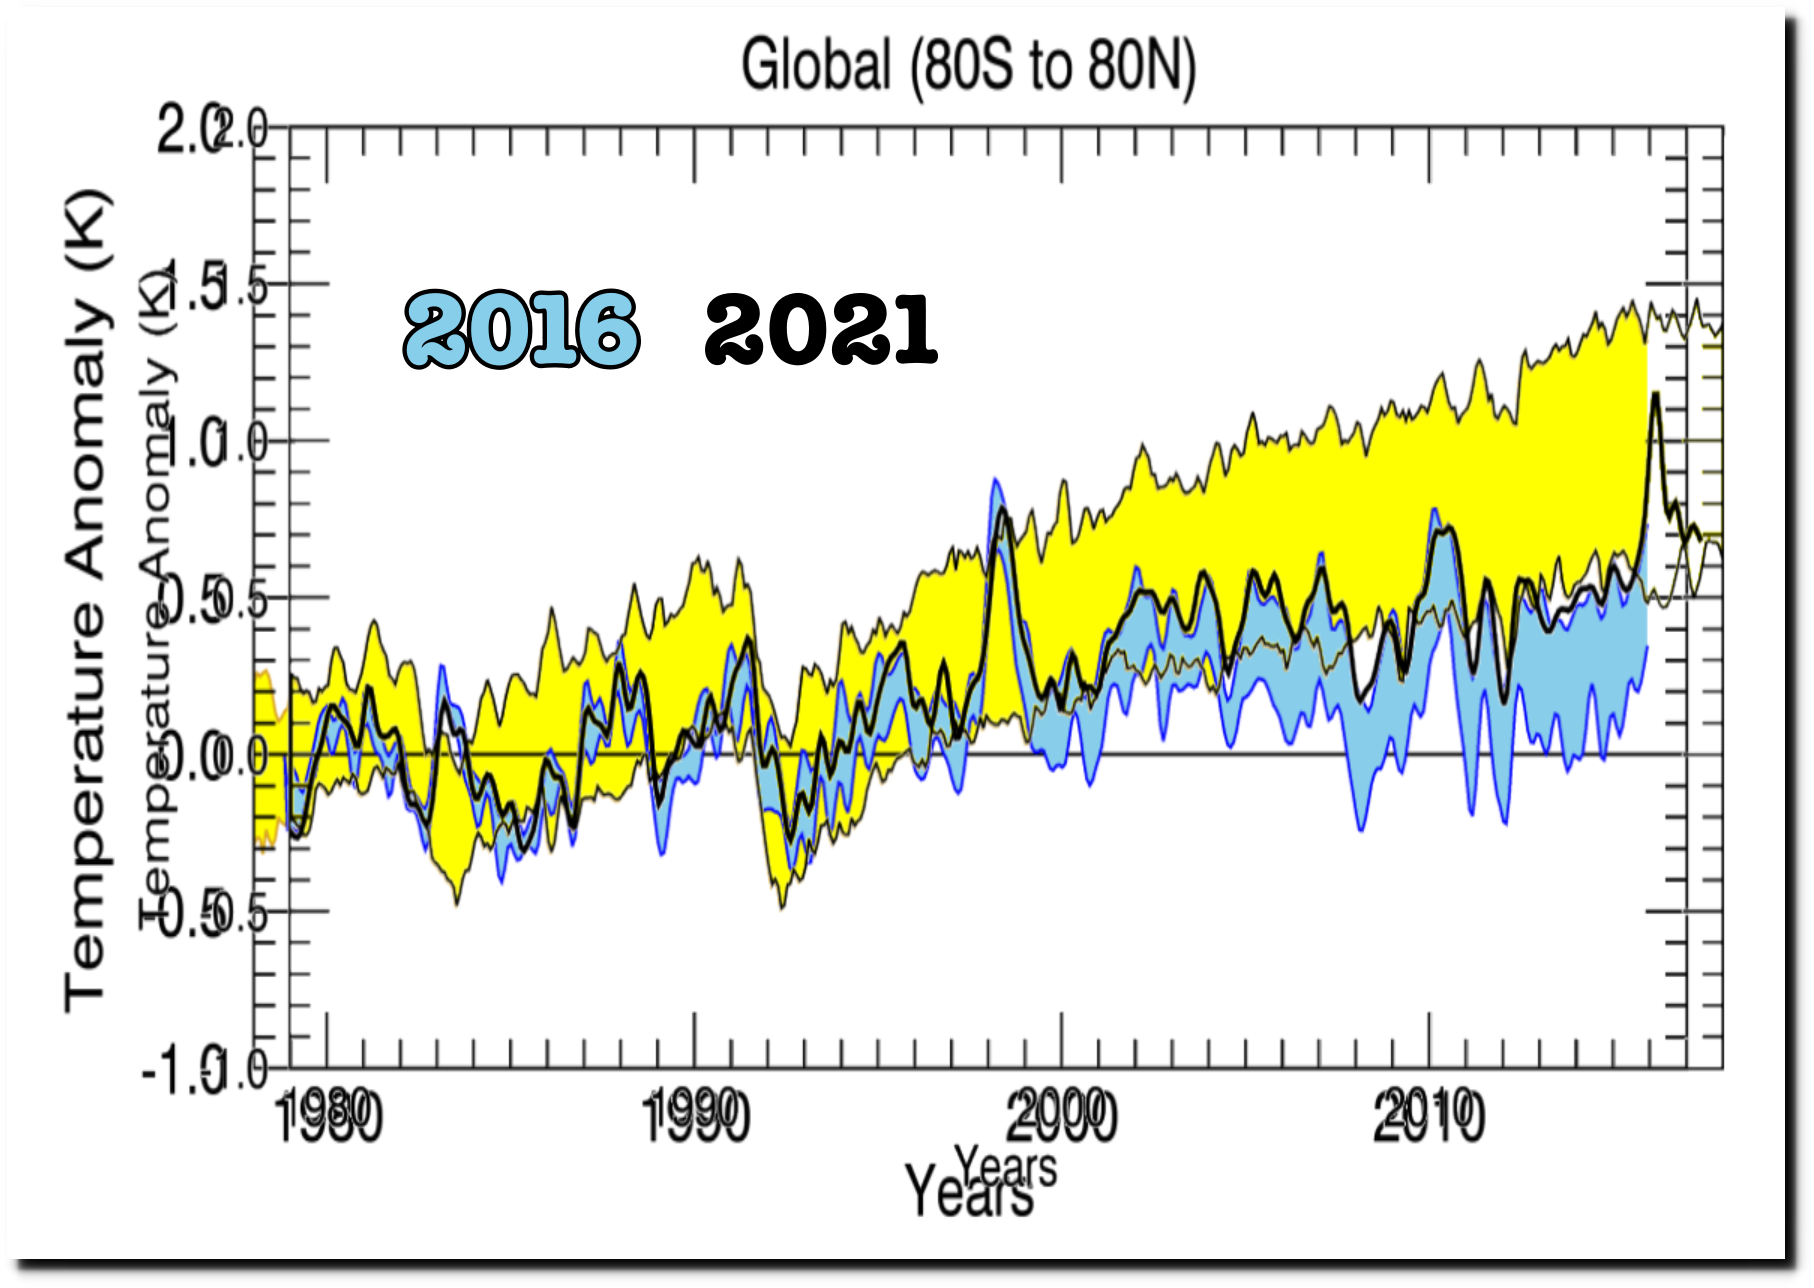
Rather than changing the data, Carl Mears changed the interpretation of the data. After 2016 he removed the blue error range and used the upper bounds of the error rather than midrange of the error.
Note that after 1998, the observations are likely to be below the simulated values, indicating that the simulation as a whole are predicting too much warming.
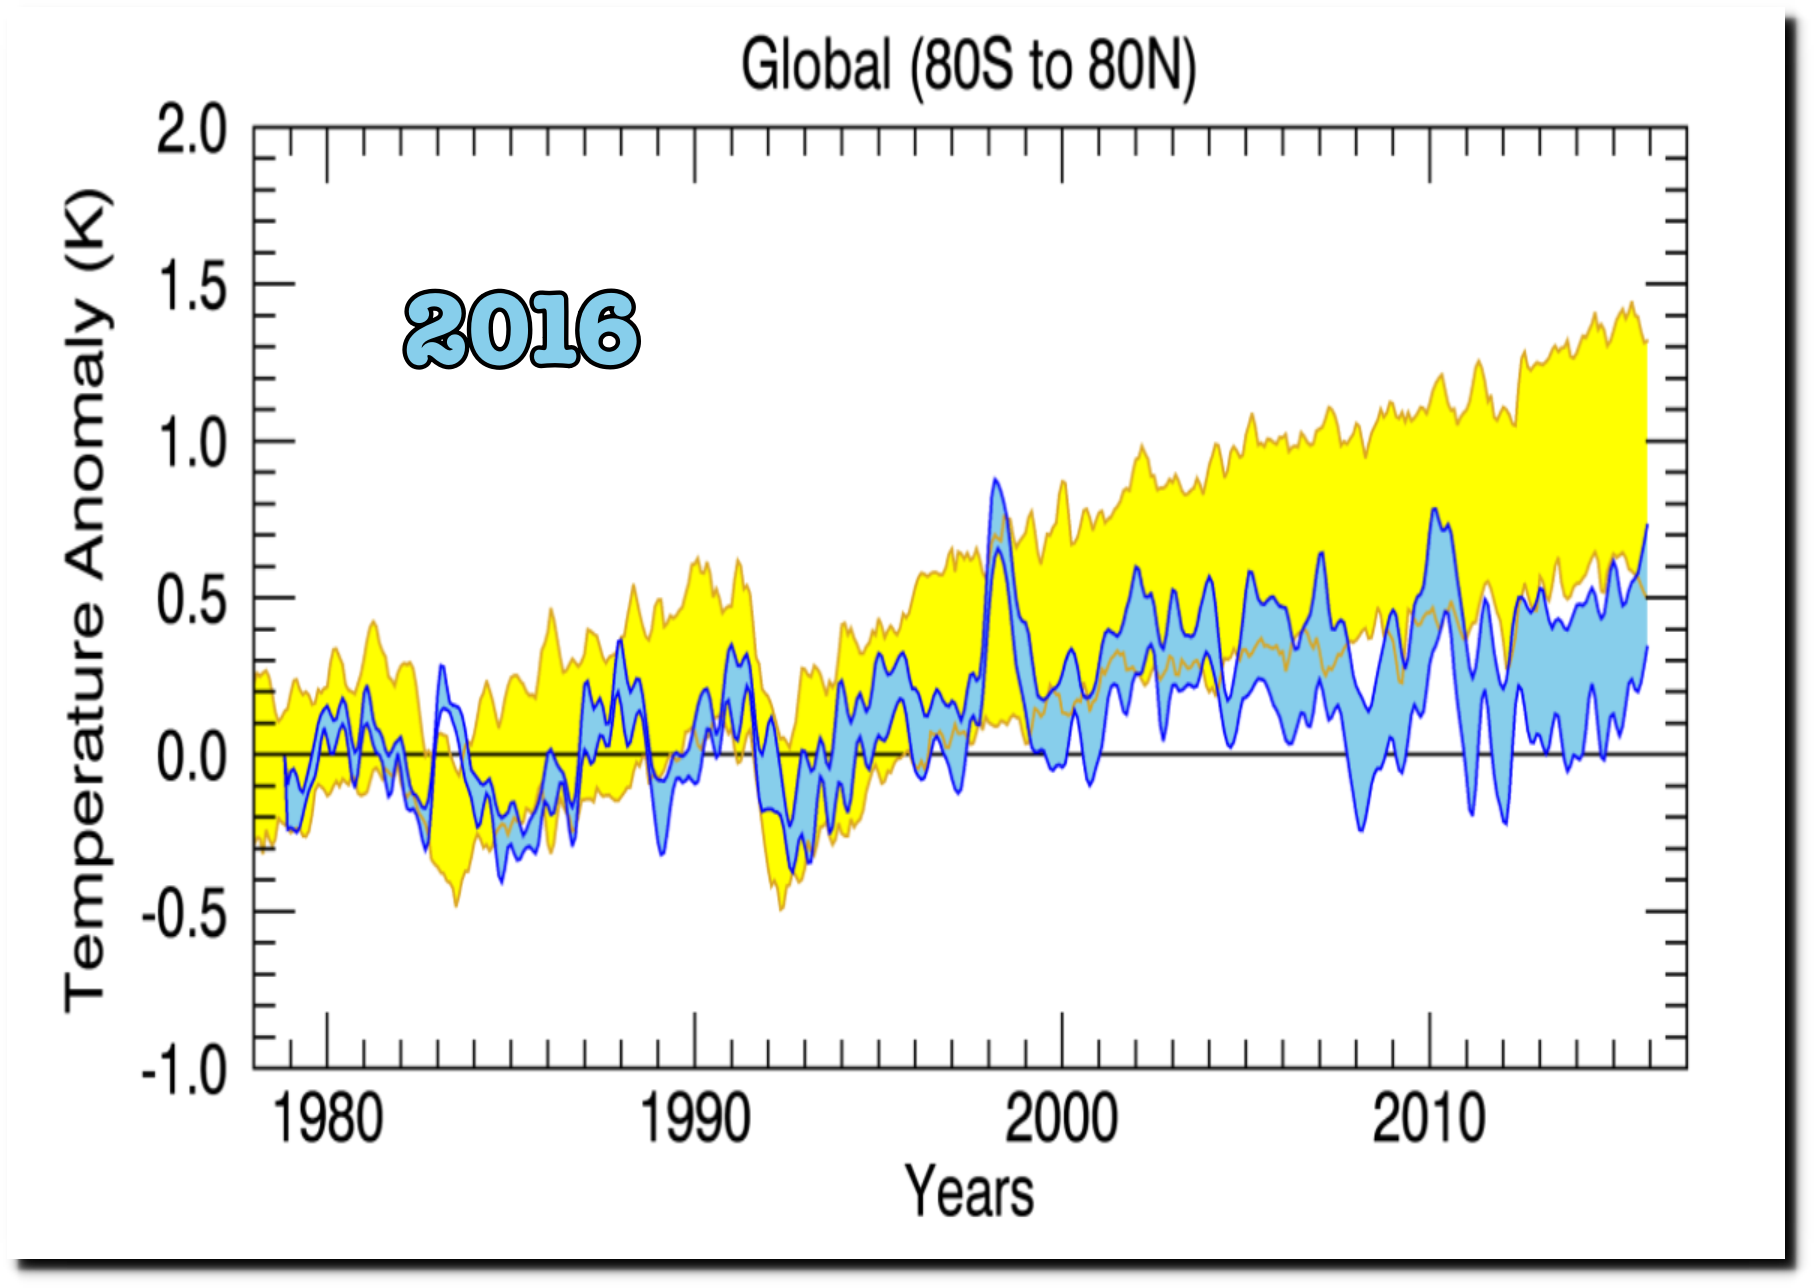
Climate Analysis | Remote Sensing Systems
He also changed the wording and misspelled satellite.
“Note that after 1998, the observations are likely to be in the lower part of the model distribution, indicating that there is a small discrepancy between the model predictions and the satelllite observations”
I predicted this would happen on March 27, 2015.
Look for the satellite data to be adjusted to bring it into compliance with the fully fraudulent surface temperatures. The Guardian is now working to discredit UAH, so it seems likely that RSS will soon be making big changes – to match the needs of the climate mafia. Bookmark this post.
I made this prediction because Ted Cruz used an RSS graph in a Senate hearing in March of 2015. Carl Mears at RSS then came under intense pressure to make his data match the surface temperature data.
My particular dataset (RSS tropospheric temperatures from MSU/AMSU satellites) show less warming than would be expected when compared to the surface temperatures. All datasets contain errors. In this case, I would trust the surface data a little more because the difference between the long term trends in the various surface datasets (NOAA, NASA GISS, HADCRUT, Berkeley etc) are closer to each other than the long term trends from the different satellite datasets. This suggests that the satellite datasets contain more “structural uncertainty” than the surface dataset.
Ted Cruz says satellite data show the globe isn’t warming
Roy Spencer at UAH made the same prediction on January 9, 2017
“I expect there will soon be a revised TLT product from RSS which shows enhanced warming, too.
Here’s what I’m predicting:
1) neither John Christy nor I will be asked to review the paper
2) it will quickly sail through peer review (our UAH V6 paper is still not in print nearly 1 year after submission)
3) it will have many authors, including climate model people and the usual model pundits (e.g. Santer), which will supposedly lend legitimacy to the new data adjustments.
Let’s see how many of my 3 predictions come true.
-Roy”

Posted in Uncategorized
Leave a comment
New York Times 1992 – MWP And LIA Were Global
In 1992, the New York Times said there was no indication of global warming and that the MWP and LIA were global.
Warming? Tree Rings Say Not Yet
Lisa J. Graumlich, who examines the ring patterns of foxtail pine trees and western junipers in the Sierra Nevada, has compiled a detailed record of the year-to-year variation in temperature and precipitation over the last thousand years.
She has seen in the North American trees the feathery but unmistakable signatures of the Medieval Warm Period, a era from 1100 to 1375 A.D. when, according to European writers of the time and other sources, the climate was so balmy that wine grapes flourished in Britain and the Vikings farmed the now-frozen expanse of Greenland; and the Little Ice Age, a stretch of abnormally frigid weather lasting roughly from 1450 to 1850. A Crucial Question
“We can now see that these were global climate phenomena, not regional temperature variations,” she said. “The question is, how did we get those warmer temperatures during pre-industrial times, and what can we learn from those conditions about what is going on today?”
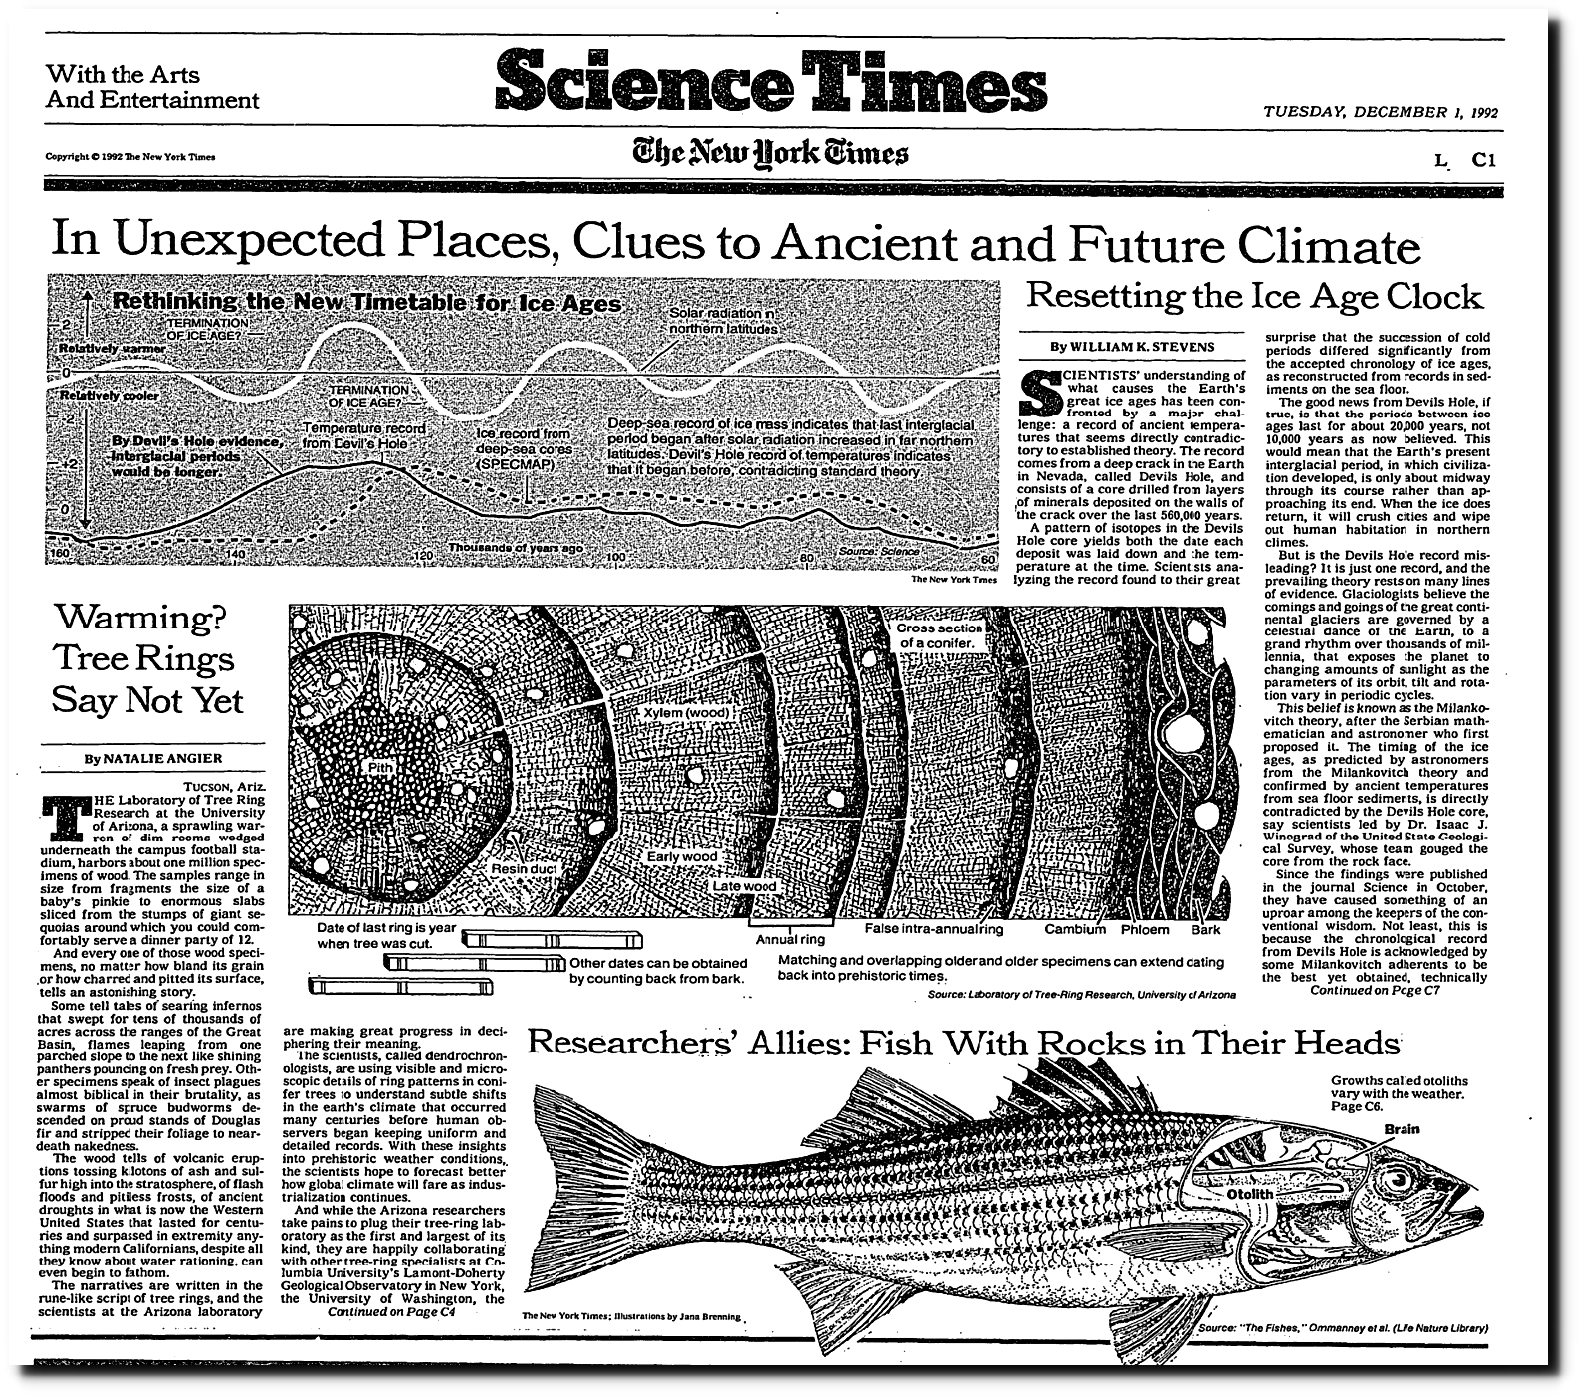

This was consistent with the 1990 IPCC Report.
Posted in Uncategorized
Leave a comment
Down The Rabbit Hole
Another breathless headline : “Climate Change Has Cut Global Agricultural Productivity by 21% Since 1961”
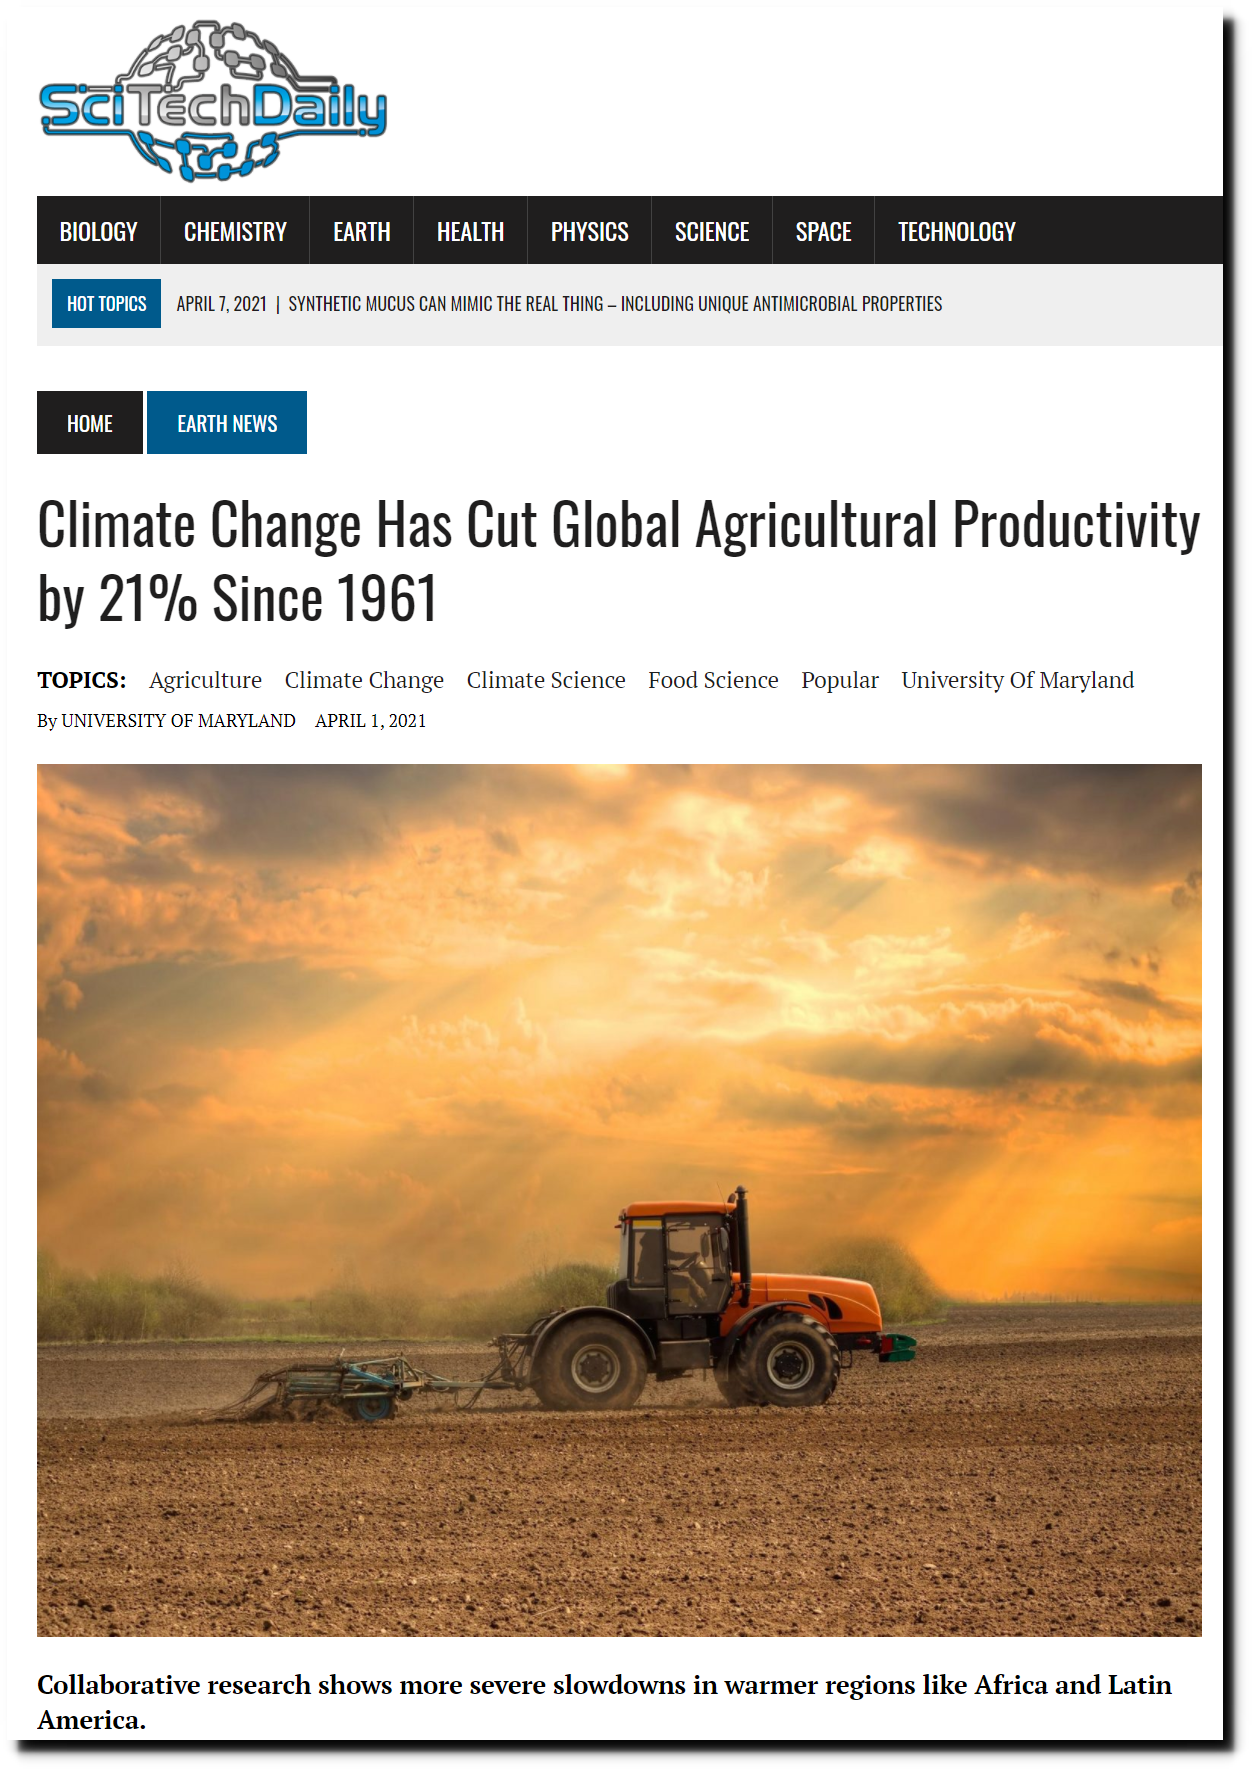
Climate Change Has Cut Global Agricultural Productivity by 21% Since 1961
The exact opposite is true. Crop yields across the world, South America and Africa increased dramatically since 1961.
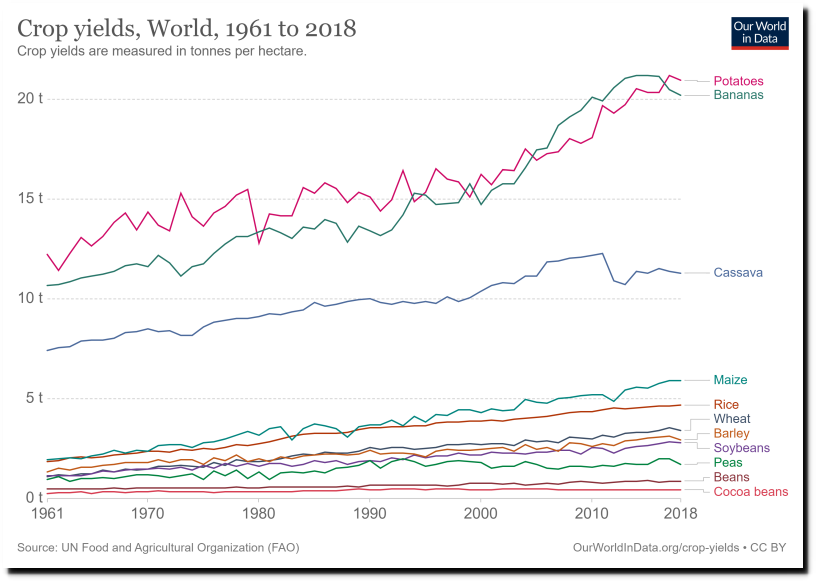
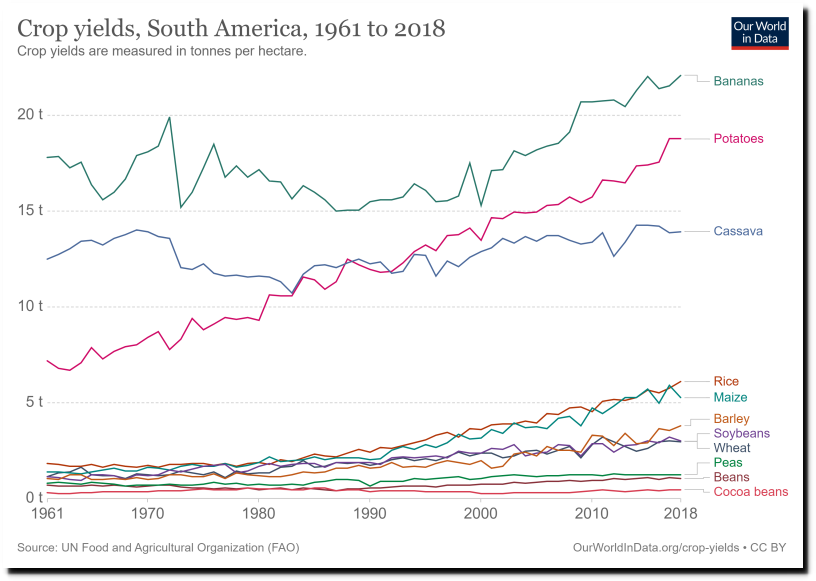
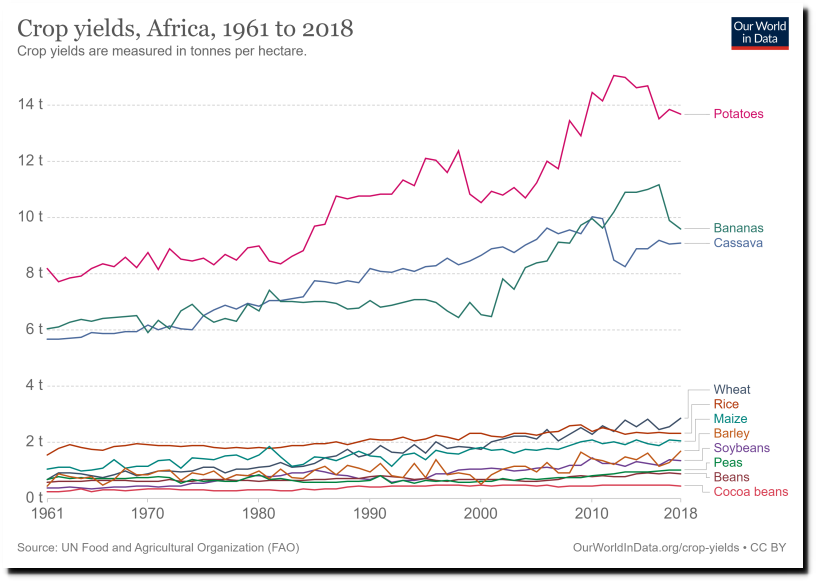
Crop Yields – Our World in Data
Hunger has declined sharply.
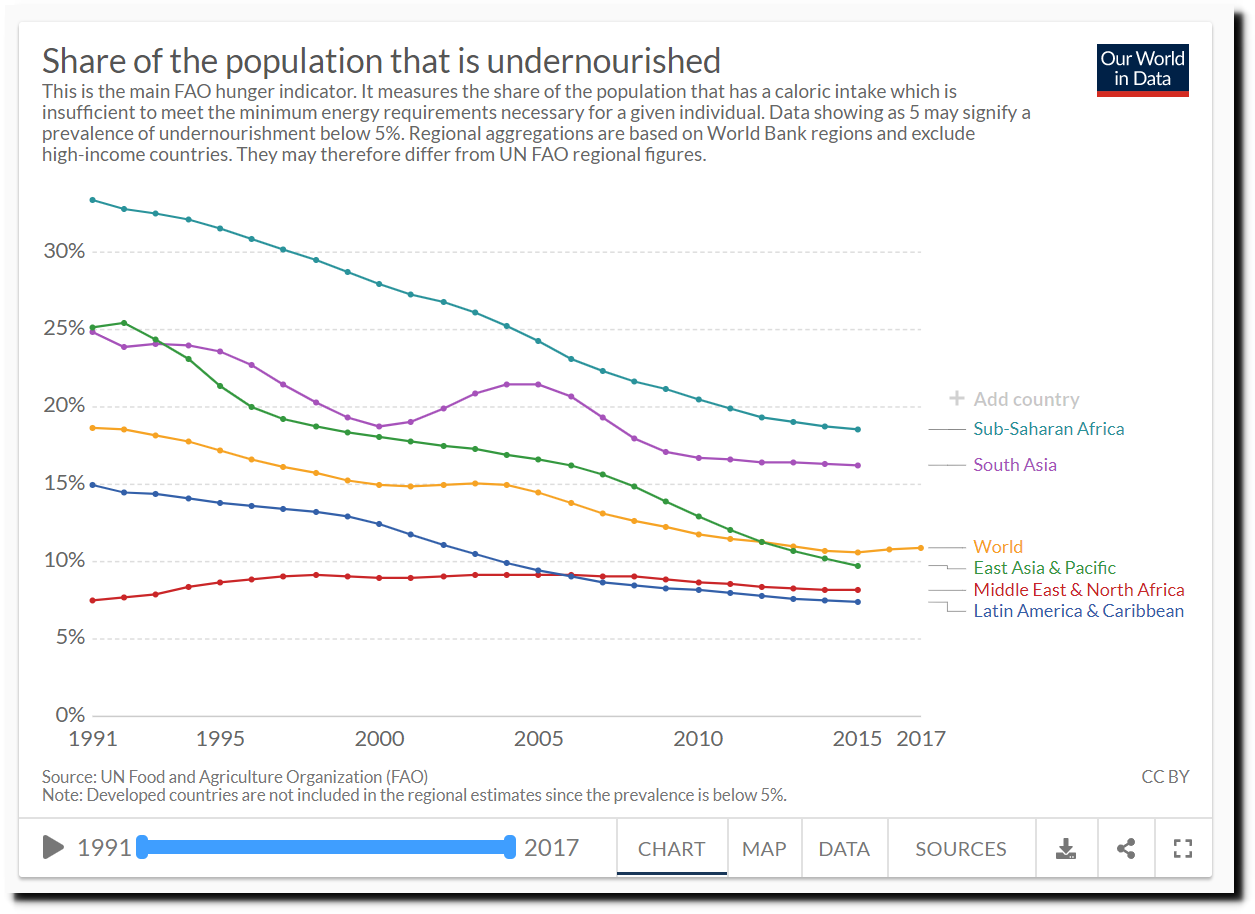
Hunger and Undernourishment – Our World in Data
Poverty has declined sharply.
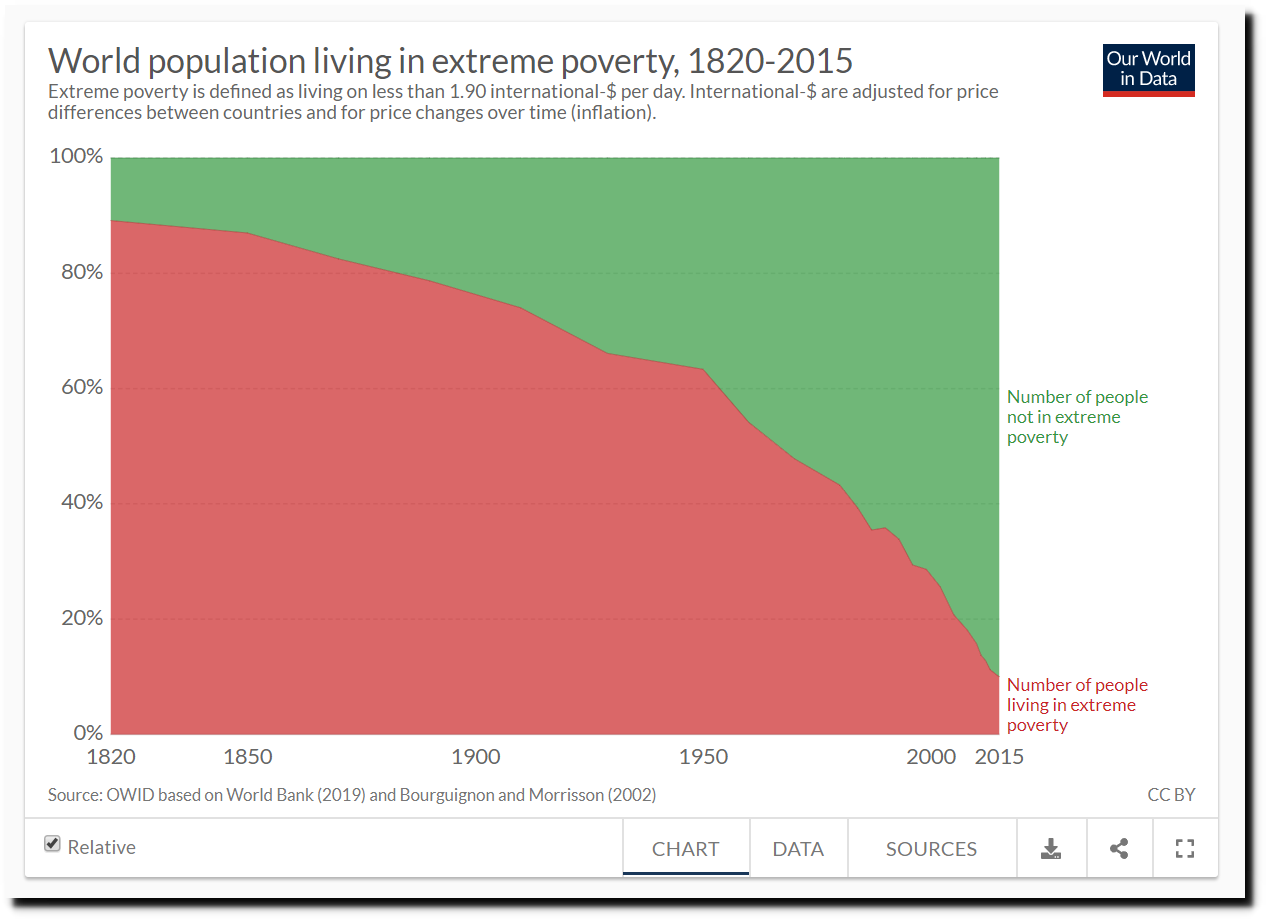
The short history of global living conditions and why it matters that we know it – Our World in Data
Illiteracy has declined sharply.

Global Rise of Education – Our World in Data
Life expectancy has increased sharply.
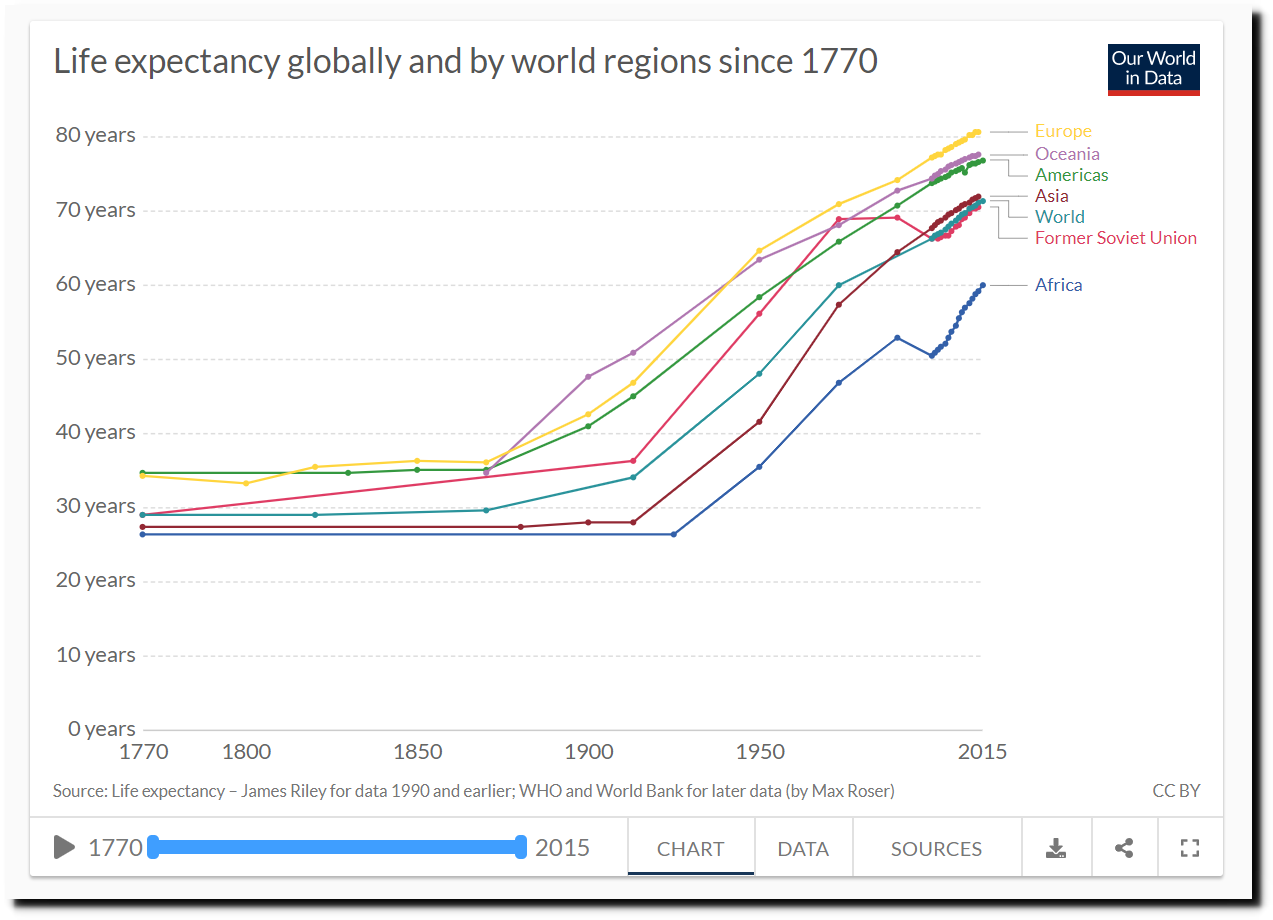
Life Expectancy – Our World in Data
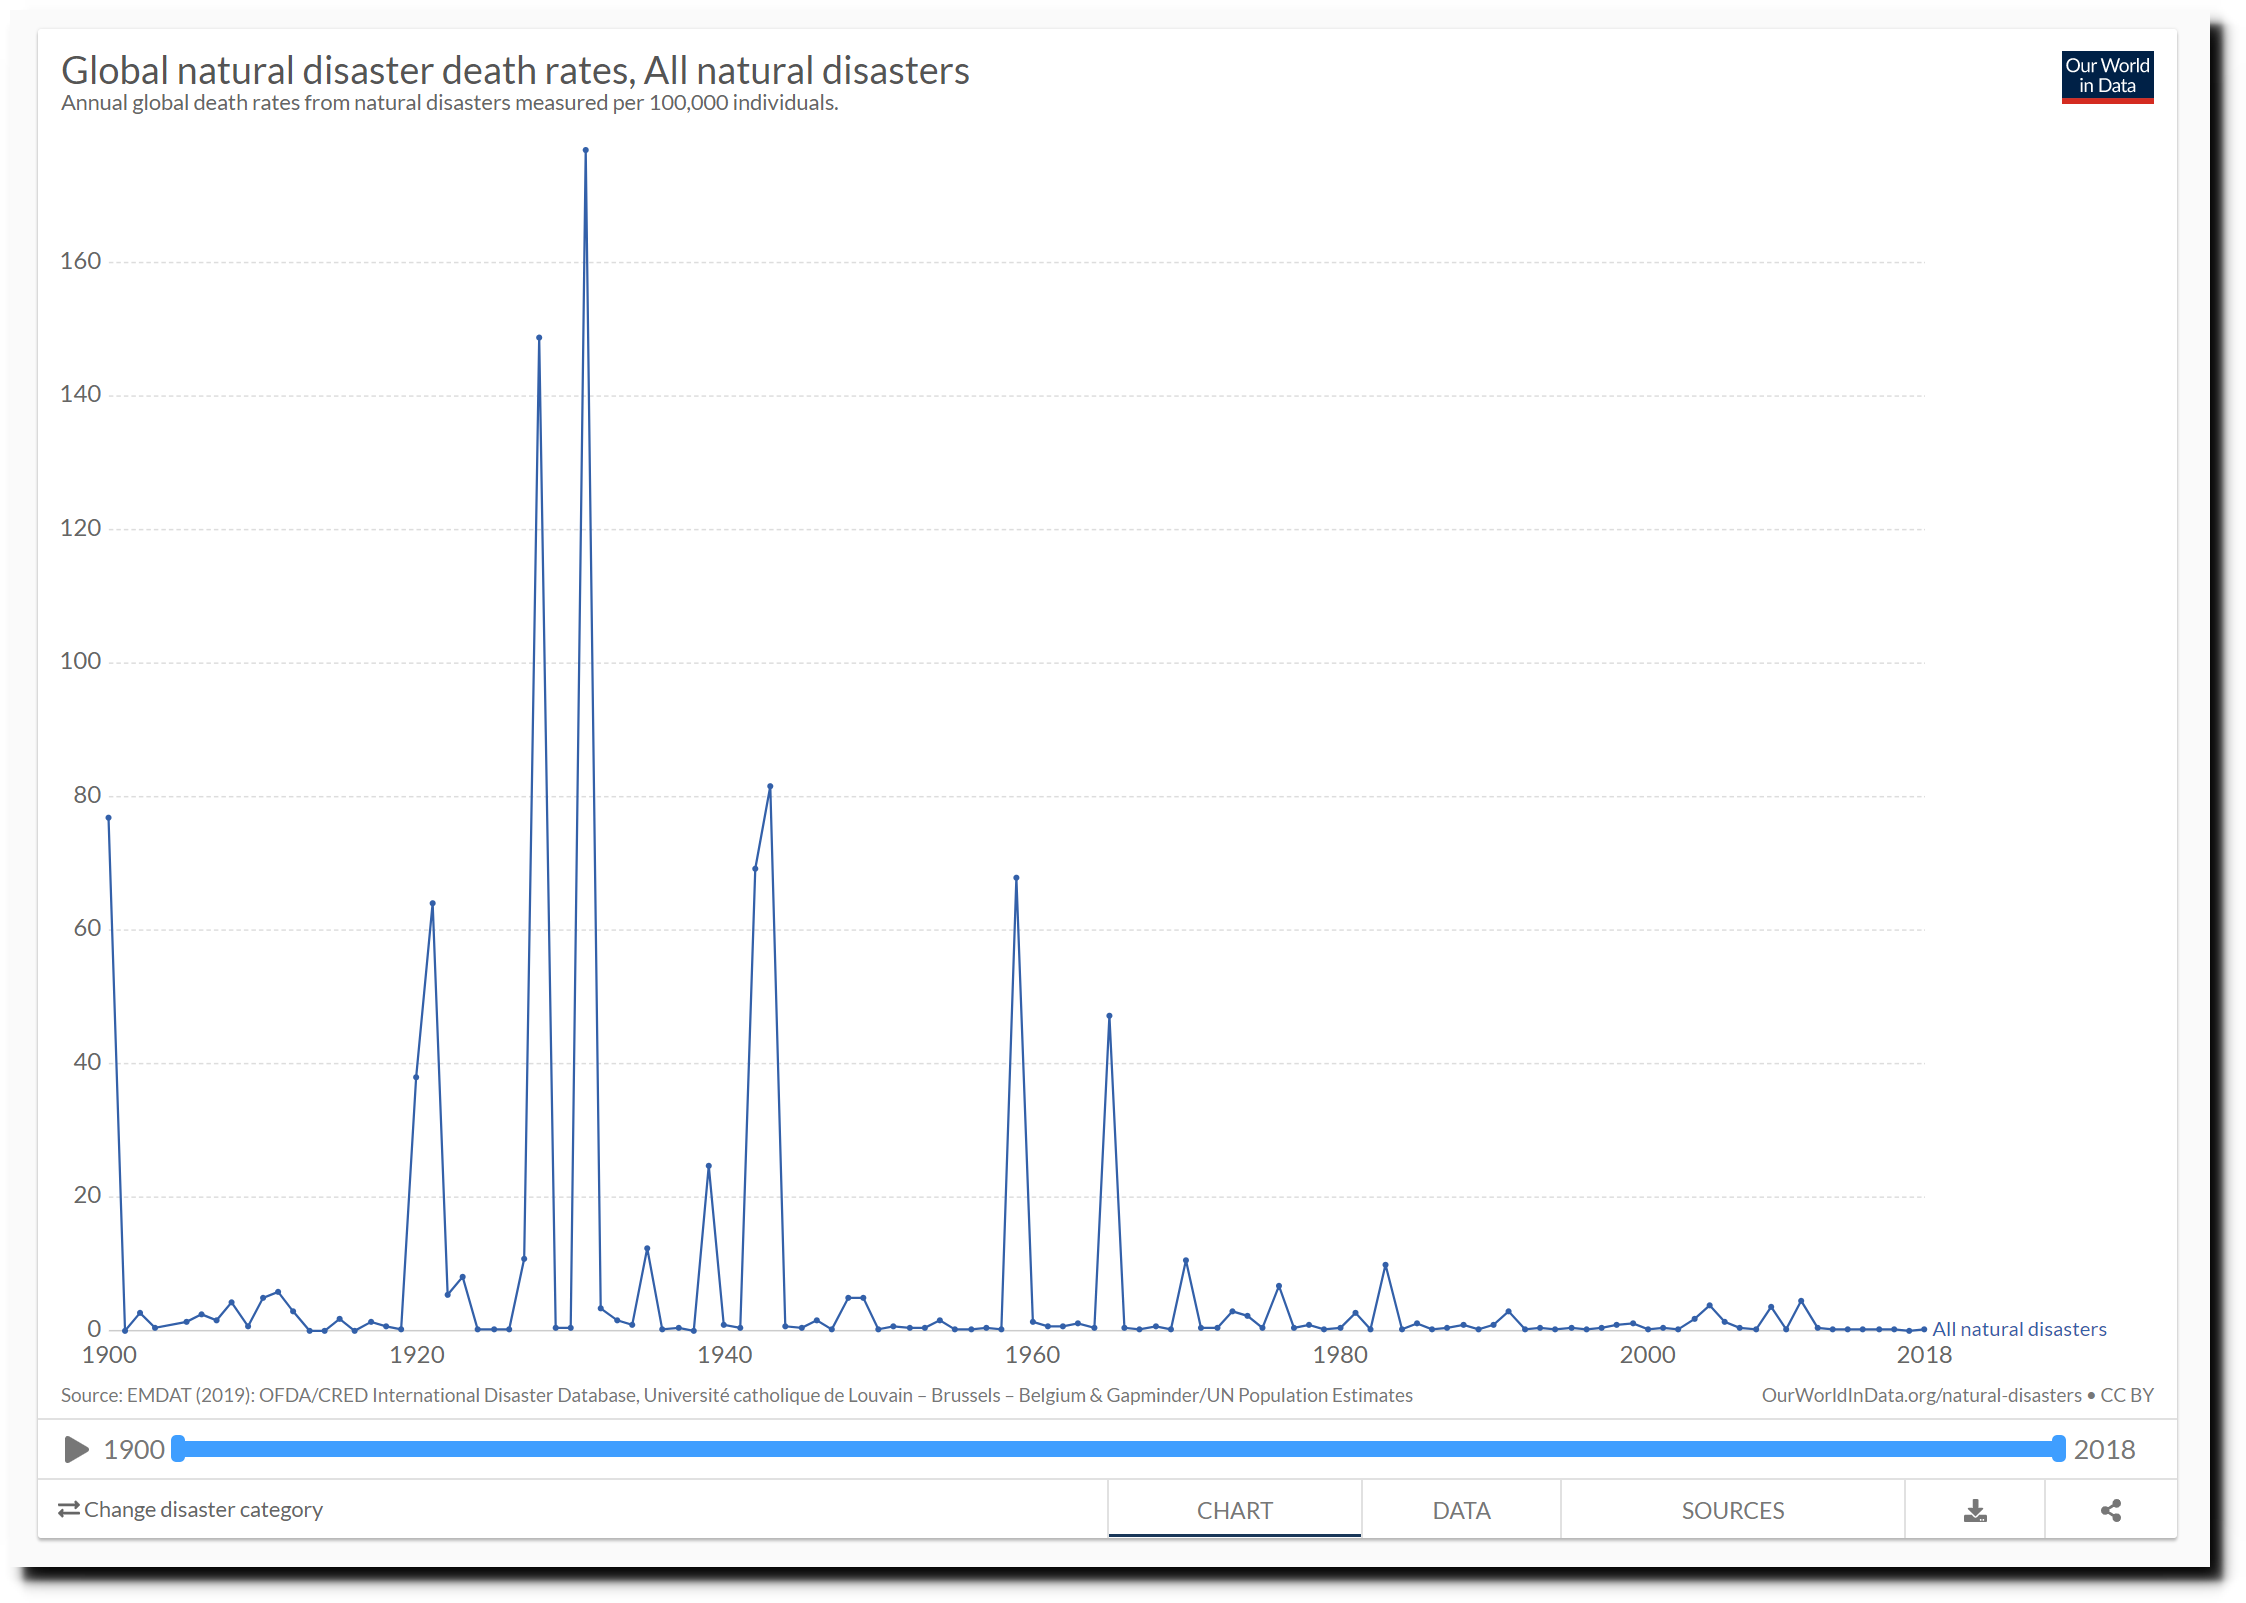
And as CO2 has risen, deaths from natural disasters have plummeted.
Posted in Uncategorized
Leave a comment
World Economic Forum Wants The Little People Locked Up In Their Homes

Posted in Uncategorized
Leave a comment
Are Government Temperature Graphs Credible?
Ninety years ago, the New York Times reported unanimous consensus that Earth’s climate was controlled by the sun.
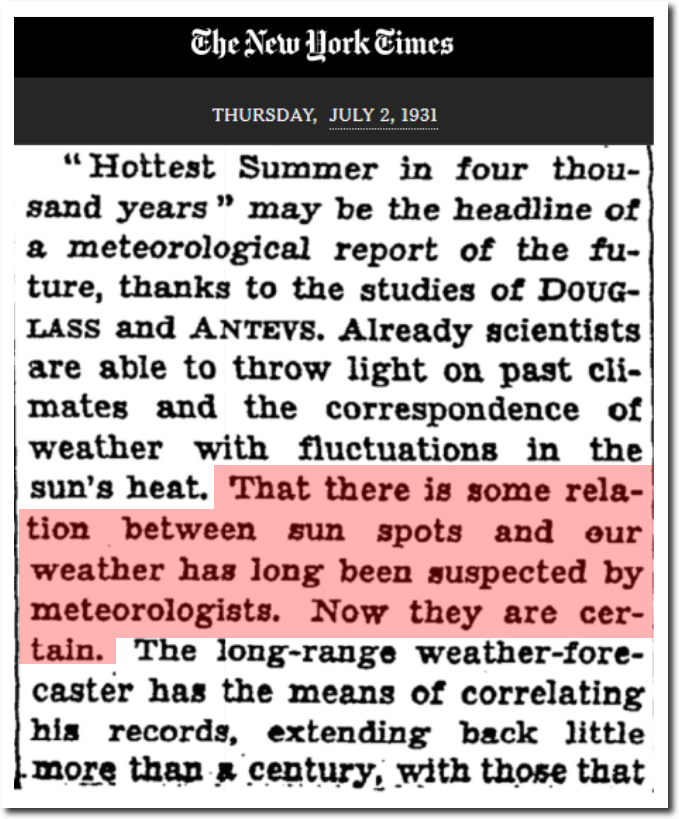
TimesMachine: July 2, 1931 – NYTimes.com
Now NASA reports 97% consensus that Earth’s climate is controlled by CO2.
“Multiple studies published in peer-reviewed scientific journals show that 97 percent or more of actively publishing climate scientists agree*: Climate-warming trends over the past century are extremely likely due to human activities.”

Scientific Consensus | Facts – Climate Change: Vital Signs of the Planet
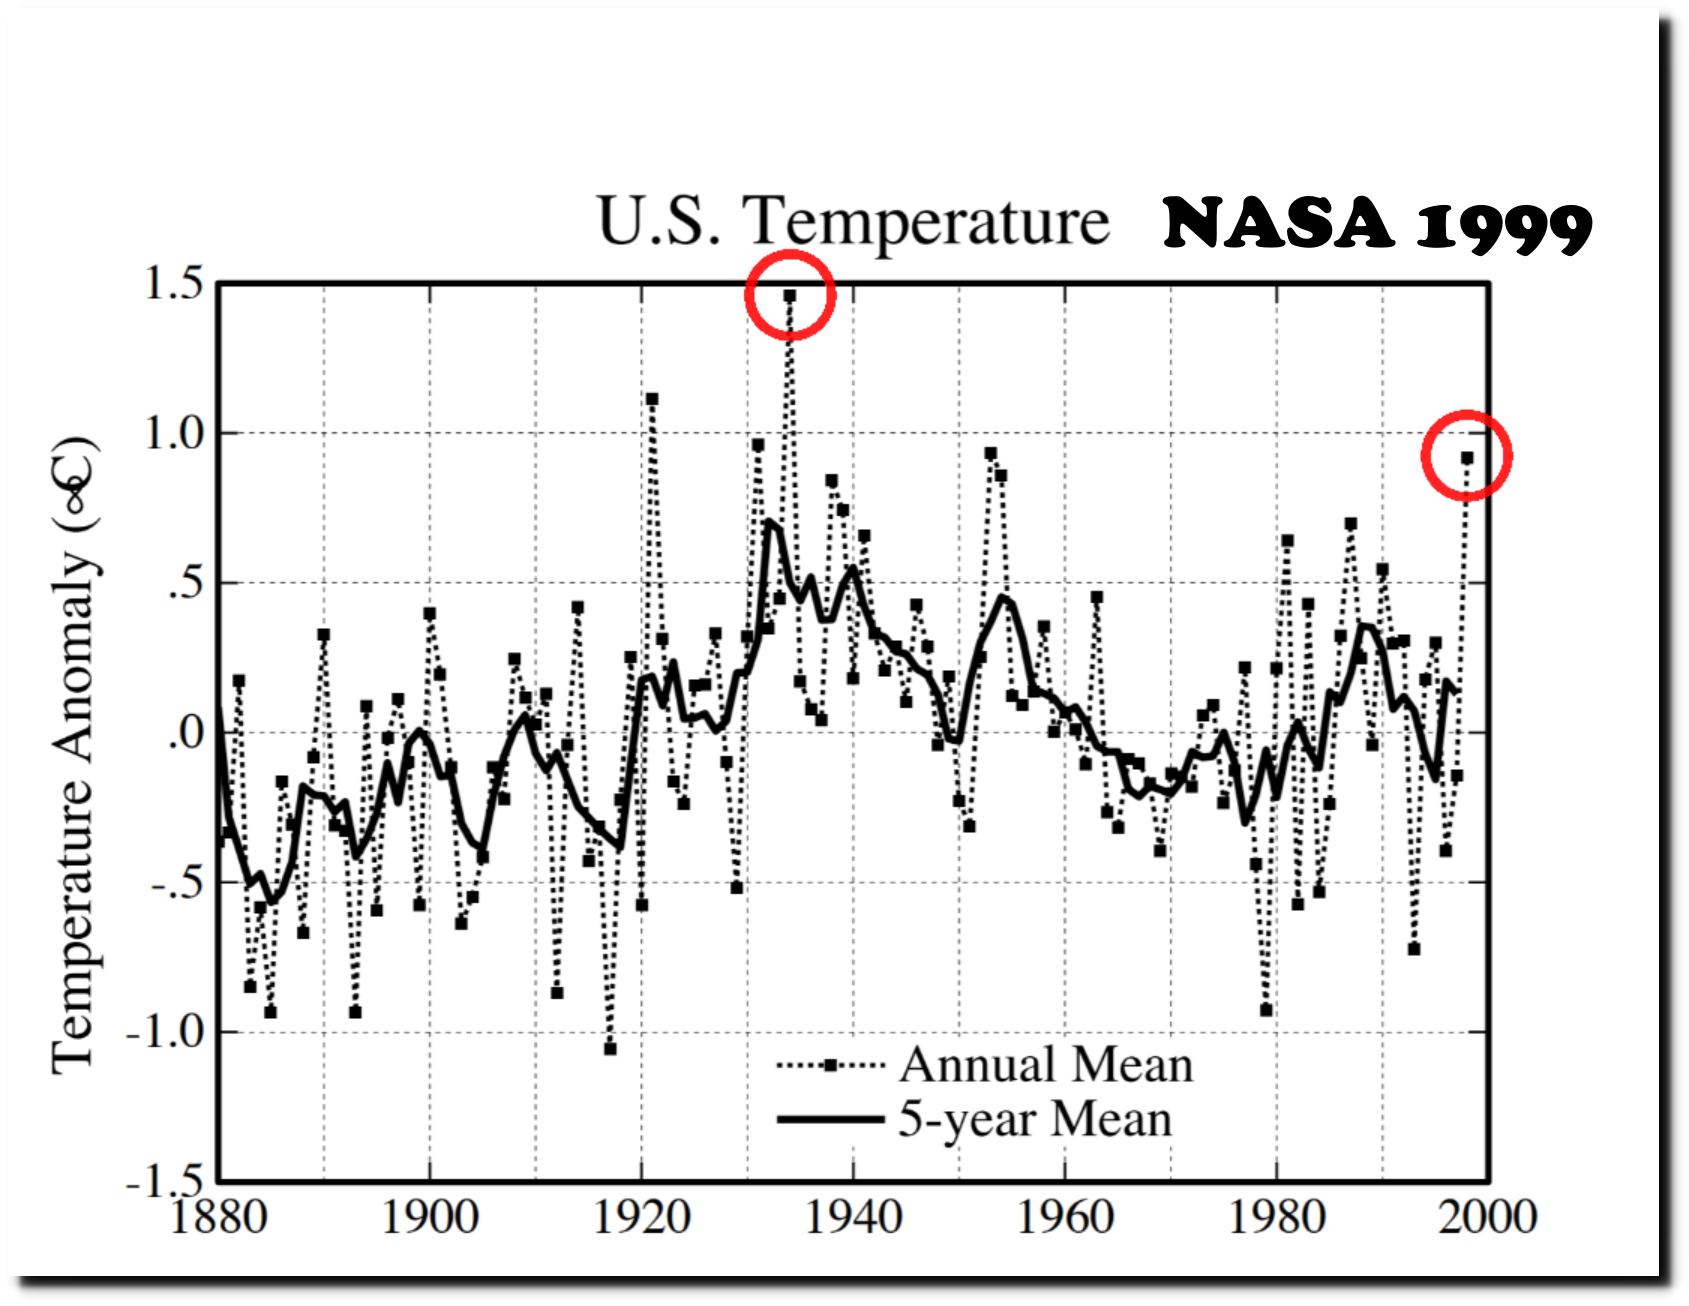
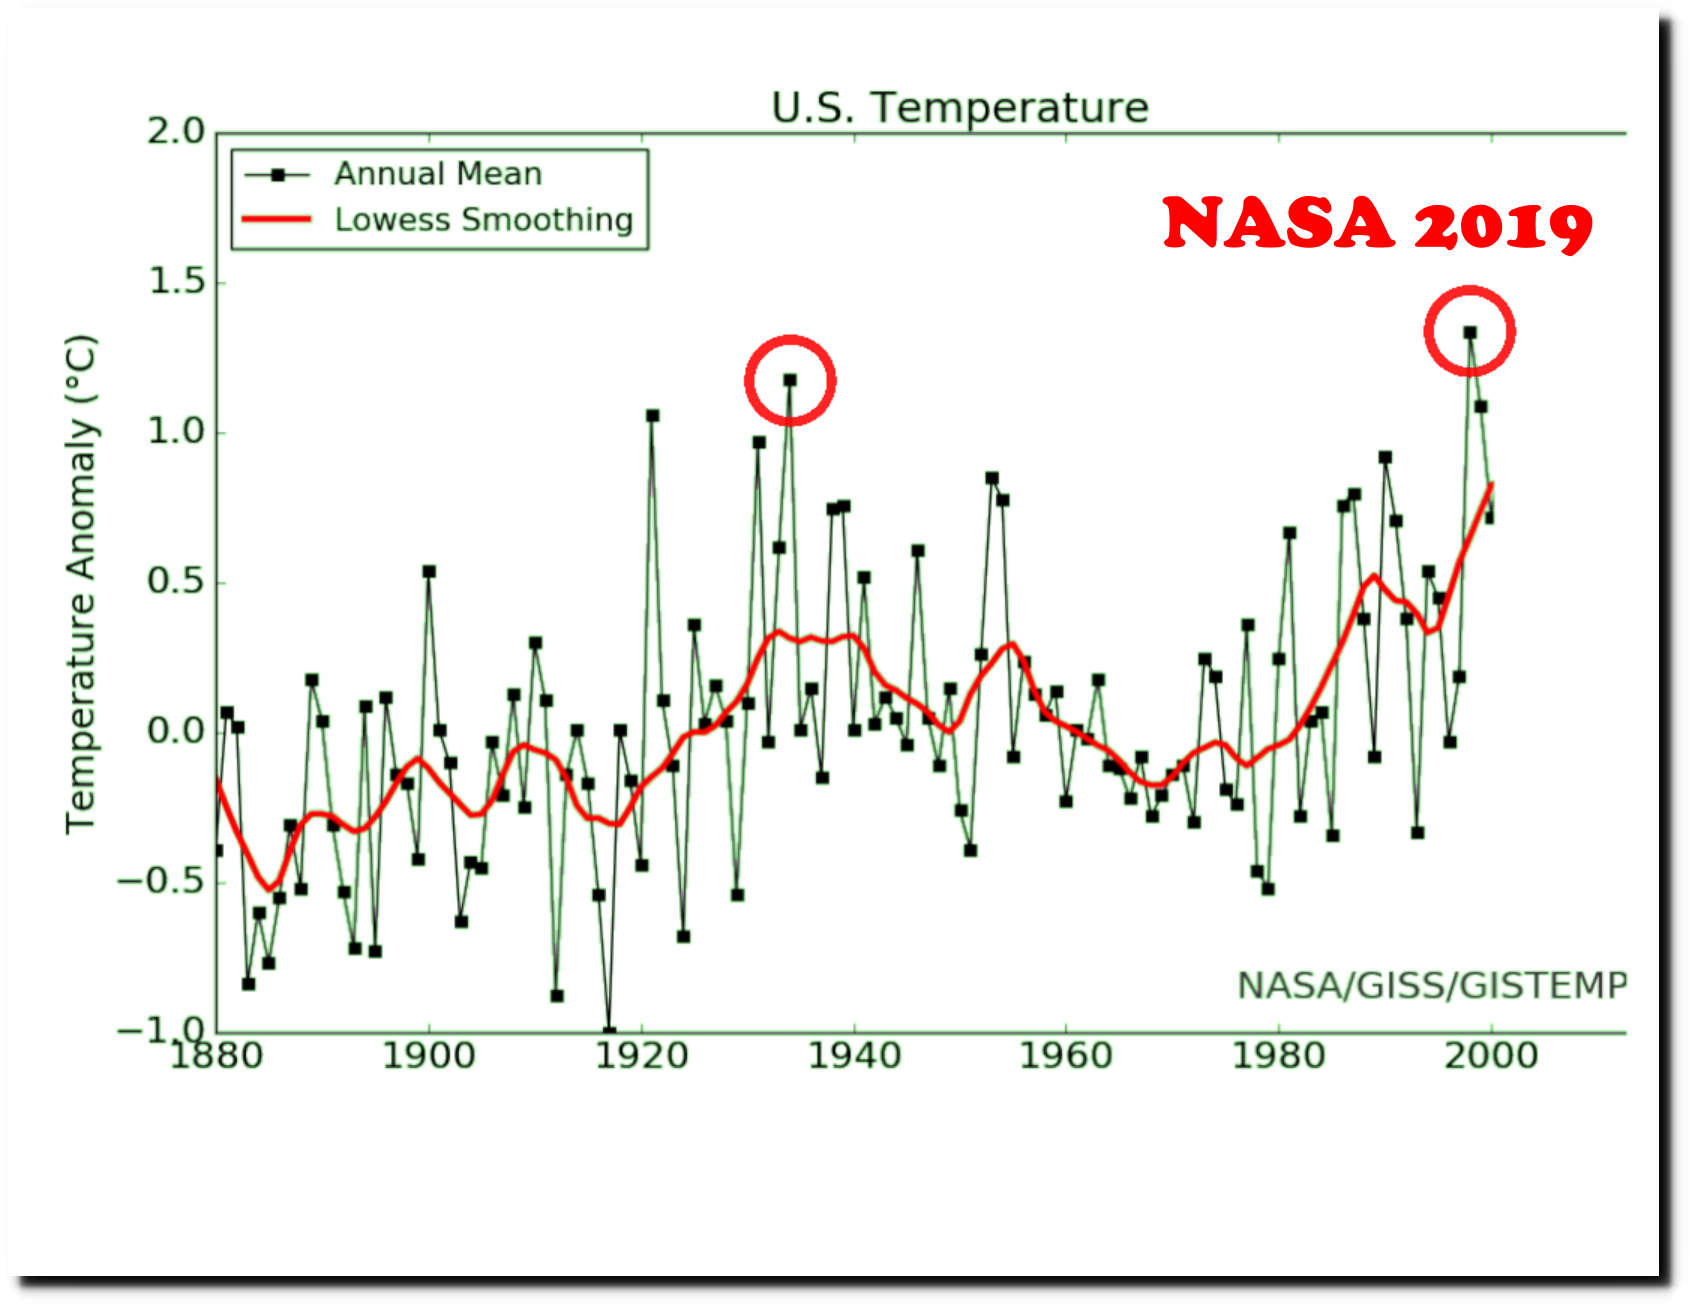
I agree with them – the warming trends over the last century are primarily due to human activities – data tampering by organizations like NASA and NOAA. For example, over the past 20 years NASA has turned a 70 year cooling trend in the US from 1930 to 2000 into a warming trend. This is the 1999 version.
And this is NASA’s current graph.
Here is an animation showing how the data has been altered over the past 20 years.
The US temperature record is very important, because the vast majority of global stations in the NOAA GHCN database with a long term daily temperature record are located in the US.
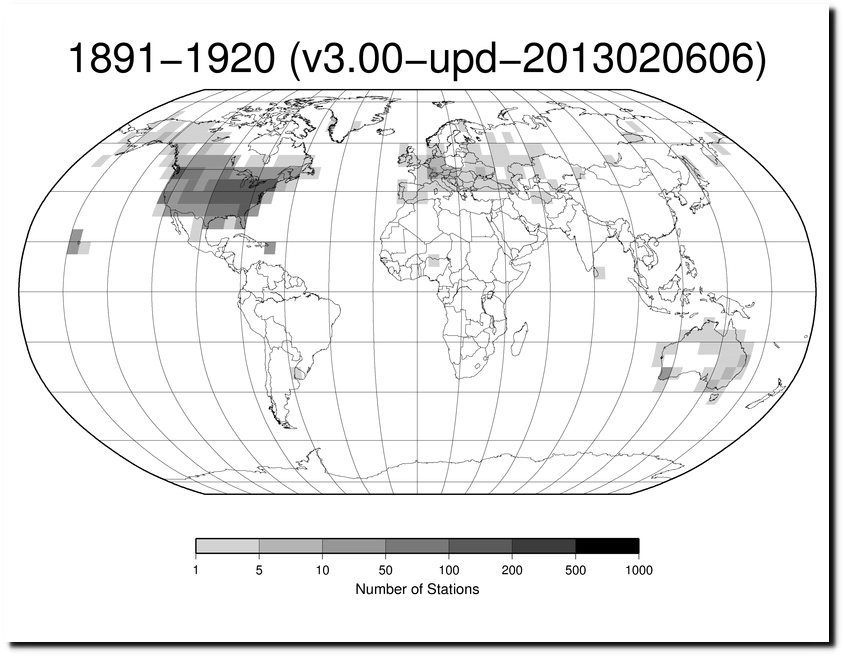
station-counts-1891-1920-temp.png
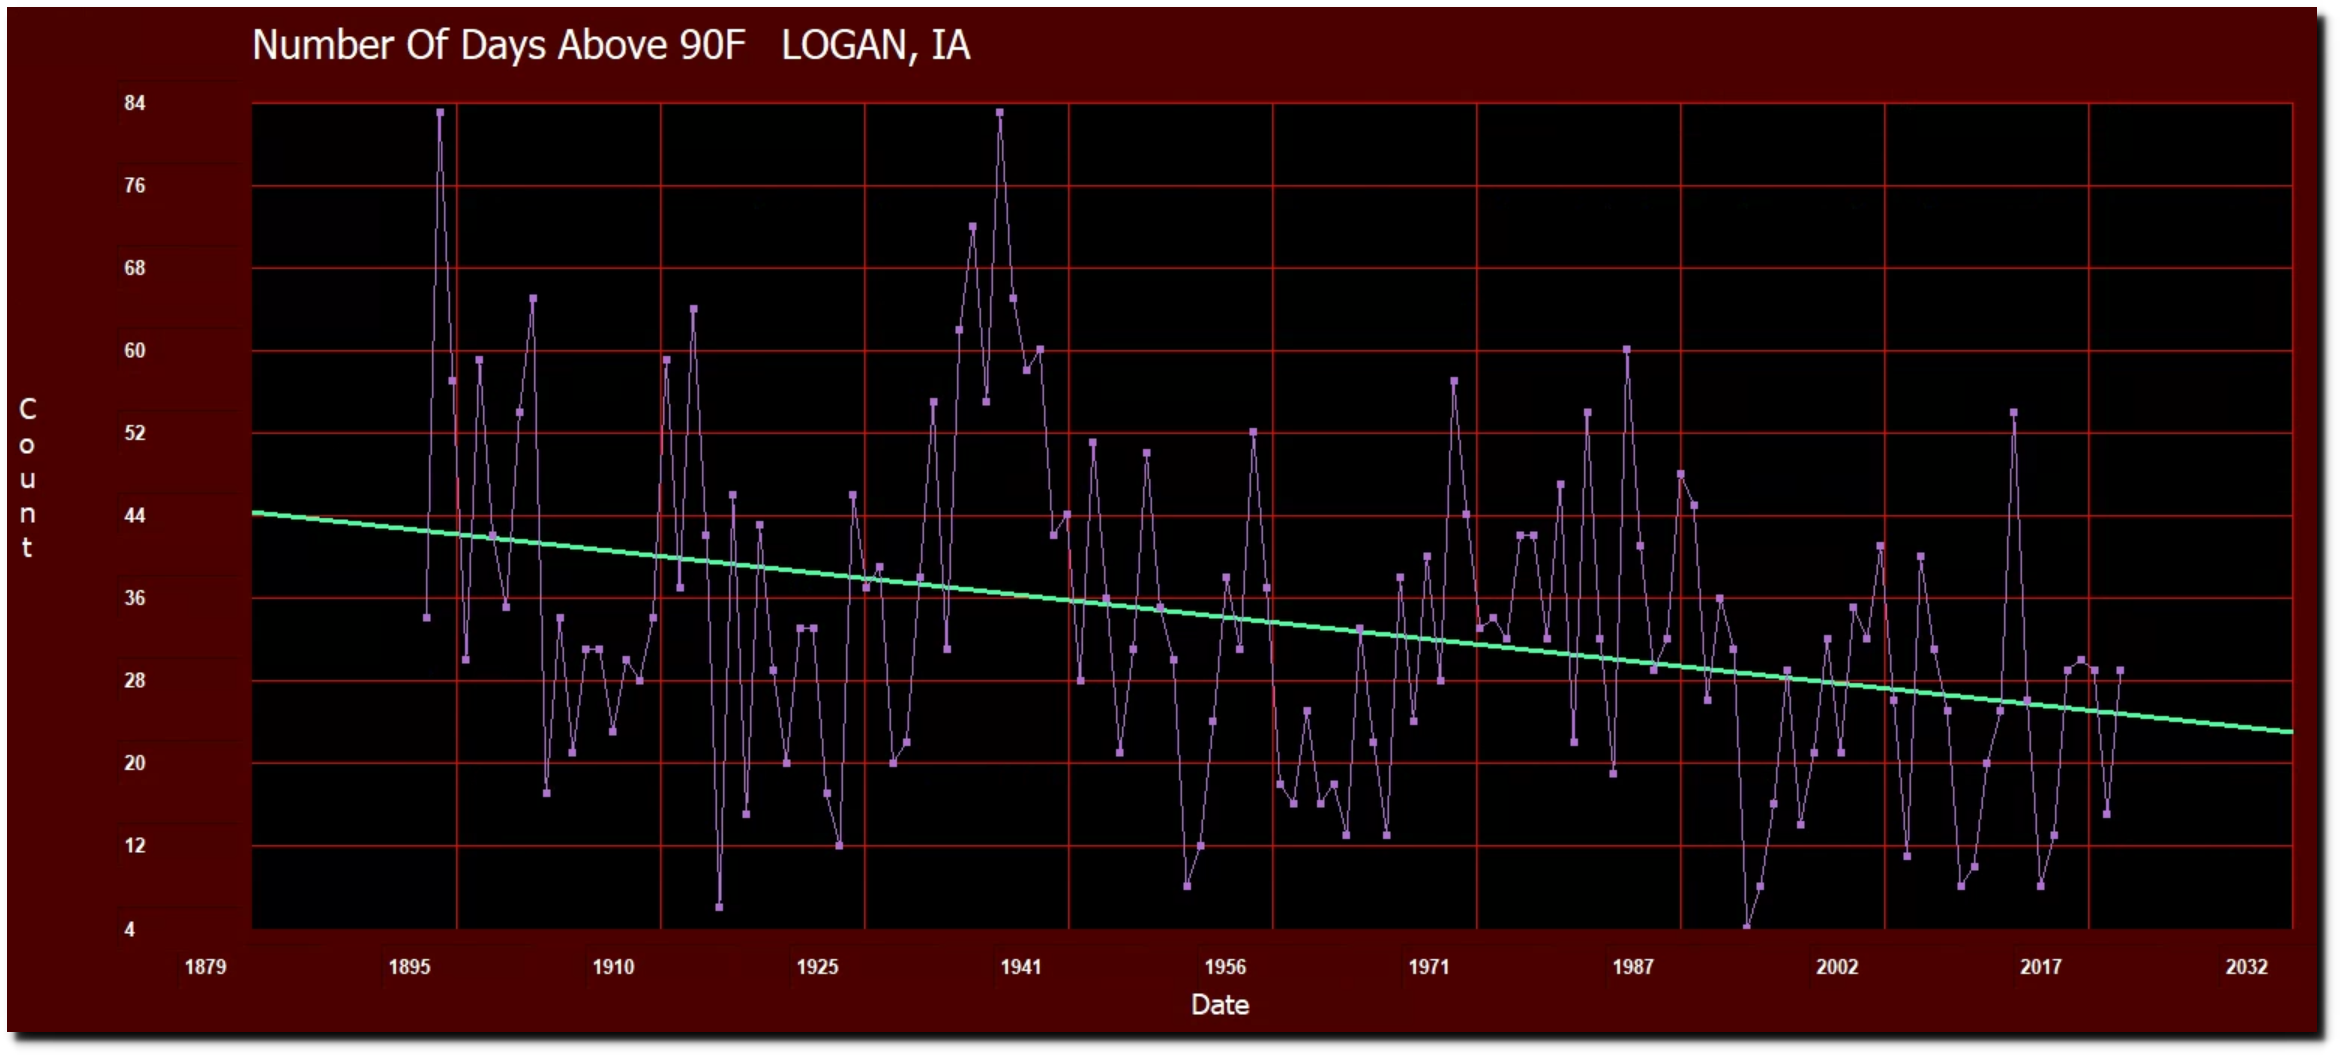
In 1986, NASA’s James Hansen predicted 4-6 degrees warming for the US by the year 2020, and a huge increase in heatwaves.
“He said that with an expected doubling of atmospheric carbon dioxide by 2040, the number of days each year with temperatures over 80 degrees would rise from 35 to 85 in Washington, D.C., and Omaha, Neb.”

12 Jun 1986, Page 12 – The Evening Times at Newspapers.com
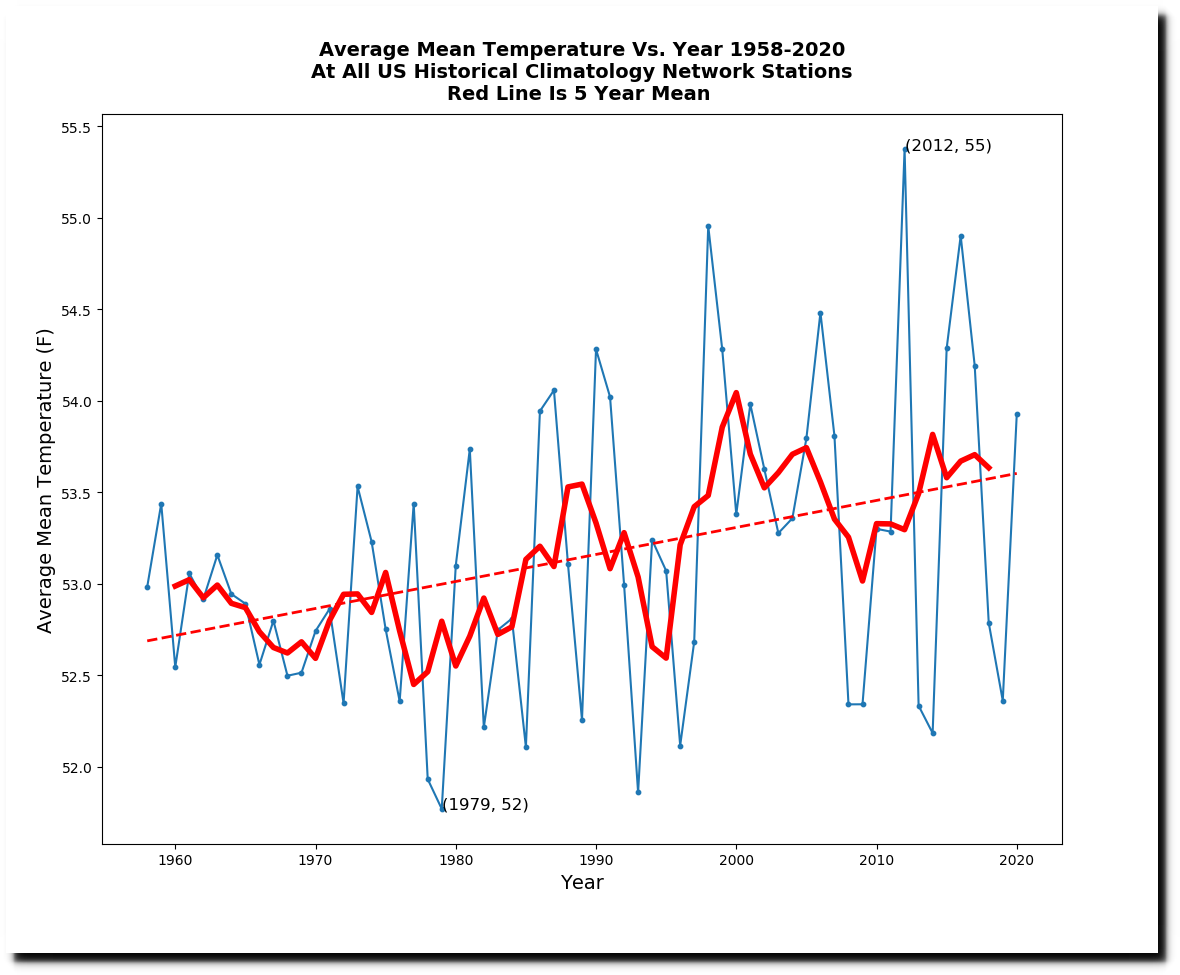
The actual temperature increase from 1958 to 2020 was about one degree.
The closest currently operational USHCN station to Omaha is at Logan, Iowa. The number of 90 degree days there peaked in 1894 and 1936 (83) and have been declining sharply ever since.
The closest currently operational USHCN station in Virginia to Washington DC is at Purcellville. The number of 90 degree days there peaked in 1911 (96) and 1930 (89) and have been declining sharply ever since.
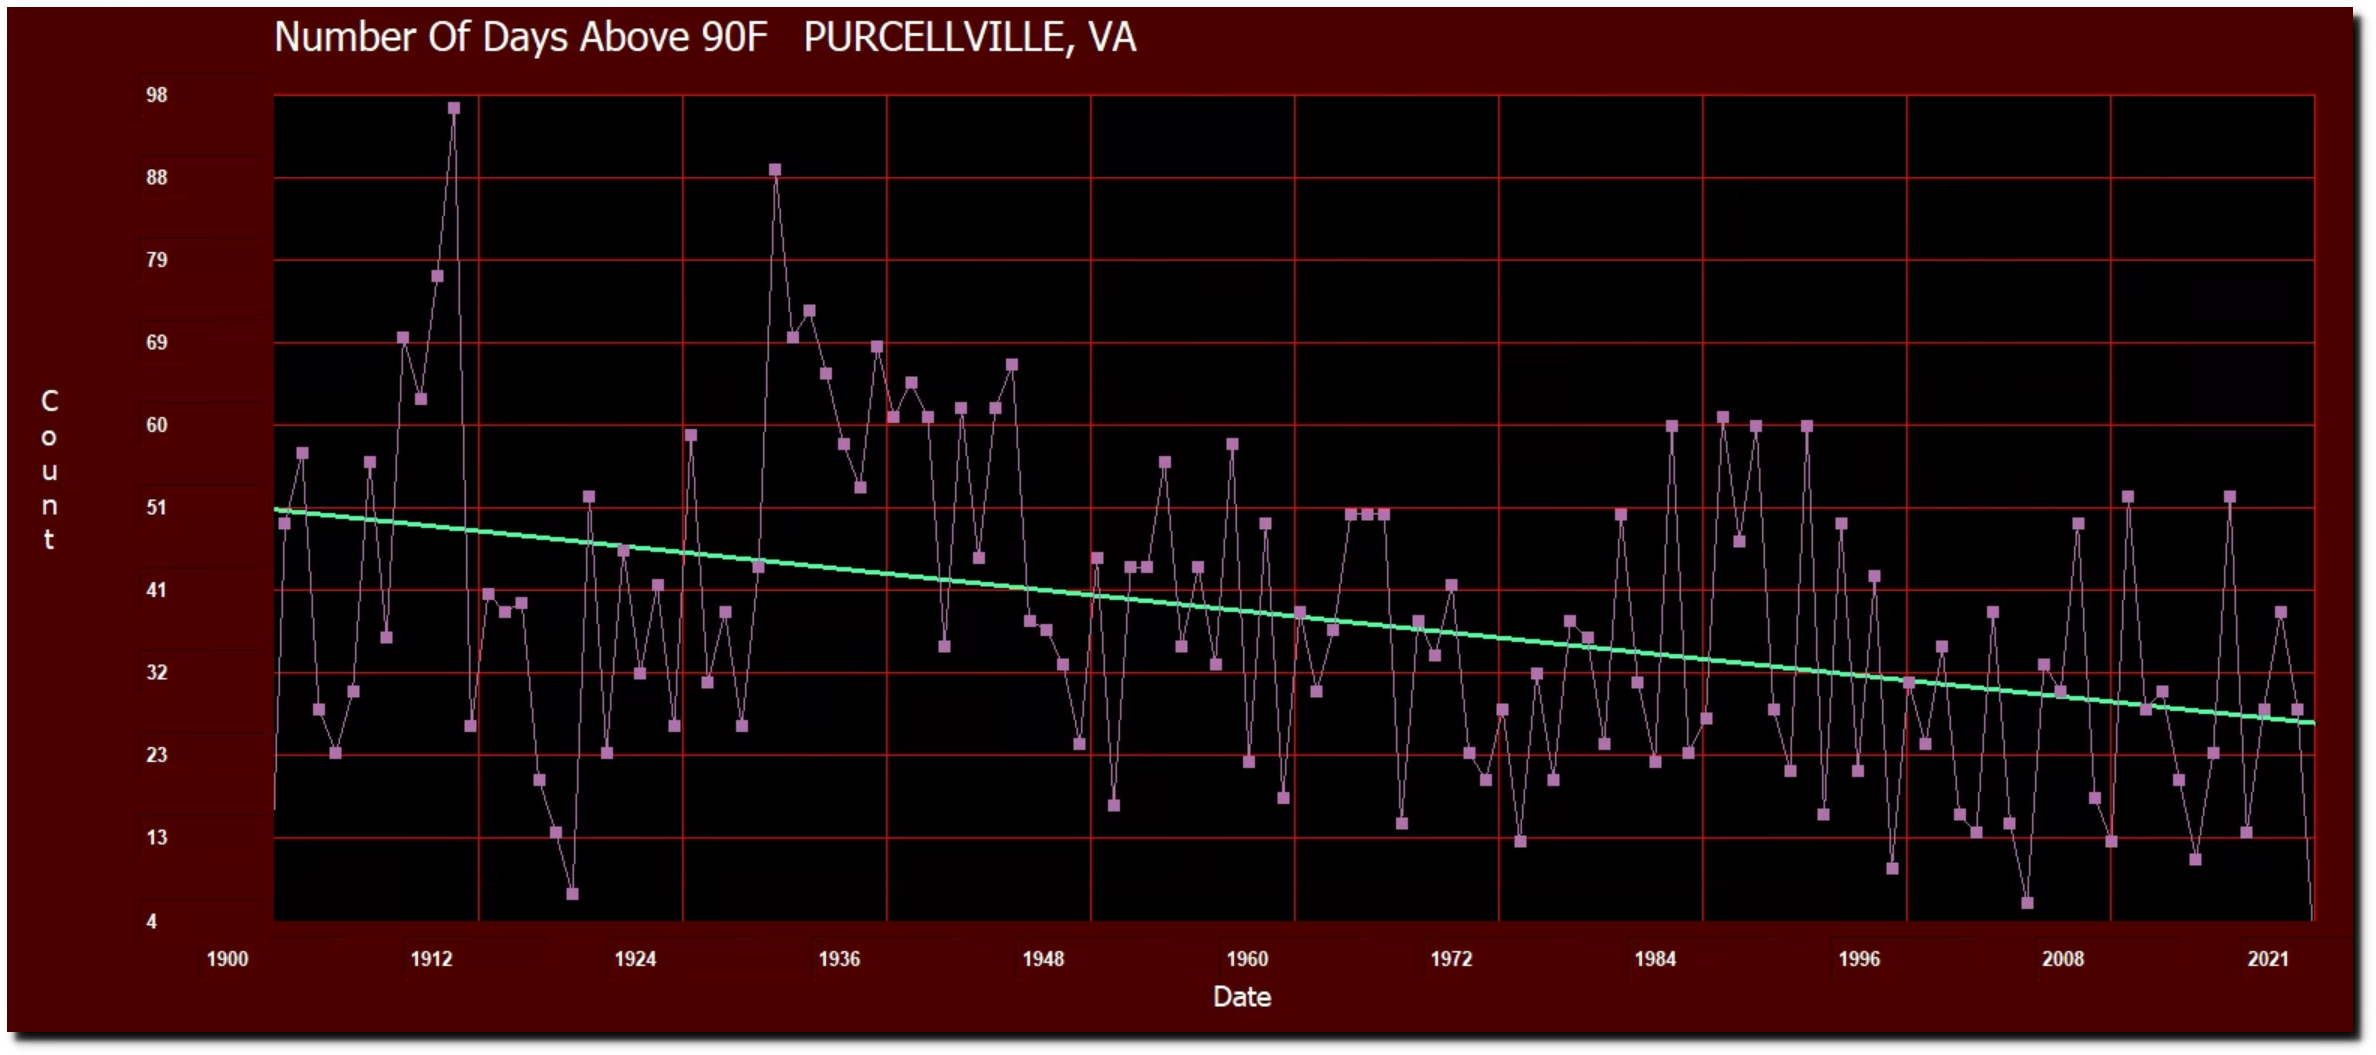
For the entire US, the frequency of 90 degree days has dropped sharply over the past century. Hansen got that exactly backwards.

In 1988, Hansen predicted a large increase in droughts.
“Dr. James E. Hansen, director of the Goddard Institute for Space Studies, who presented recent data compiled from computer models, said that predicted regional effects of global warming show that the chances of summer drought in the low and middle latitudes would be 1 in 3 by the year 2030, as against 1 in 20 in the 1950’s.”
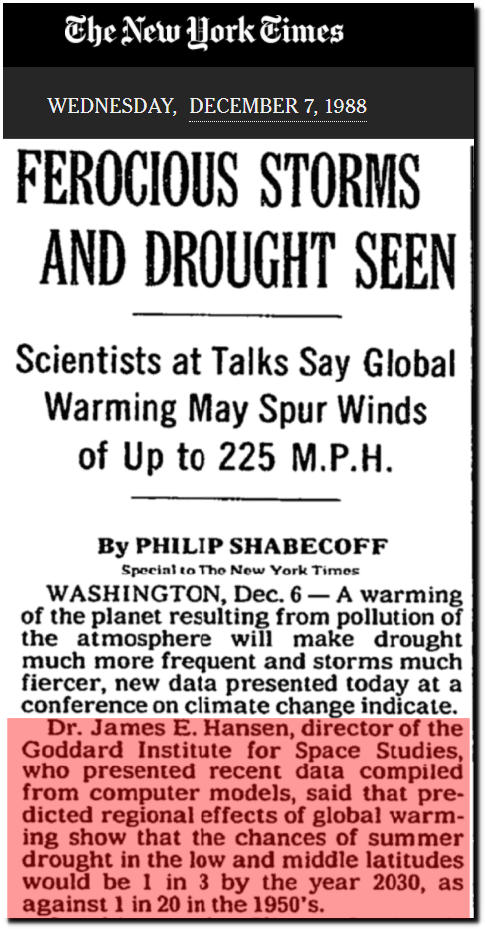 FEROCIOUS STORMS AND DROUGHT SEEN – The New York Times
During the 1950’s the US was in drought most of the time, but droughts have been much less common over the past 60 years. Hansen also got that exactly backwards.
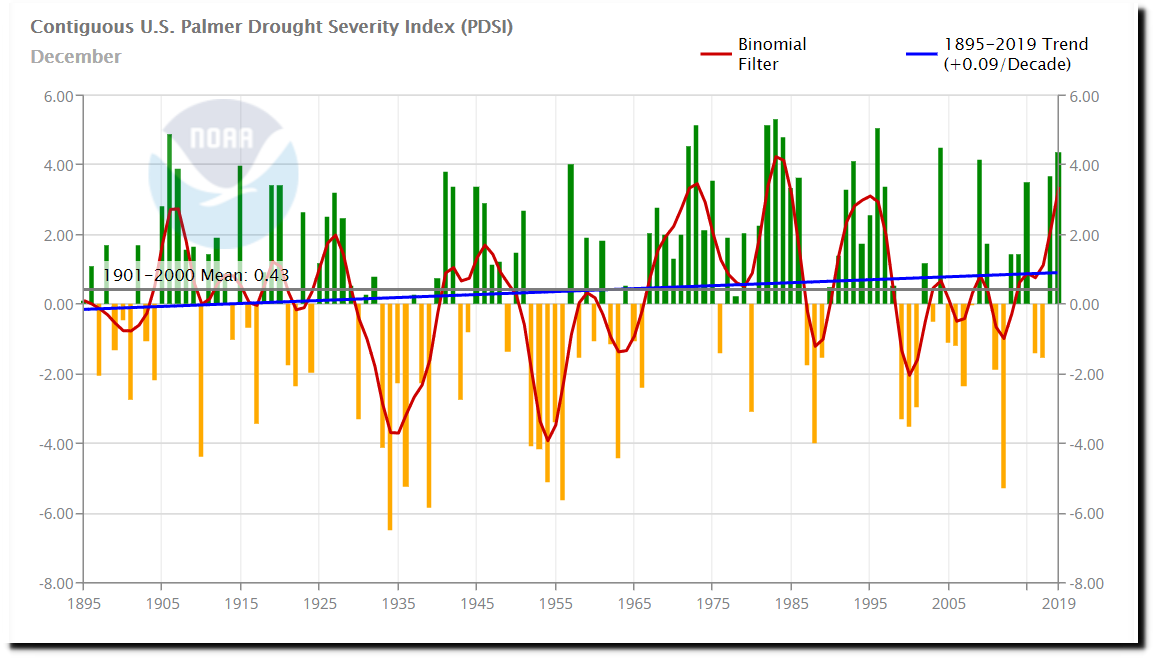
Climate at a Glance | National Centers for Environmental Information (NCEI)
One year after Hansen made his forecasts, scientists at NOAA set the record straight.
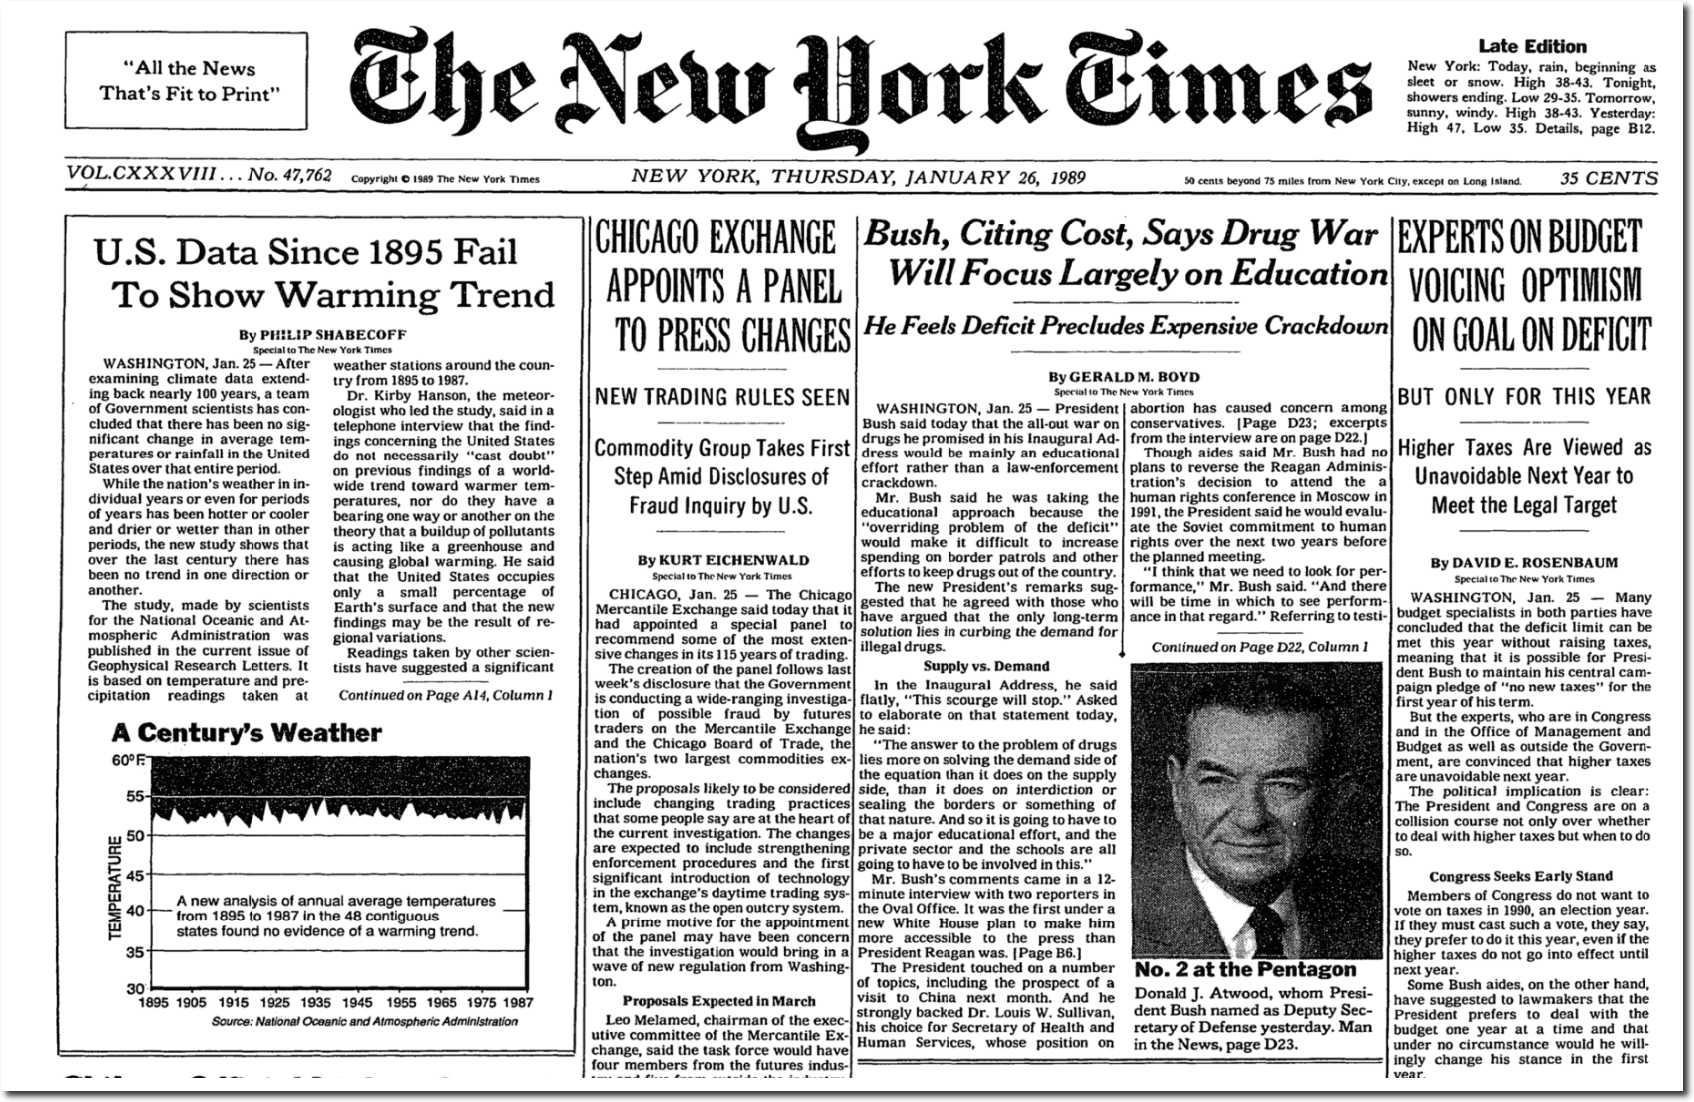
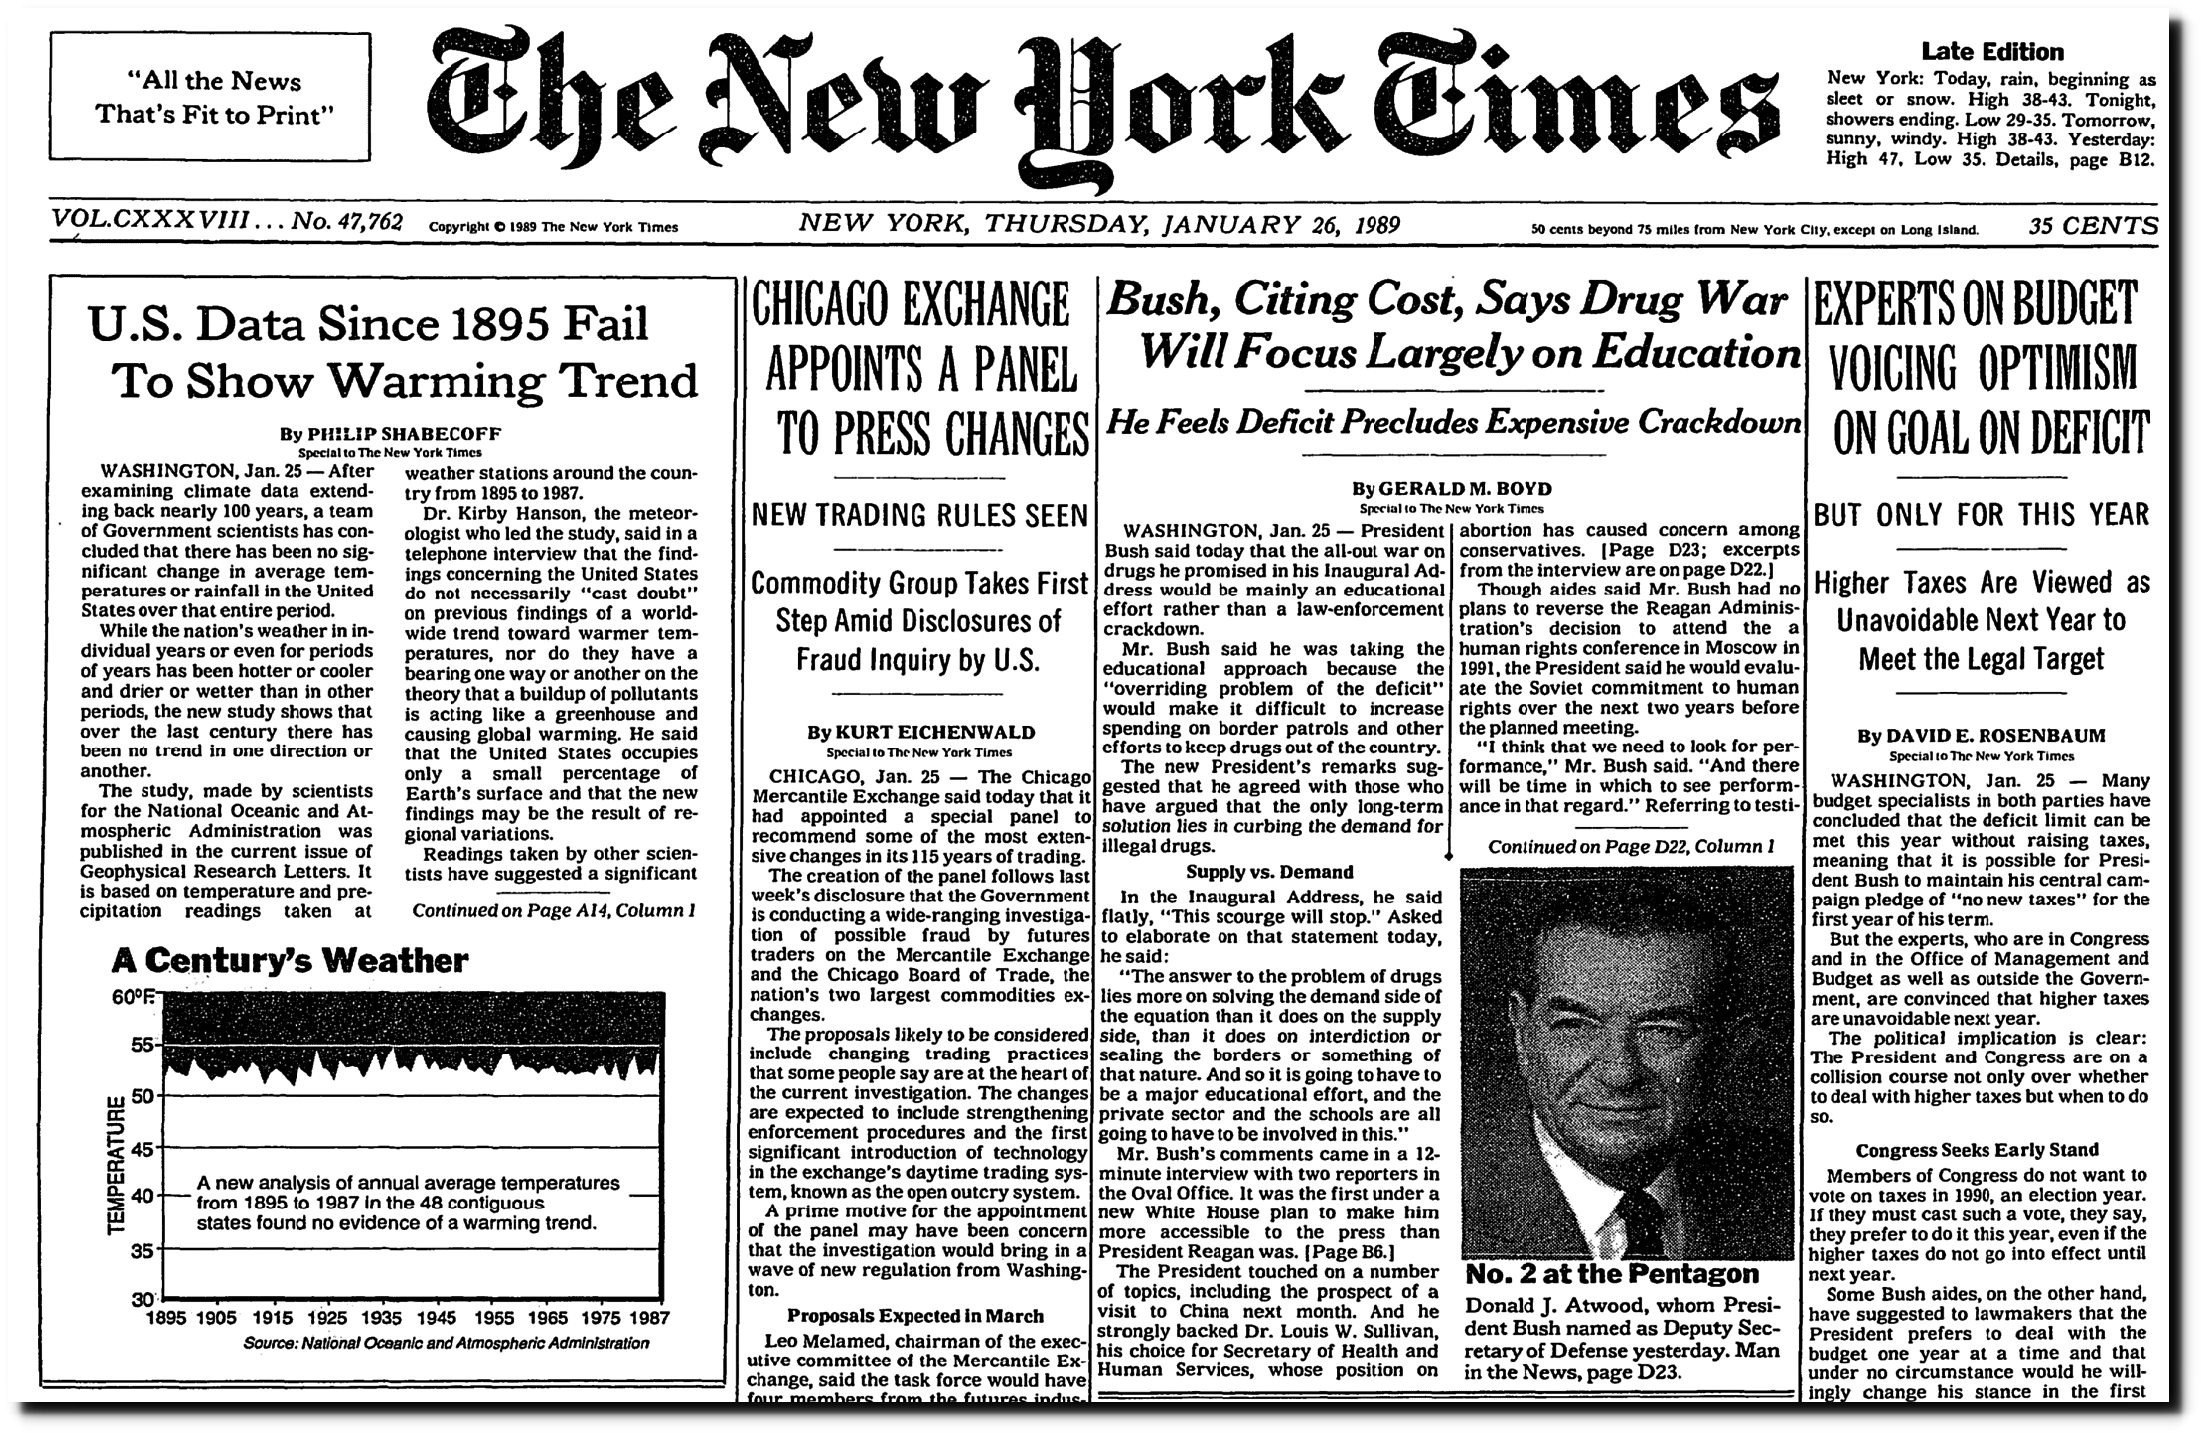
U.S. Data Since 1895 Fail To Show Warming Trend
“After examining climate data extending back nearly 100 years, a team of Government scientists has concluded that there has been no significant change in average temperatures or rainfall in the United States over that entire period.
While the nation’s weather in individual years or even for periods of years has been hotter or cooler and drier or wetter than in other periods, the new study shows that over the last century there has been no trend in one direction or another.
The study, made by scientists for the National Oceanic and Atmospheric Administration was published in the current issue of Geophysical Research Letters. It is based on temperature and precipitation readings taken at weather stations around the country from 1895 to 1987.”
U.S. Data Since 1895 Fail To Show Warming Trend – NYTimes.com
Ten years later, Hansen was upset that the US wasn’t warming as he predicted and the droughts weren’t occurring.
Empirical evidence does not lend much support to the notion that climate is headed precipitately toward more extreme heat and drought. The drought of 1999 covered a smaller area than the 1988 drought, when the Mississippi almost dried up. And 1988 was a temporary inconvenience as compared with repeated droughts during the 1930s “Dust Bowl” that caused an exodus from the prairies, as chronicled in Steinbeck’s Grapes of Wrath.
The U.S. has warmed during the past century, but the warming hardly exceeds year-to-year variability. Indeed, in the U.S. the warmest decade was the 1930s and the warmest year was 1934.
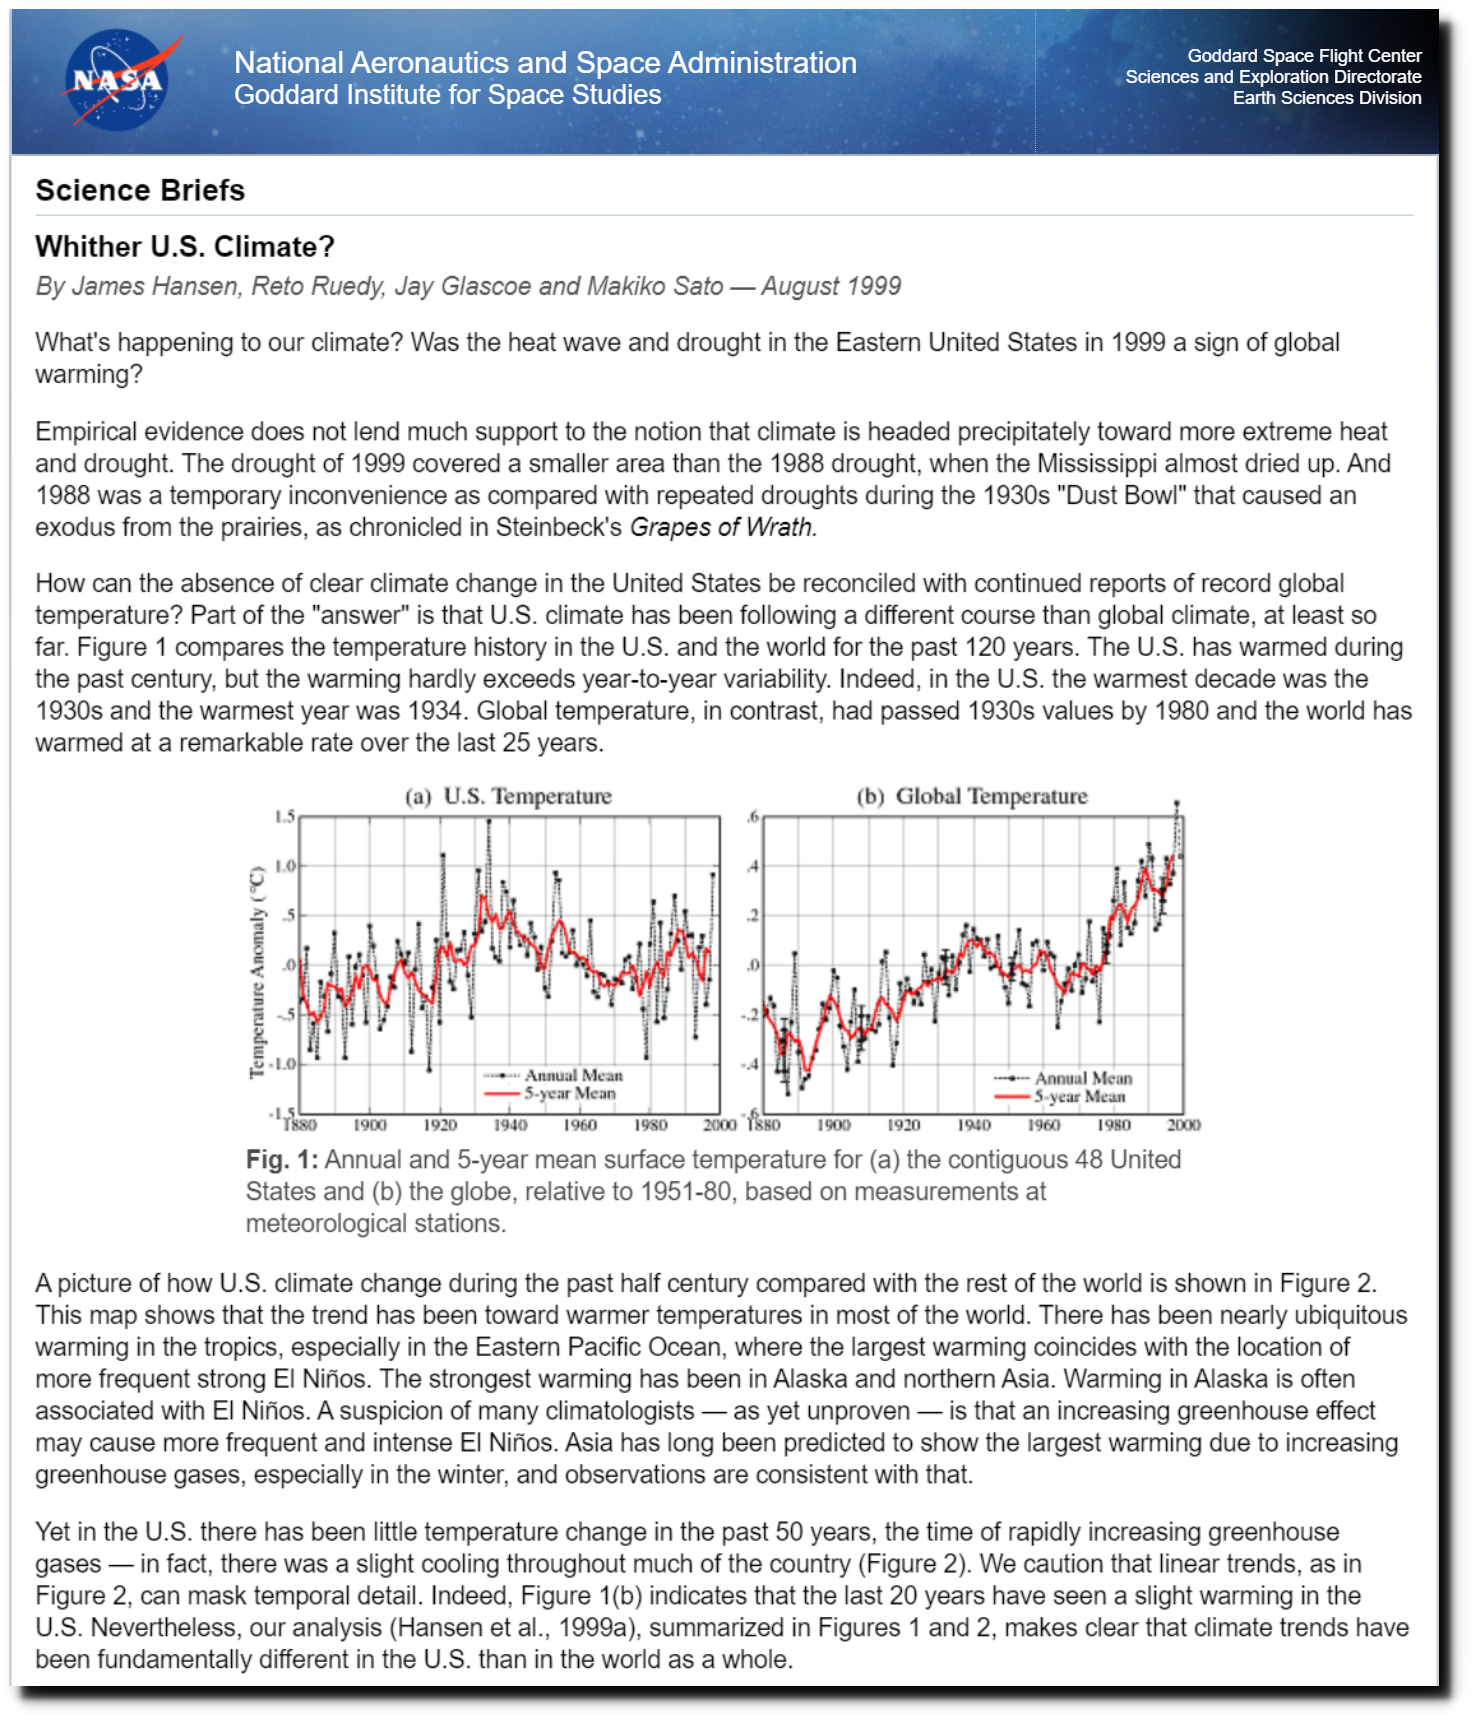
NASA GISS: Science Briefs: Whither U.S. Climate?
So Hansen and NOAA got together and altered the US temperature record. NOAA now shows a warming trend from 1895 to 1987.
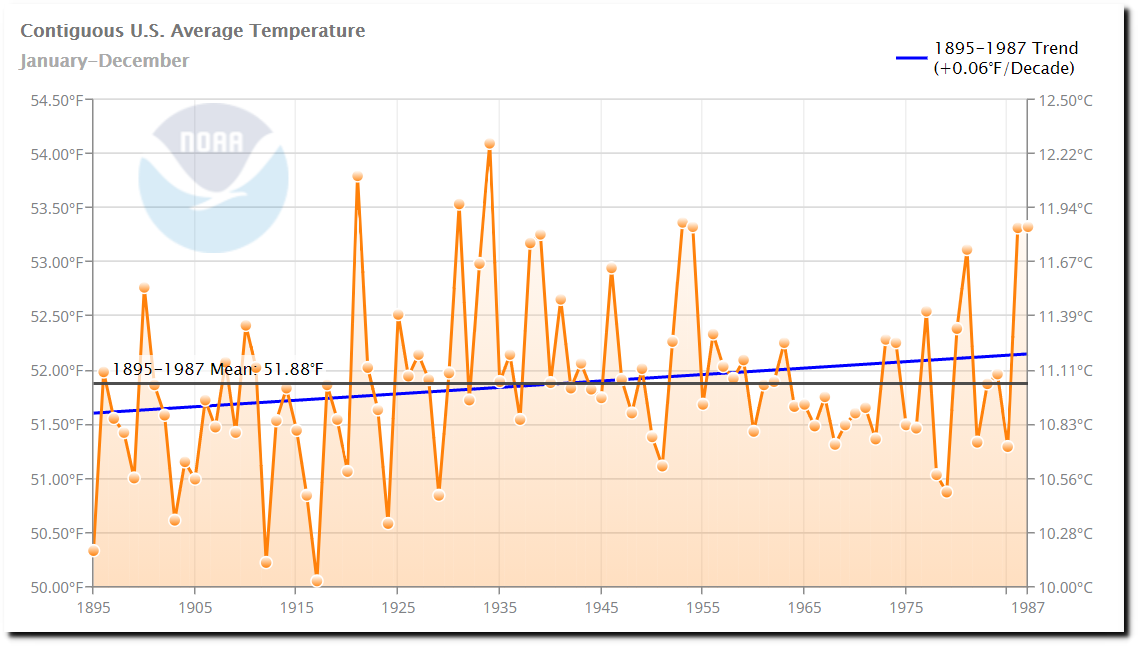
Climate at a Glance | National Centers for Environmental Information (NCEI)
In 2004, NOAA showed that they were altering US temperatures by 0.5F since the year 1900, with no further charges after 1990.
But now they are altering the data by 2.0F.
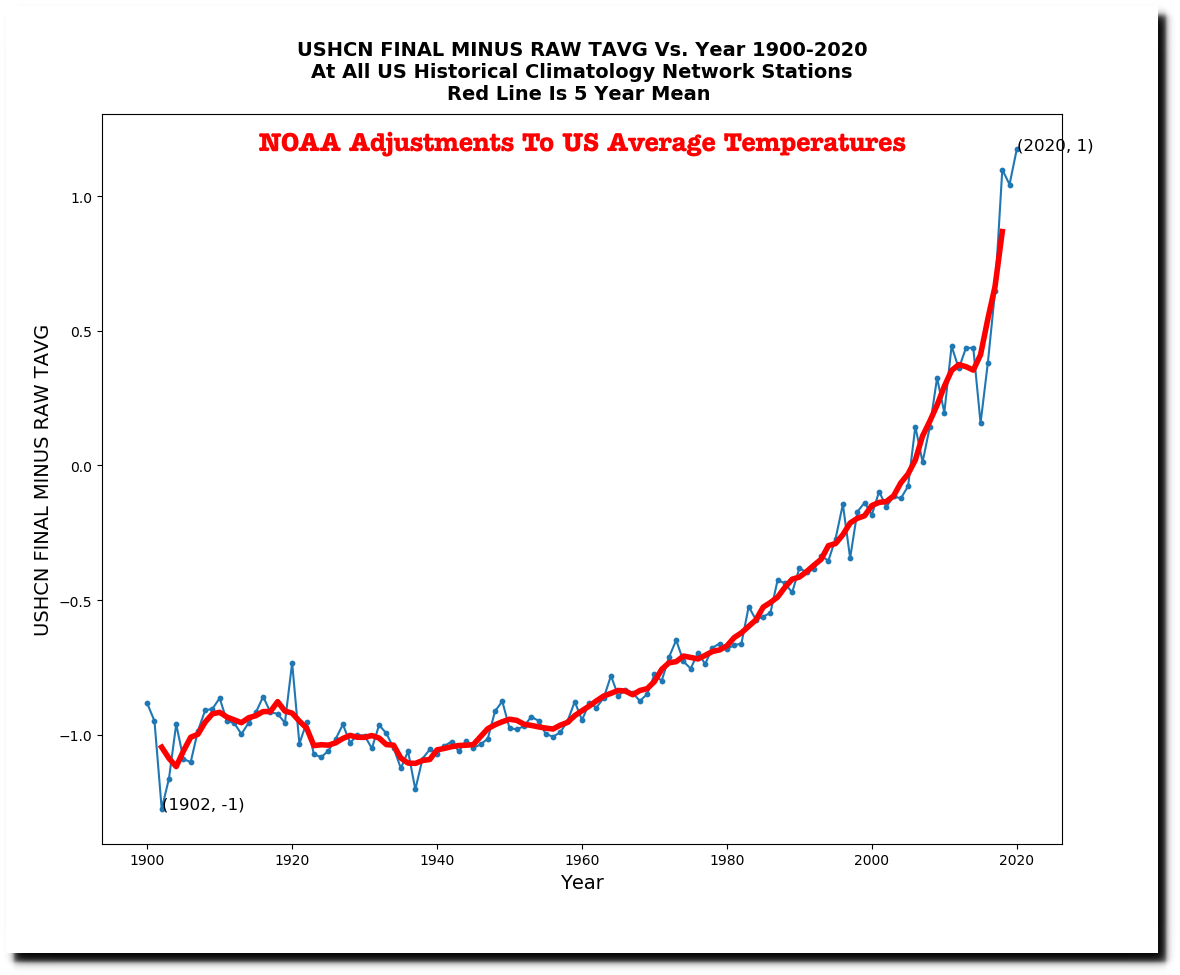
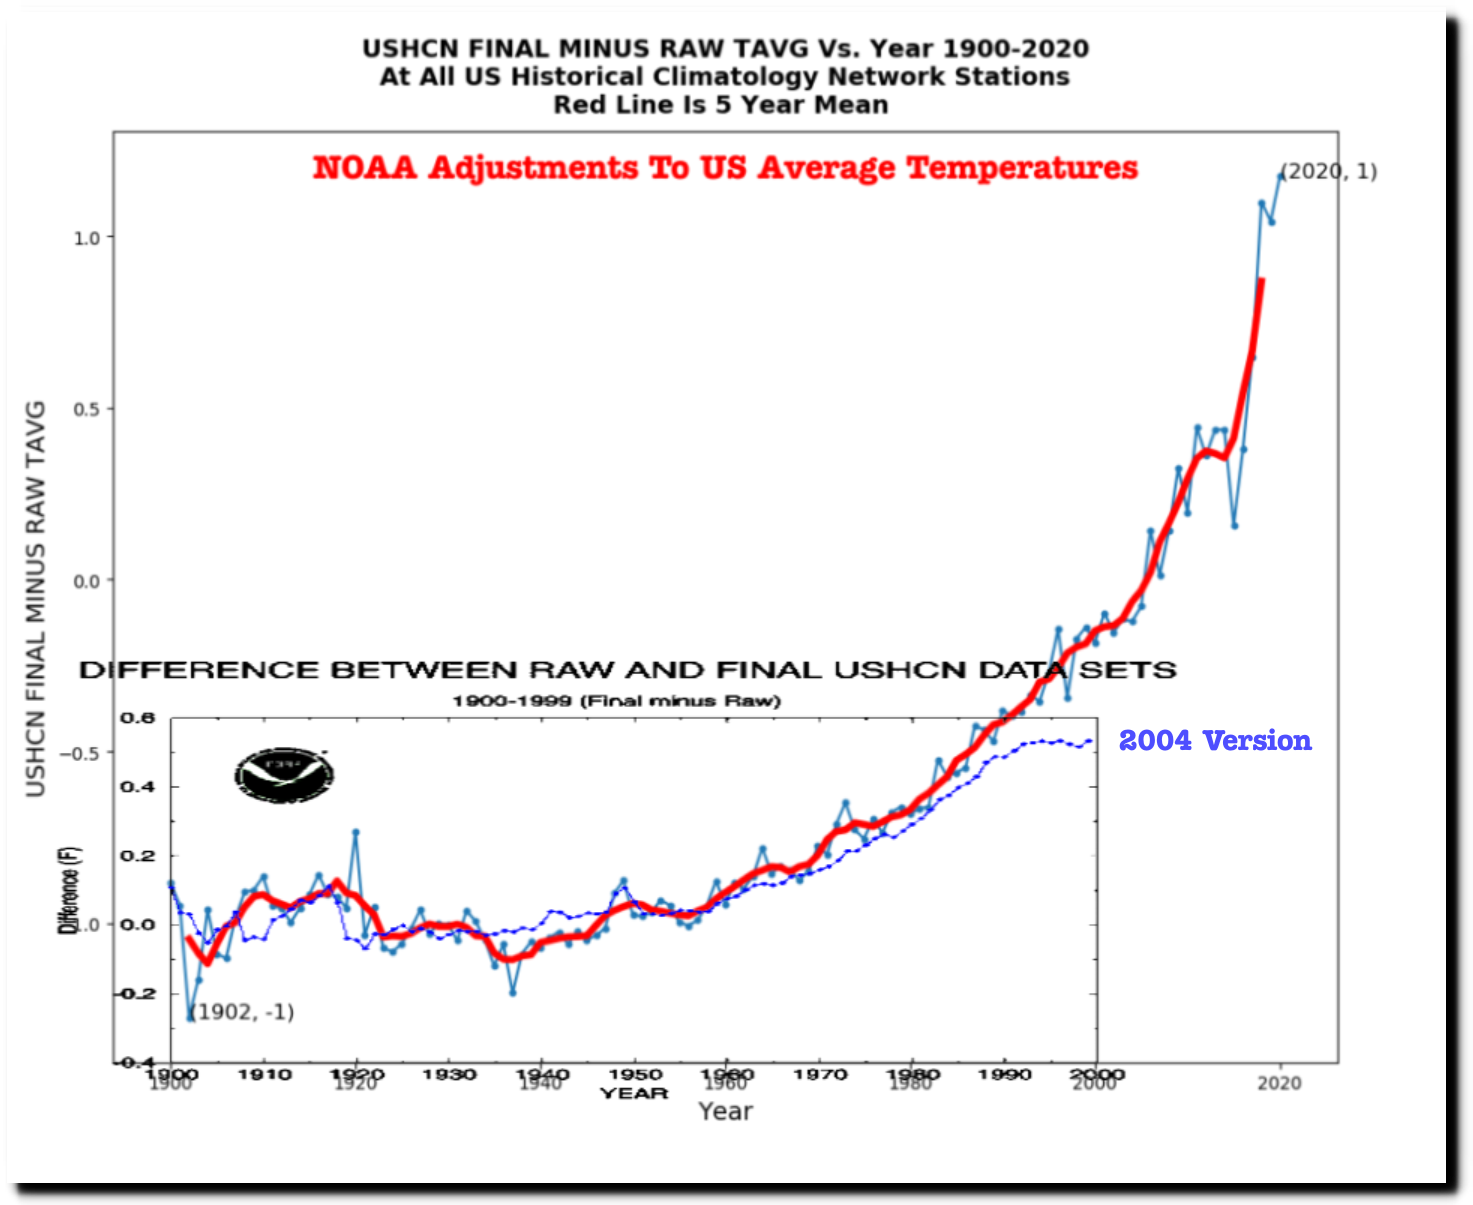
This graph compares the 2004 adjustments in blue, to the current adjustments in red.
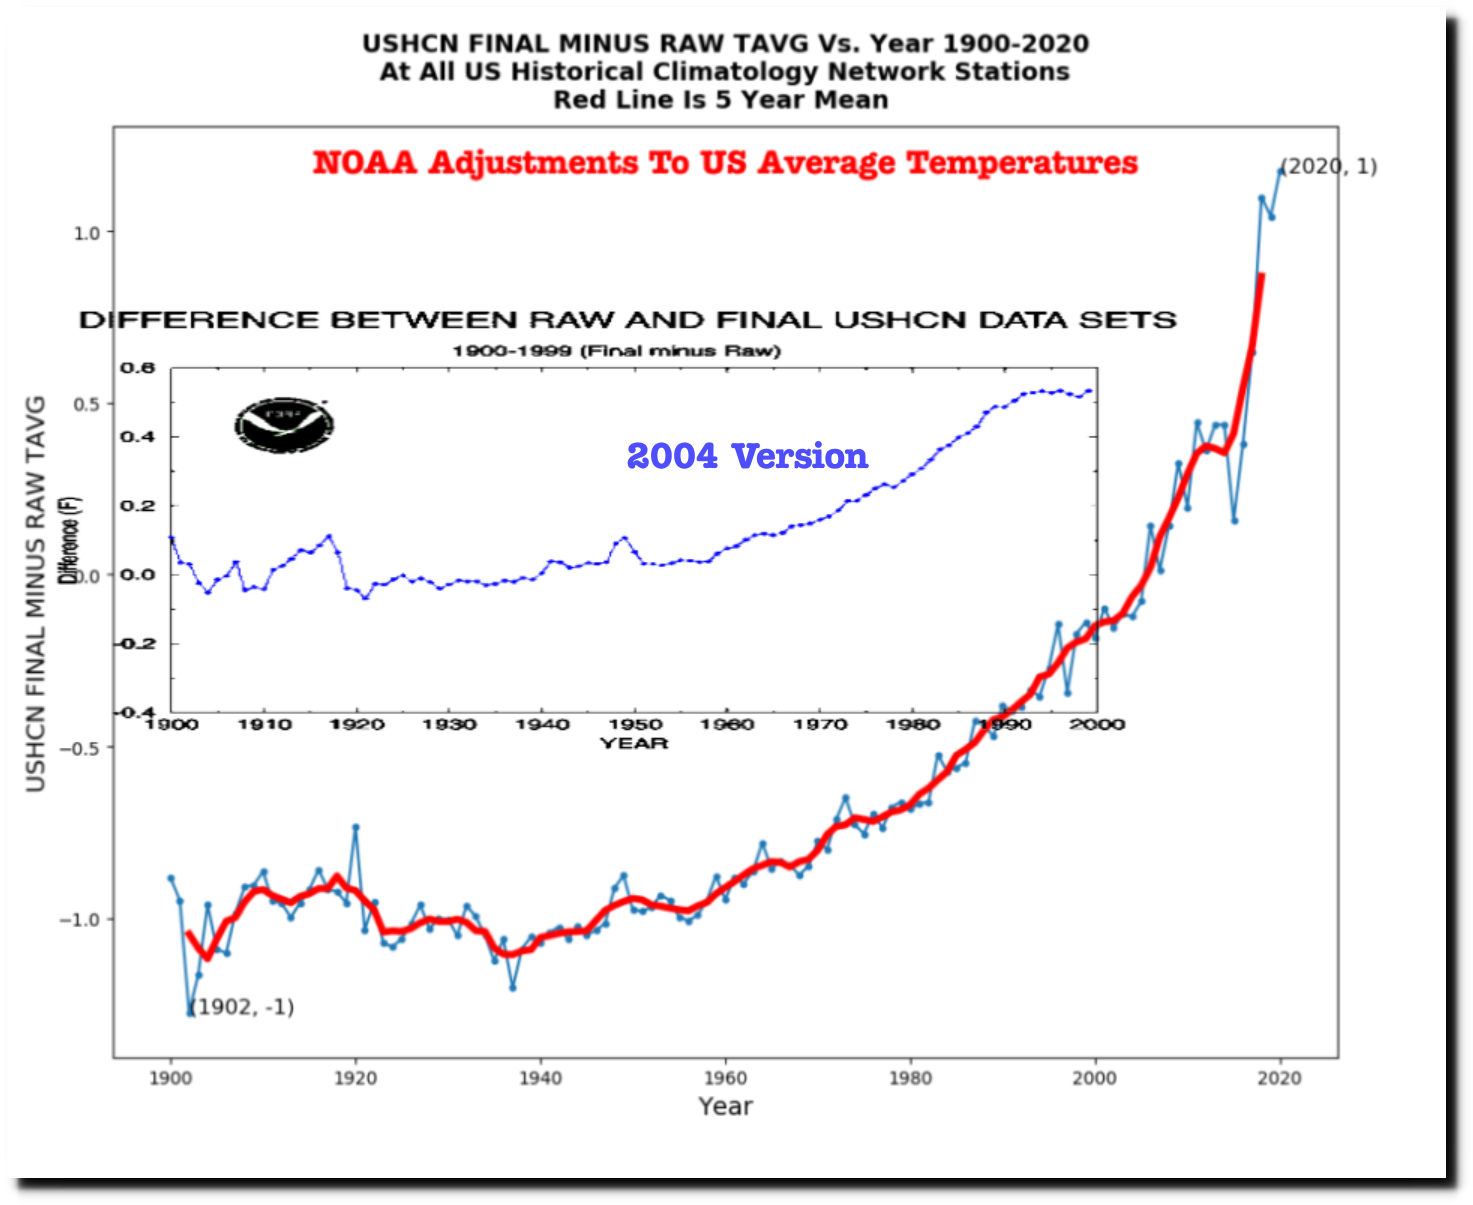
And this graph normalizes the two sets of adjustments along the Y-Axis. There has been a huge increase in the amount of data tampering for years since 1990.
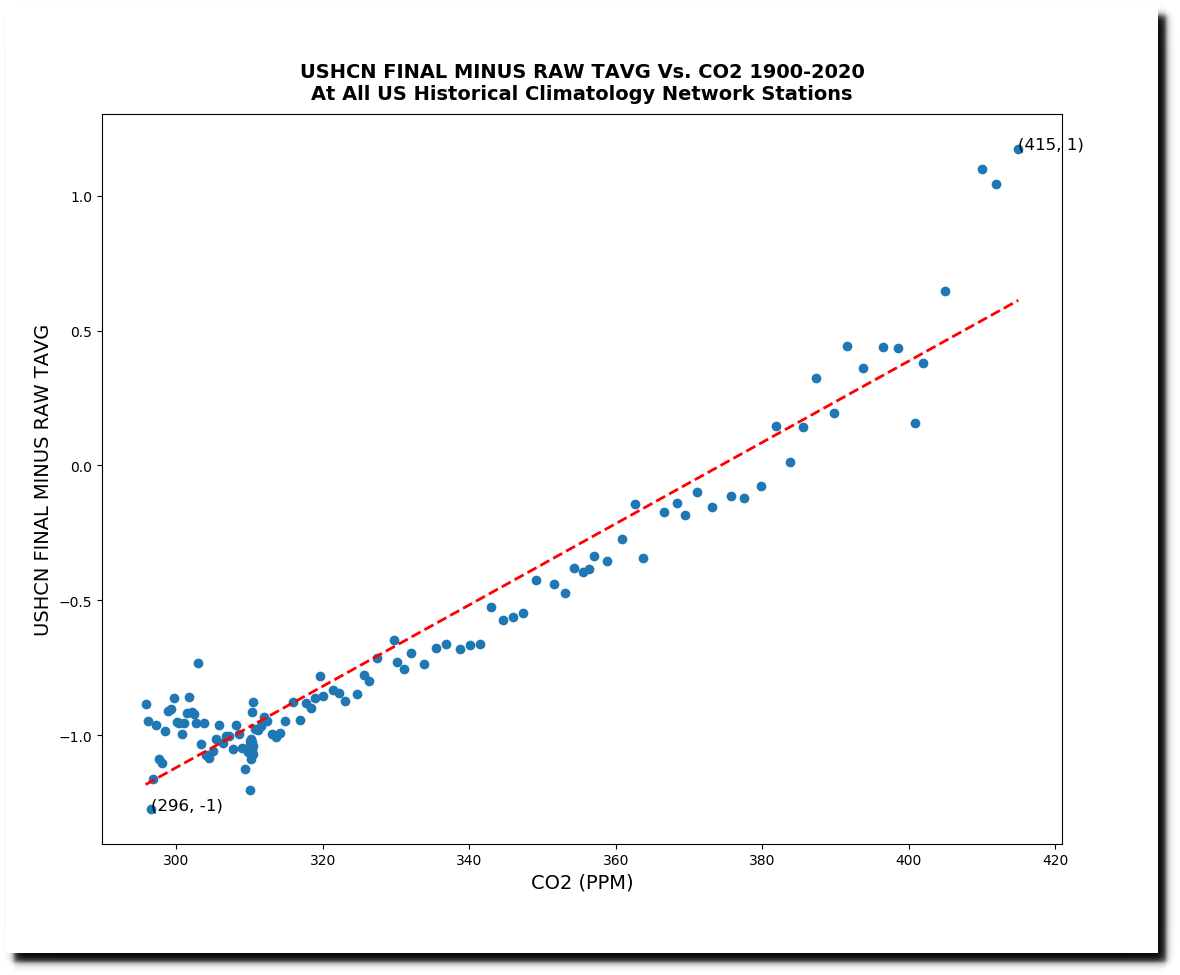
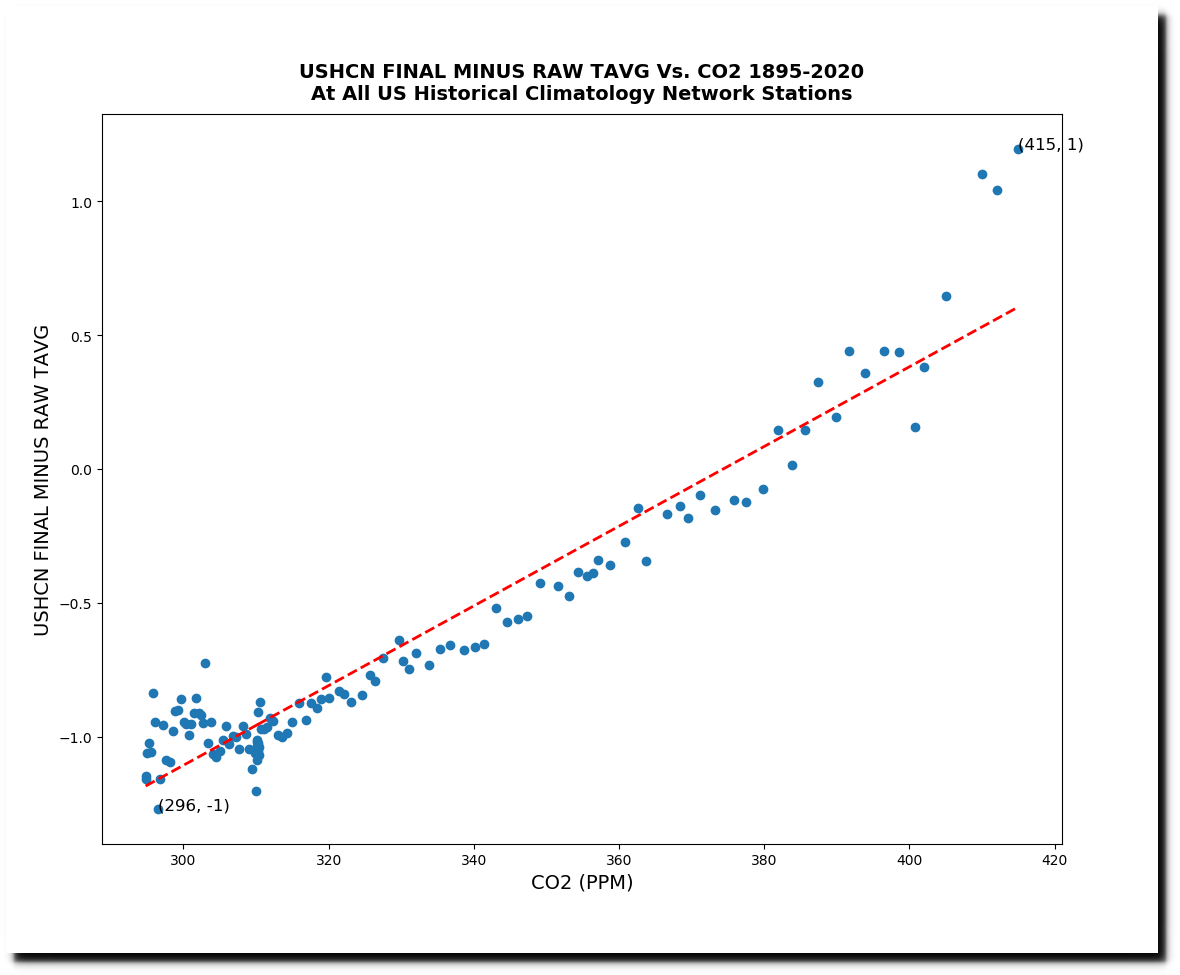
The NOAA adjustments trend very closely with the amount of carbon dioxide in the atmosphere, or at least they did until three years ago, when there was a huge increase in the amount of tampering.
NOAA fabricates missing data using a computer model, and last year almost 50% of their monthly US temperature data was fabricated.
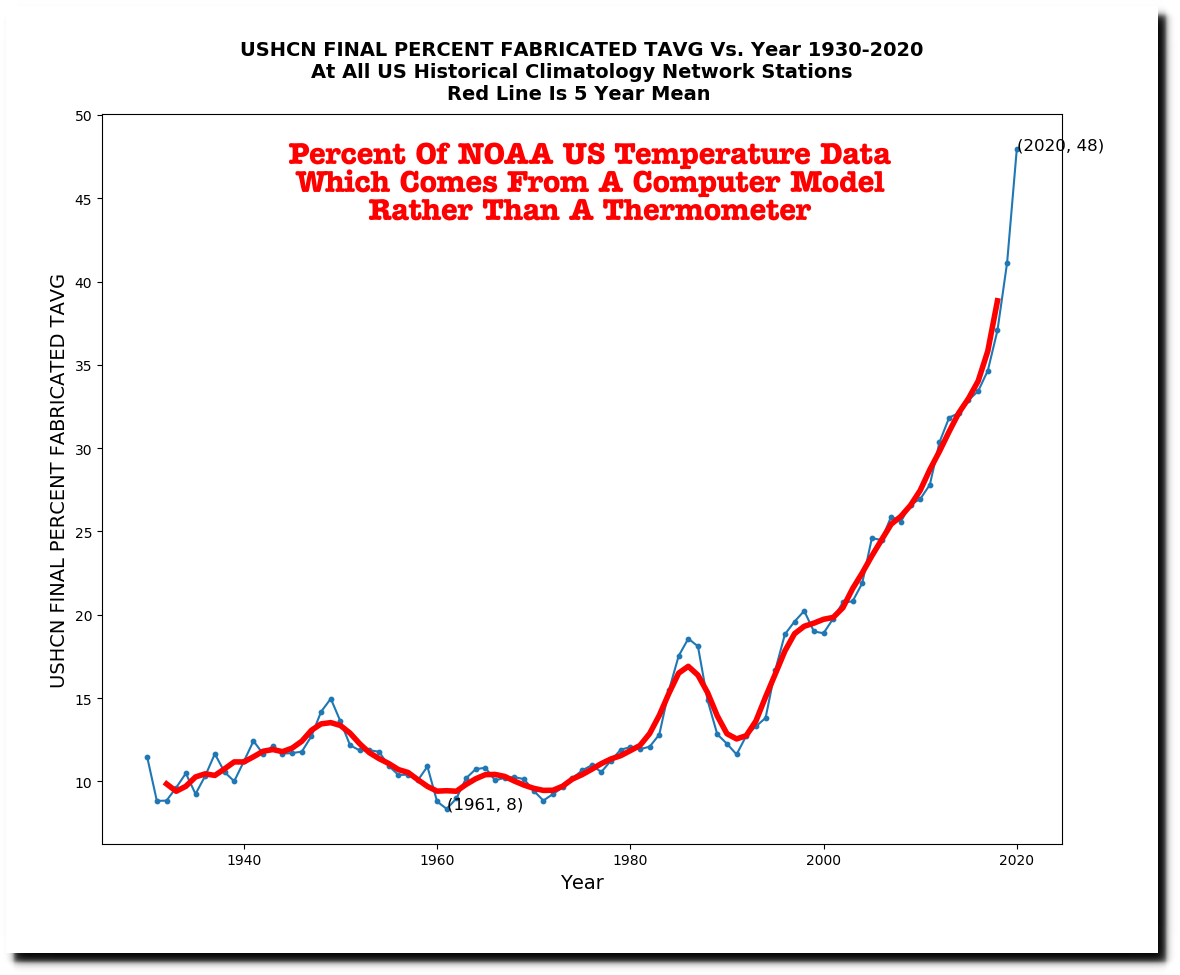
This is the data for Brewton, Alabama. If the data is estimated rather than measured, it is marked with an “E” – All twelve months of 2020 were marked with an E.

ftp://ftp.ncdc.noaa.gov/pub/data/ushcn/v2.5/ushcn.tavg.latest.FLs.52j.tar.gz
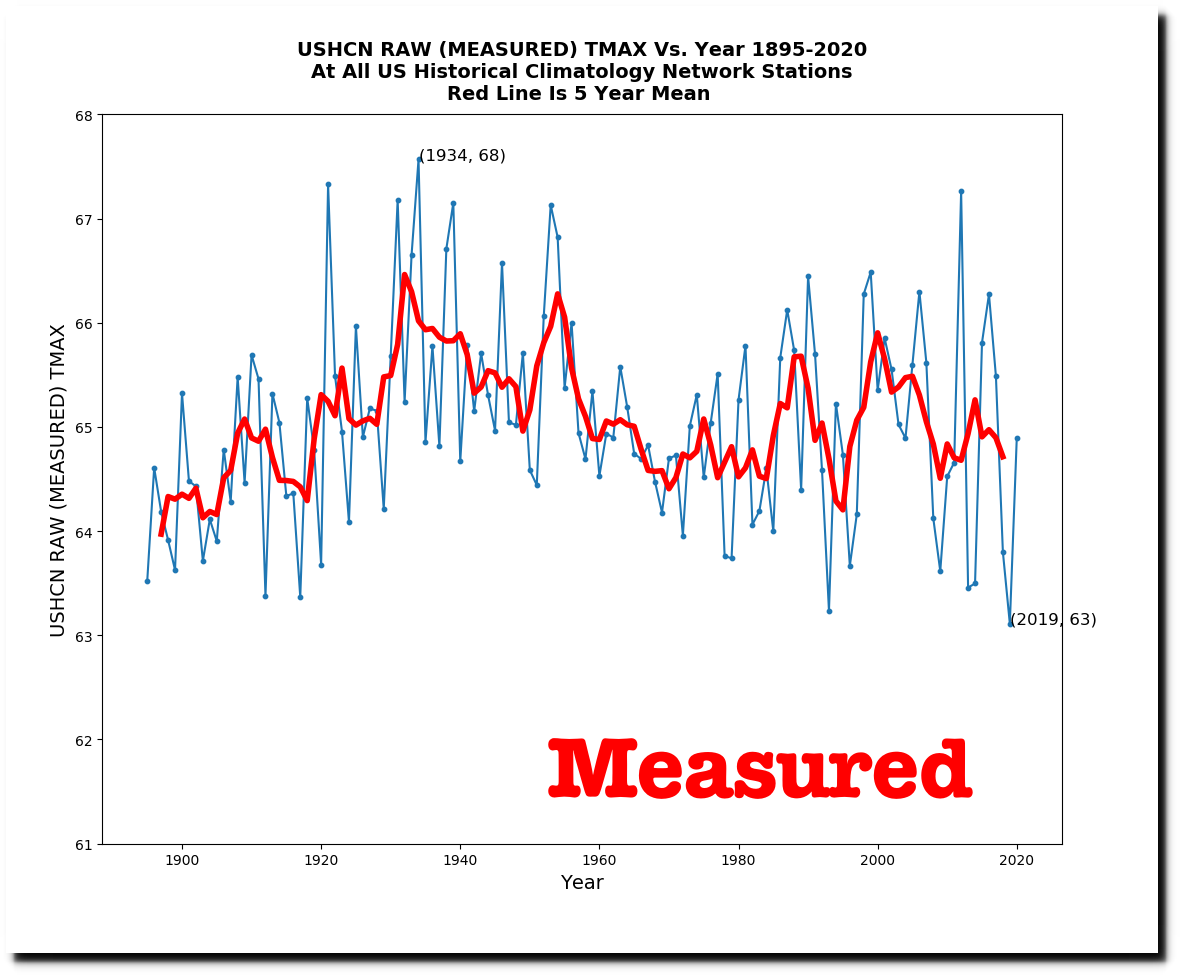
The current data tampering is huge. The measured daily maximum temperature data for the US shows a strong cooling trend.
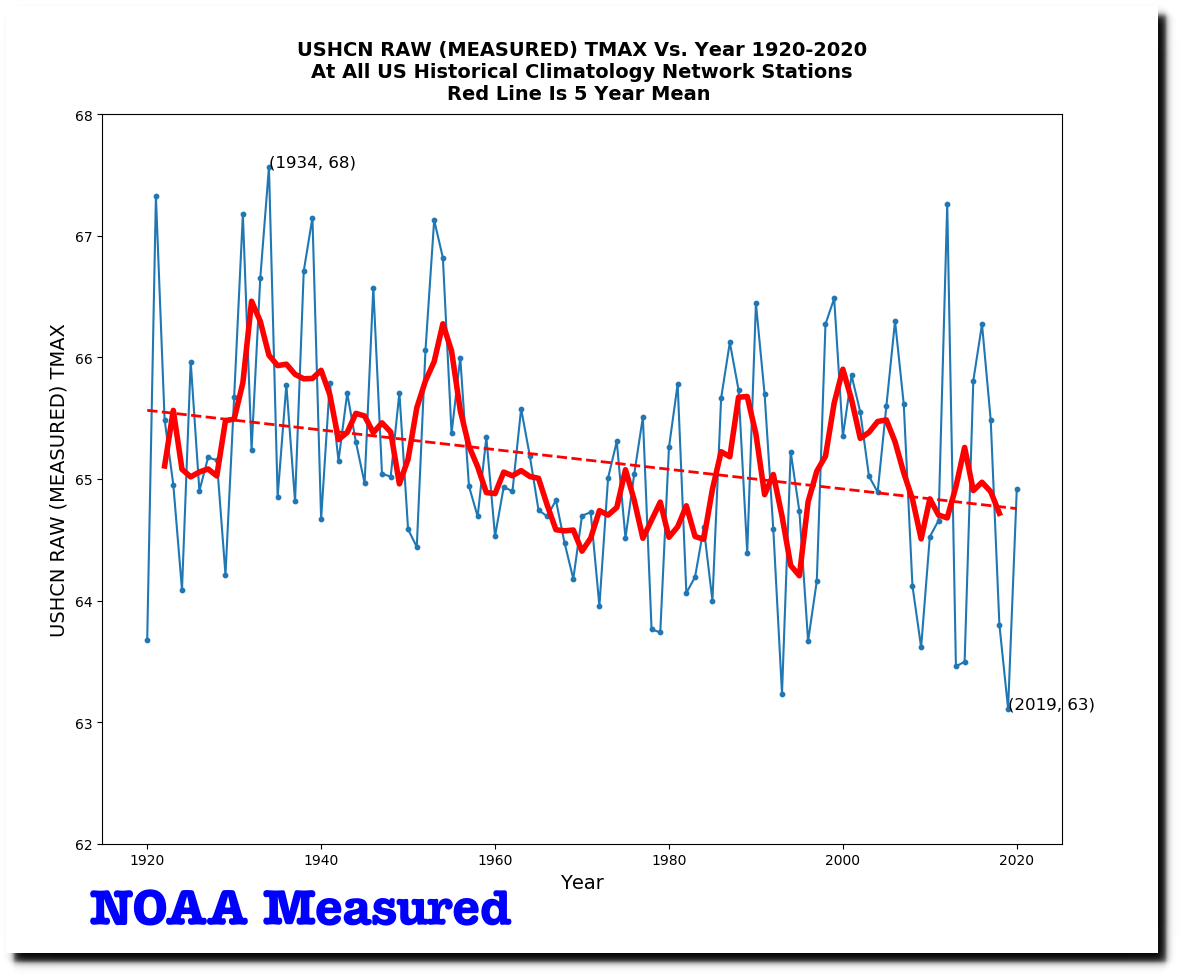
ftp://ftp.ncdc.noaa.gov/pub/data/ushcn/v2.5/
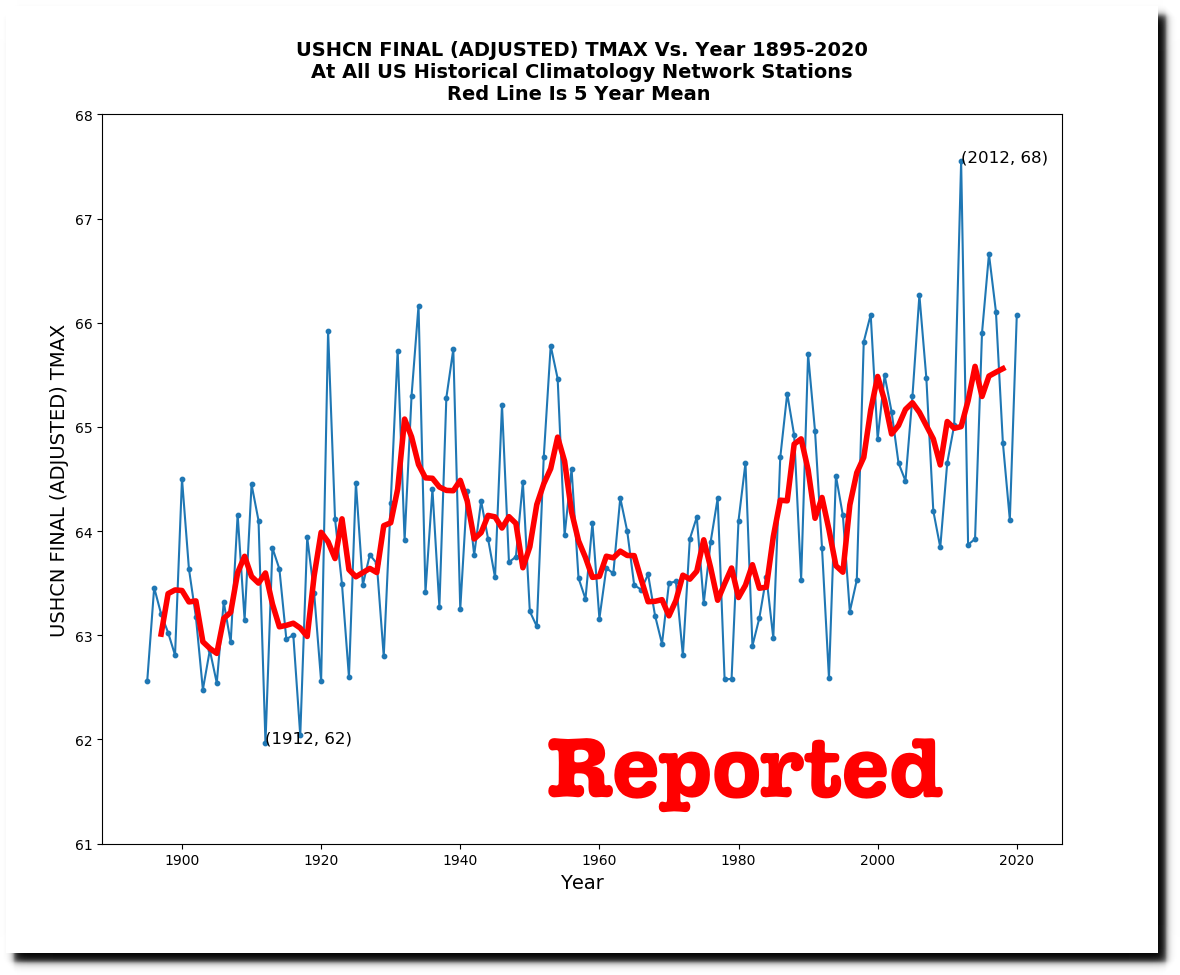
But the adjusted data shows a strong warming trend.
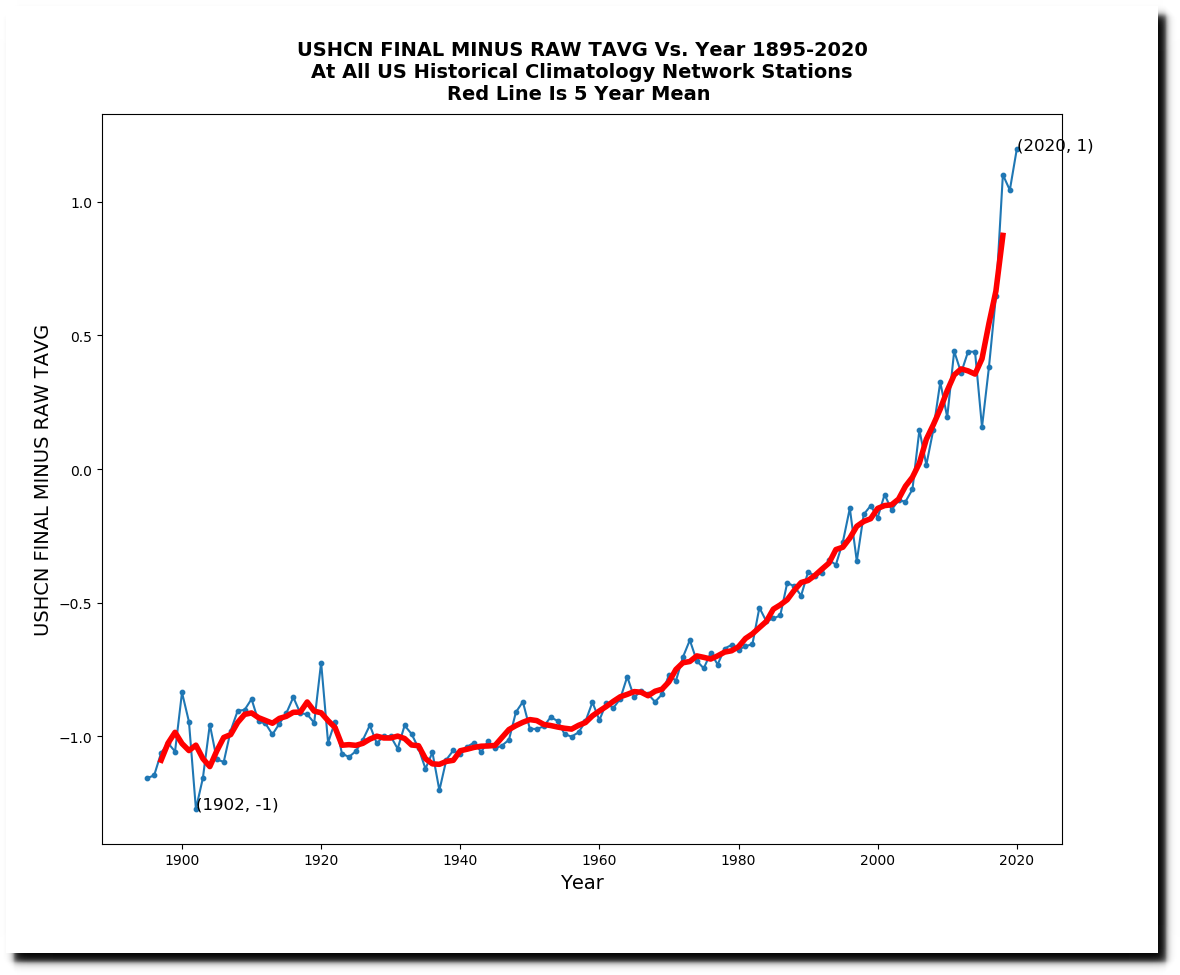
The total adjustment to US average temperatures is more than two degrees Fahrenheit.
Plotted vs. CO2, it can be seen that until the last three years, the adjustments being made very closely tracked the increase in CO2. Data is being altered to match their theory.
07 Dec 1989, Page 14 – Santa Cruz Sentinel at Newspapers.com
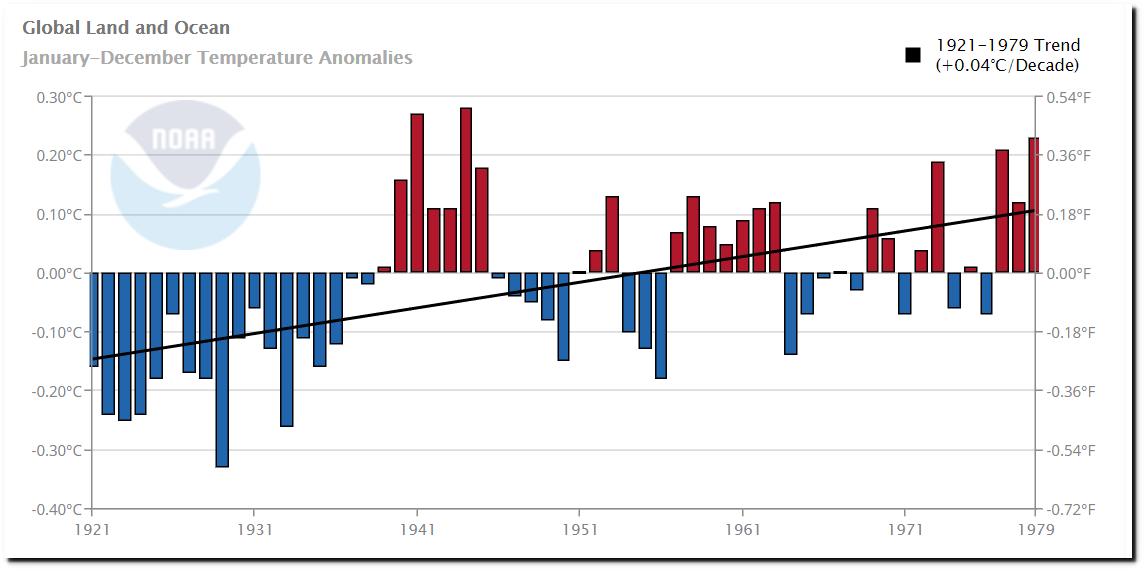
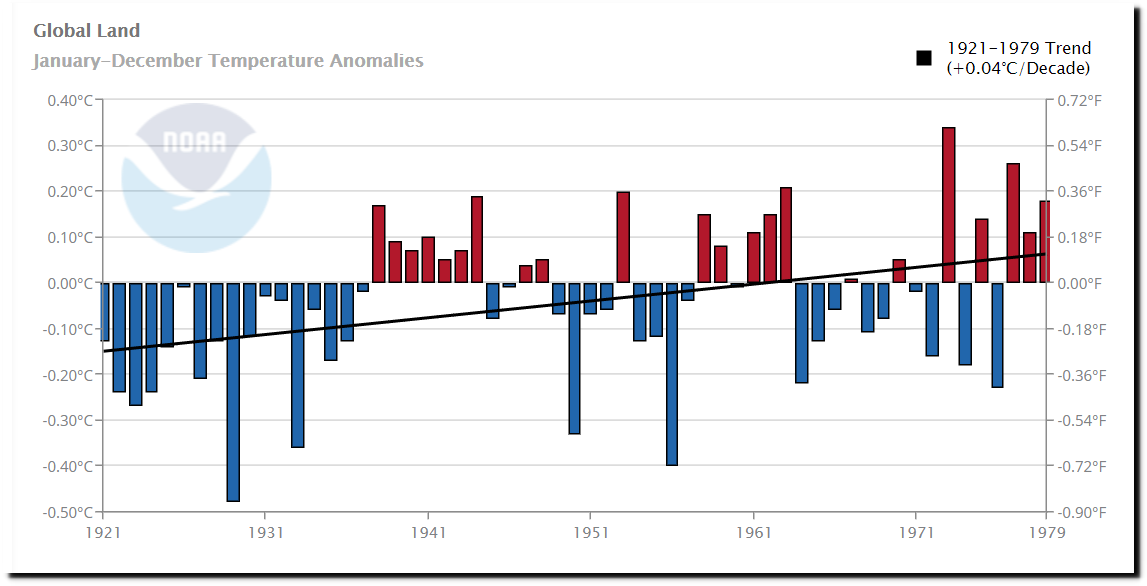
NOAA graphs now show a warming trend from 1921 to 1979.
Climate at a Glance | National Centers for Environmental Information (NCEI)
Climate at a Glance | National Centers for Environmental Information (NCEI)
One hundred years ago, the New York Times reported that earth had a fever.
“an intermittent fever, manifested in a world-wide heat wave of unusual length and intensity.”
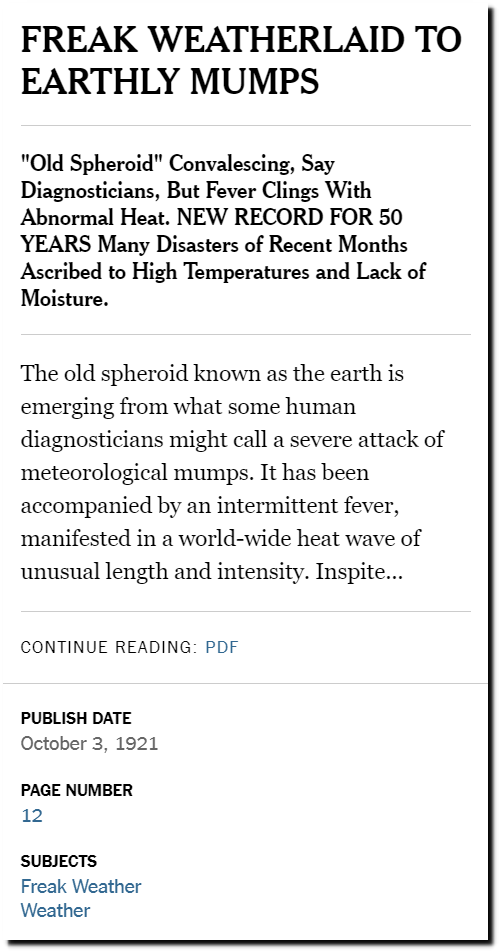
TimesMachine: October 3, 1921 – NYTimes.com
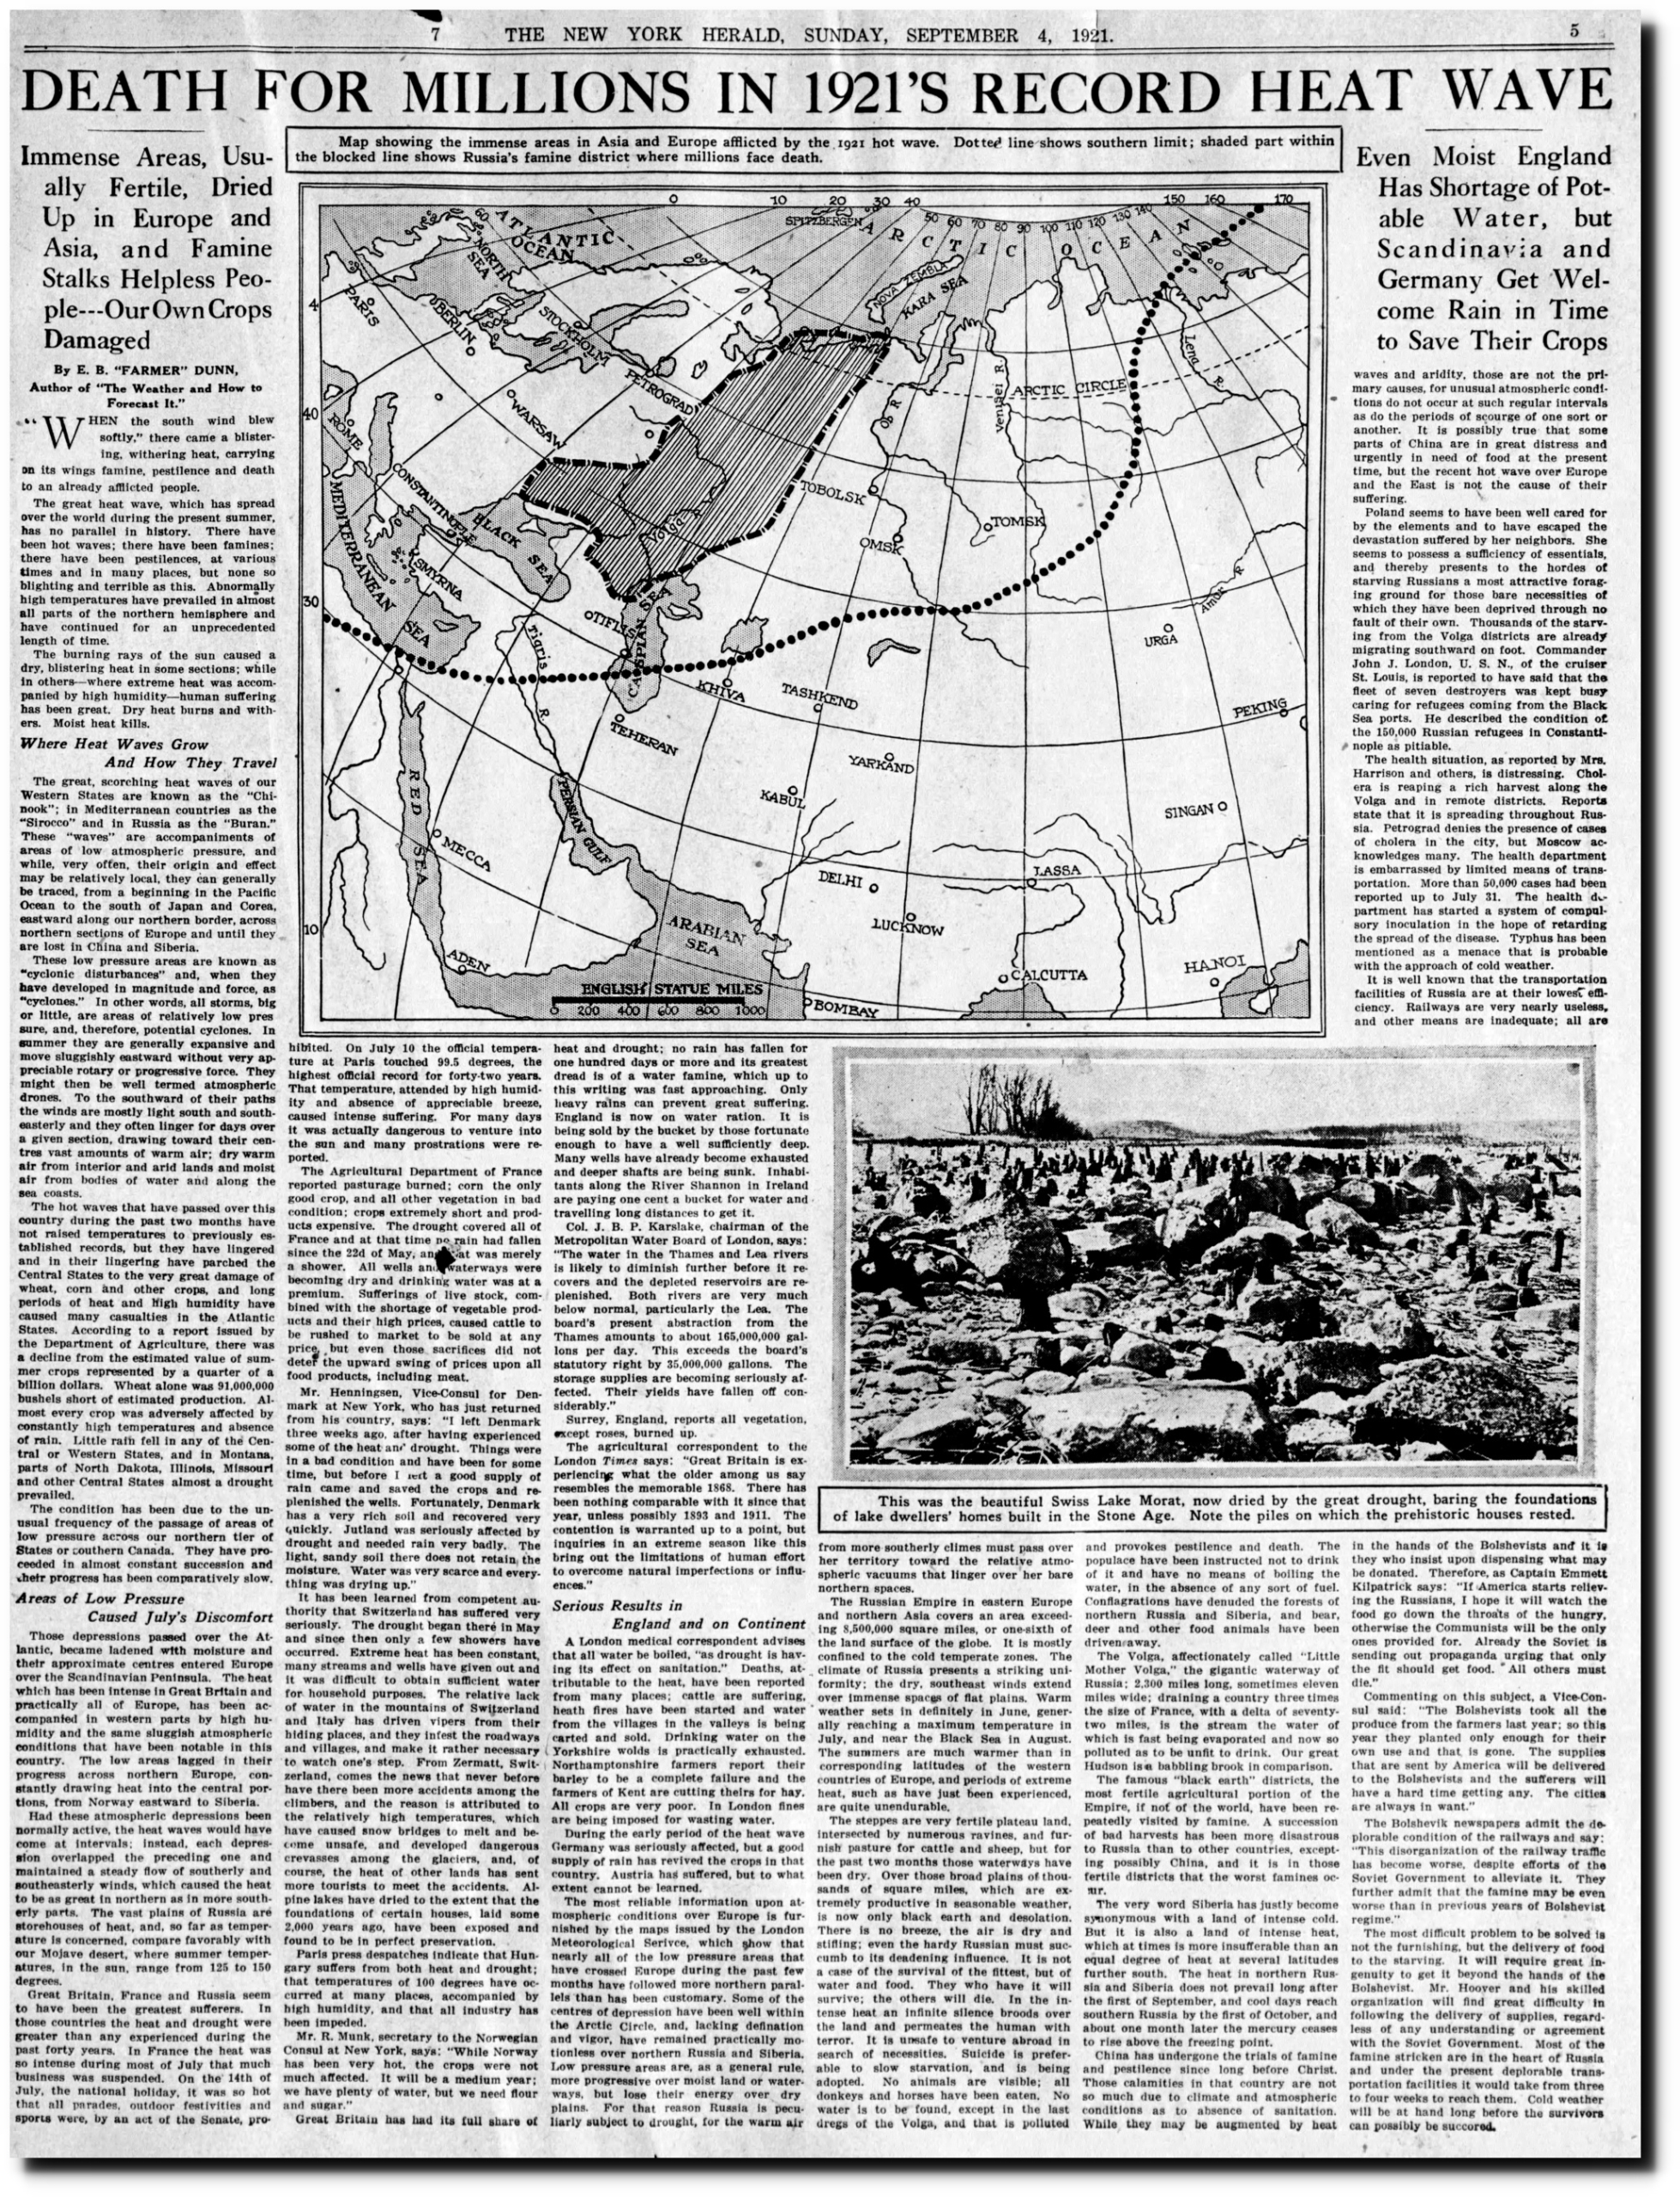
04 Sep 1921, 61 – New York Herald at Newspapers.com
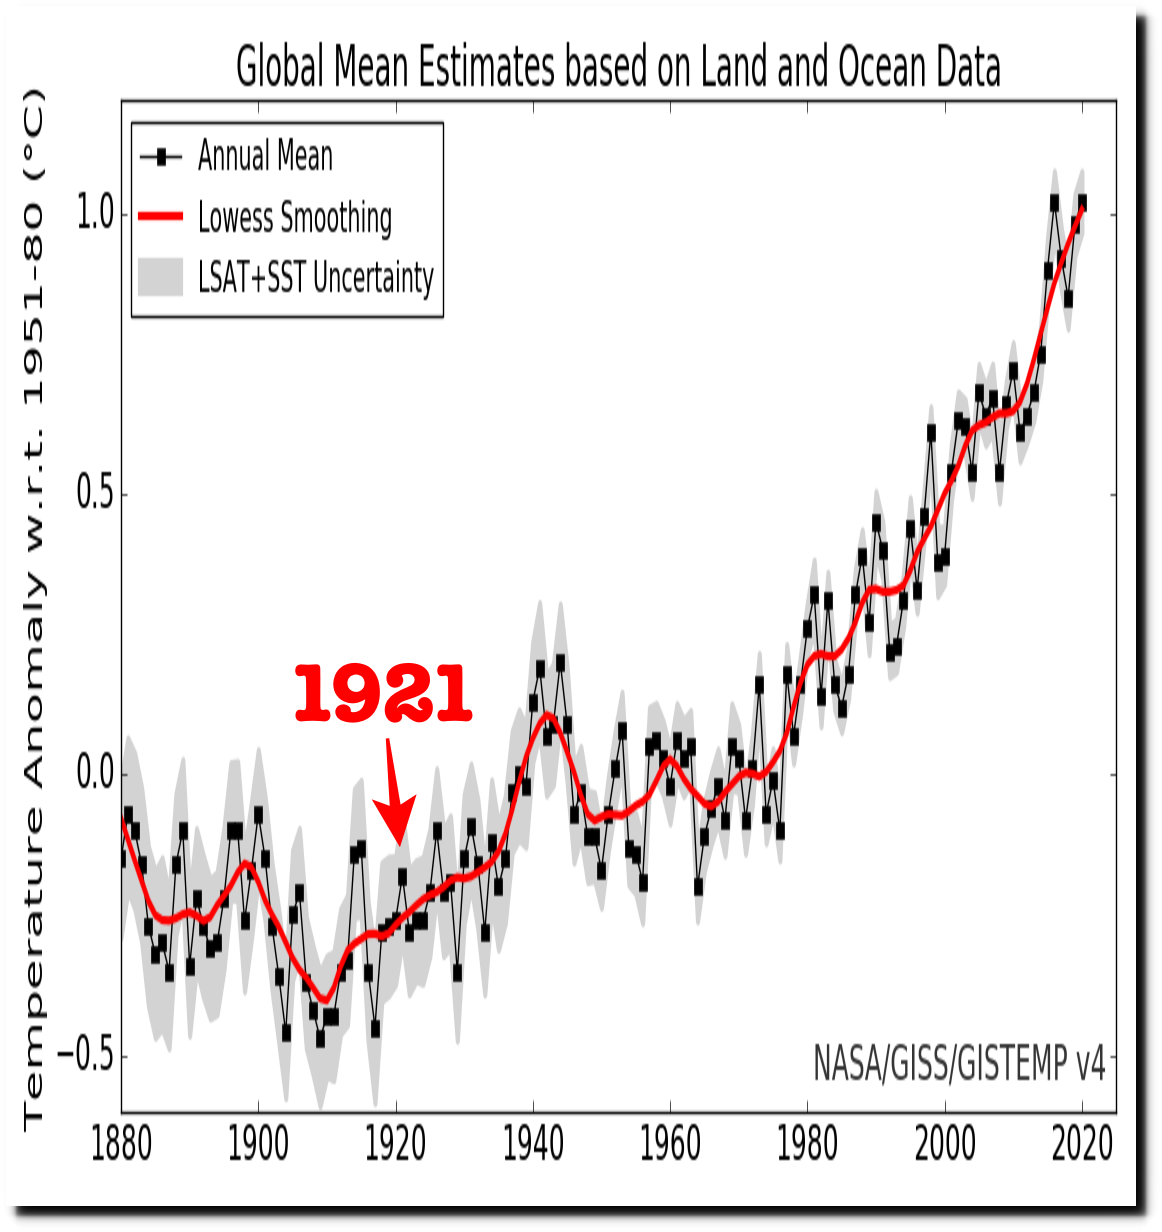
Yet NASA now shows 1921 was one of the coldest years on record.
CRUTEM4 shows that 1921 was hot. January was very warm in much of the world.
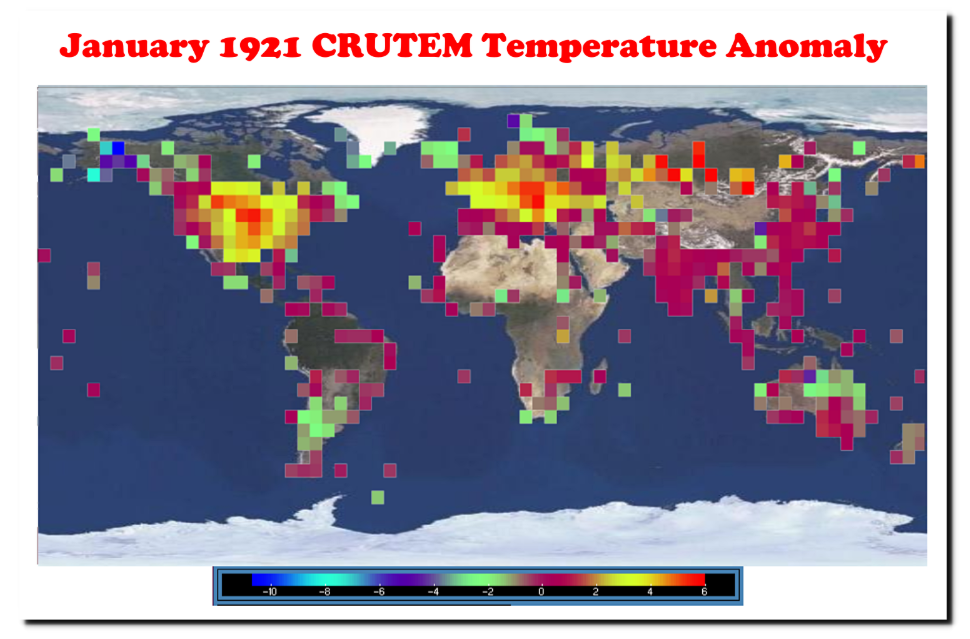
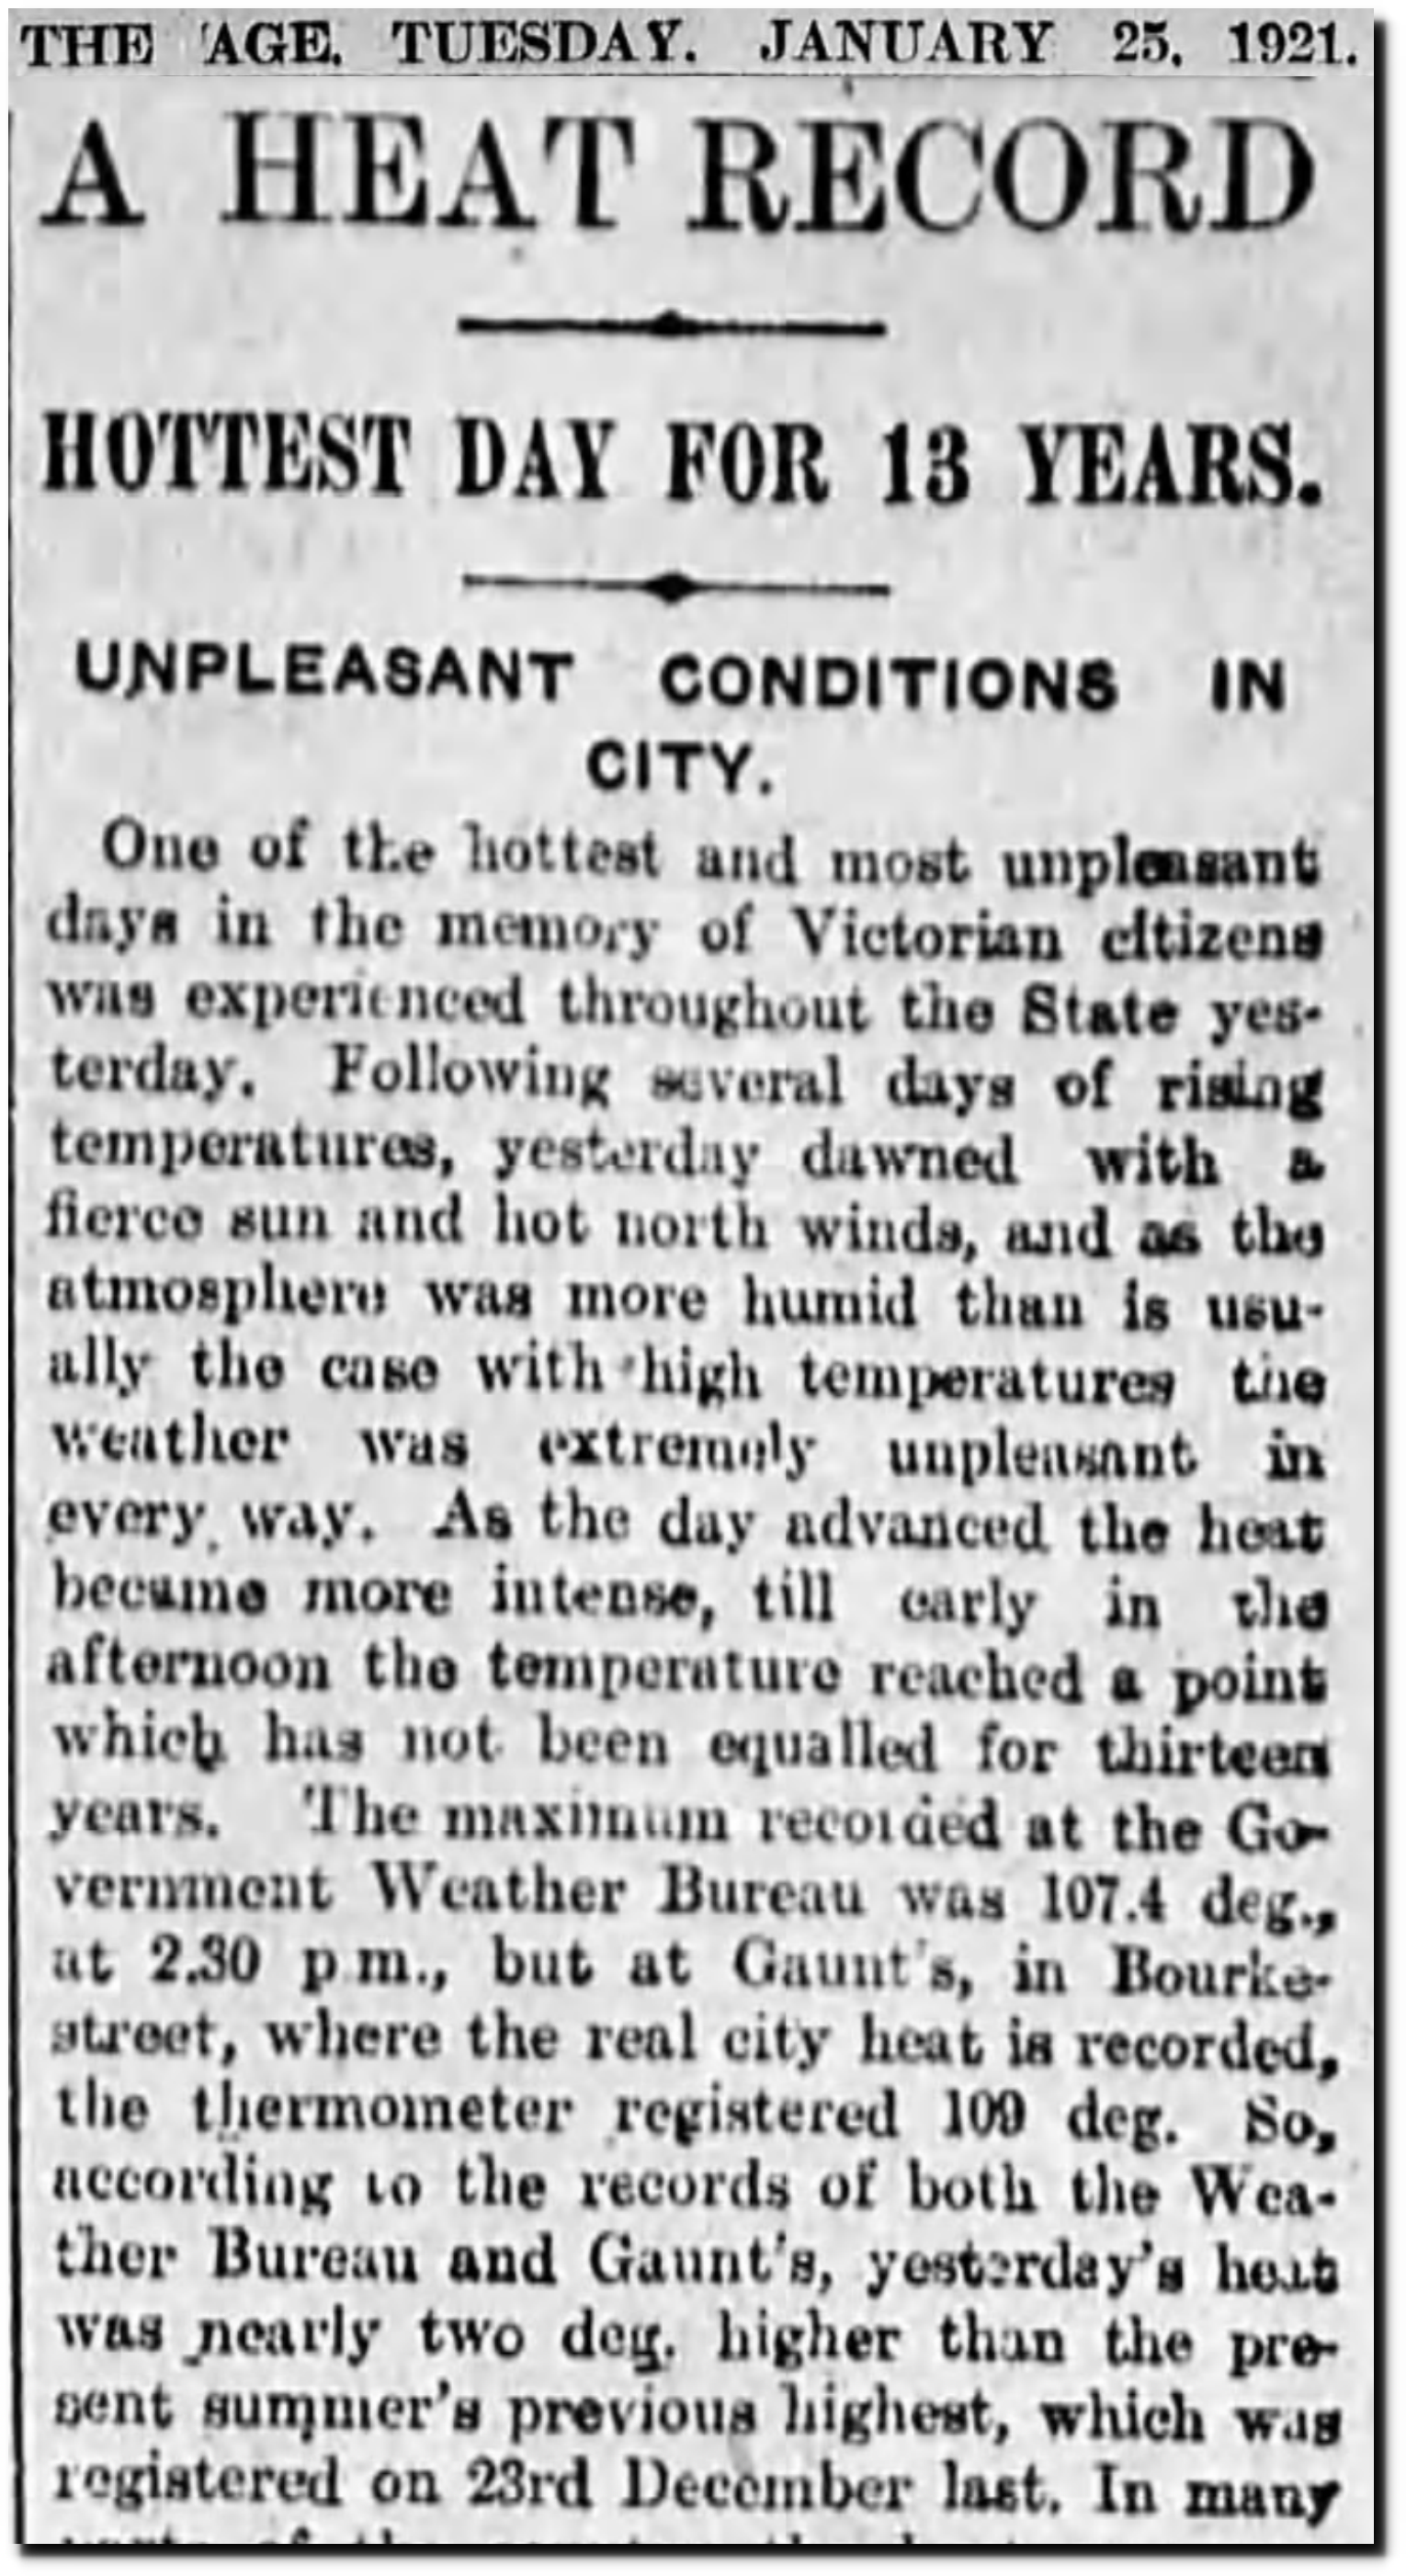
25 Jan 1921, Page 5 – The Age at Newspapers.com
This animation shows CRUTEM4 anomalies for all of 1921.
In 1921, the Arctic was very warm and glaciers were rapidly disappearing.

TimesMachine: February 25, 1923 – NYTimes.com
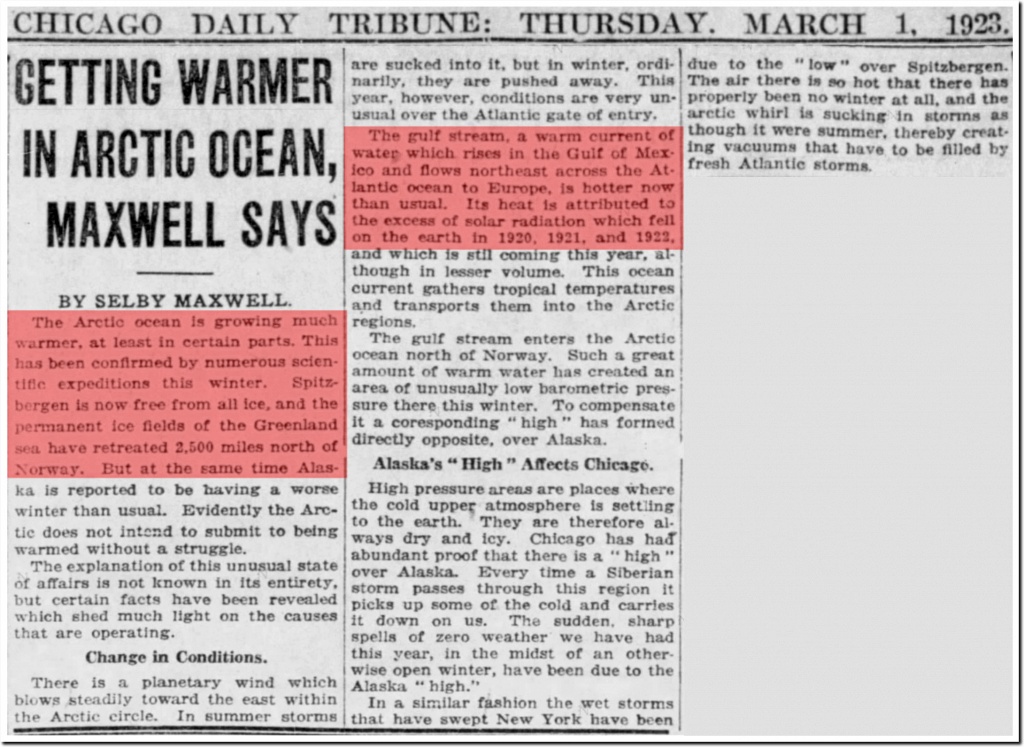
01 Mar 1923, 4 – Chicago Tribune at Newspapers.com
In 1922, the New York Times reported 100 degree temperatures in the Arctic.
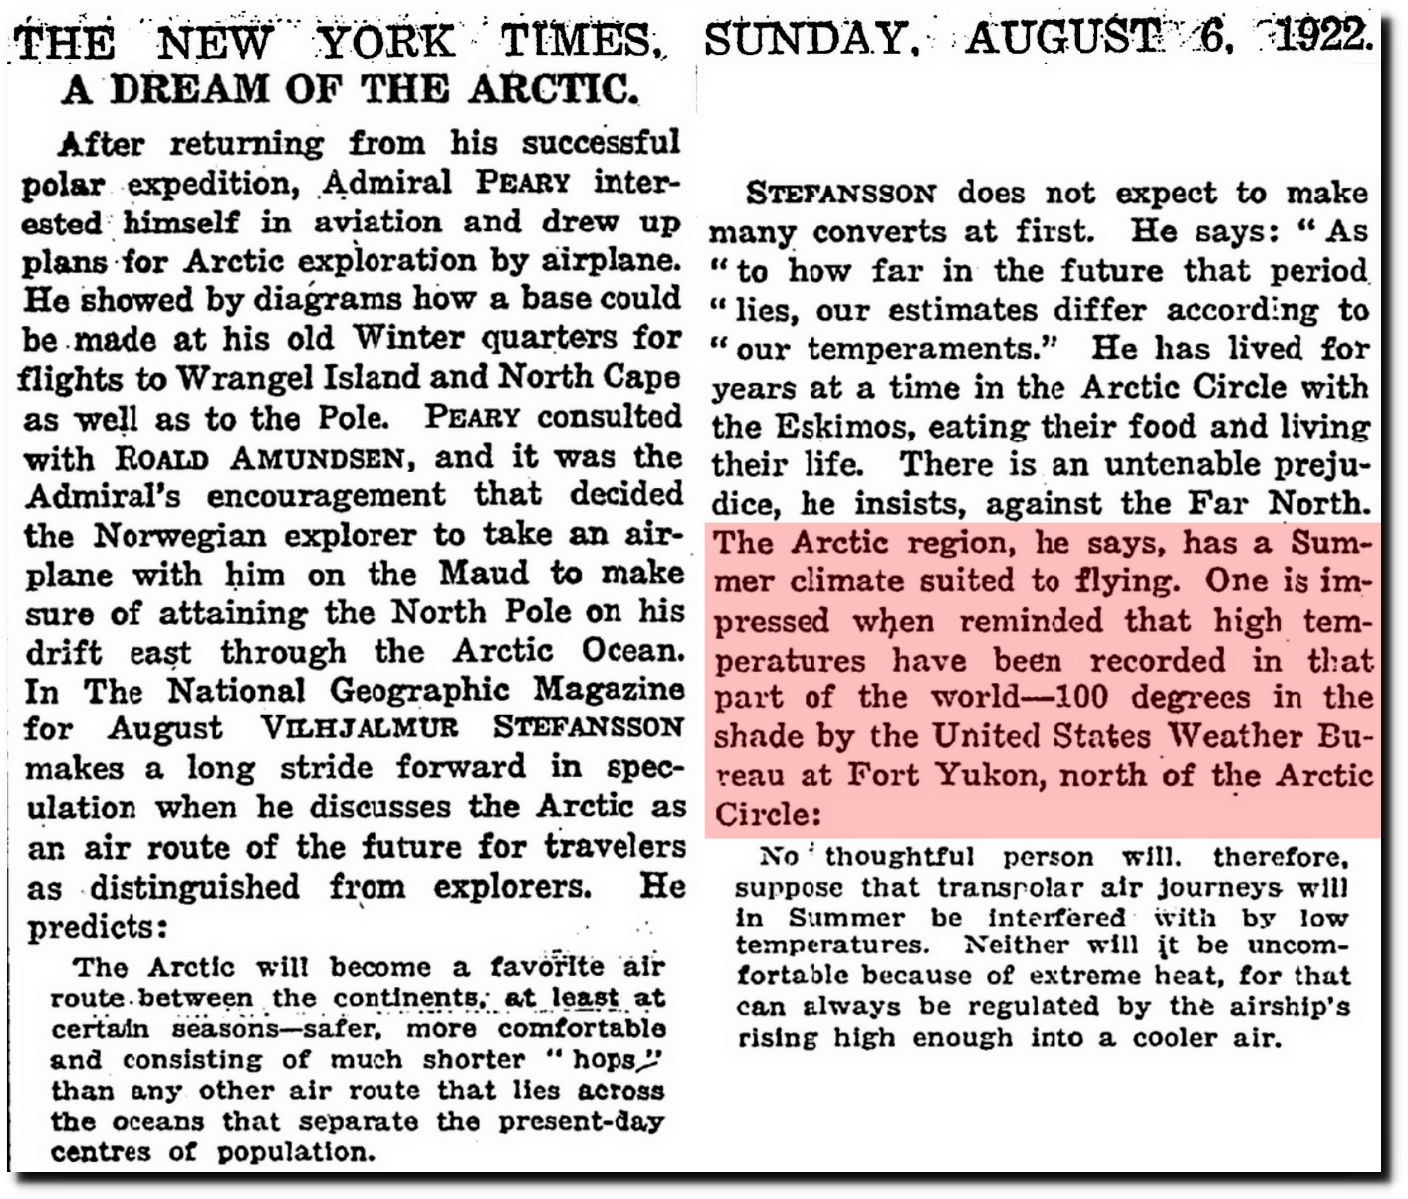
TimesMachine: August 6, 1922 – NYTimes.com

National Geographic Magazine Archive
The ice between Alaska and the North Pole was thin, rotten new ice.
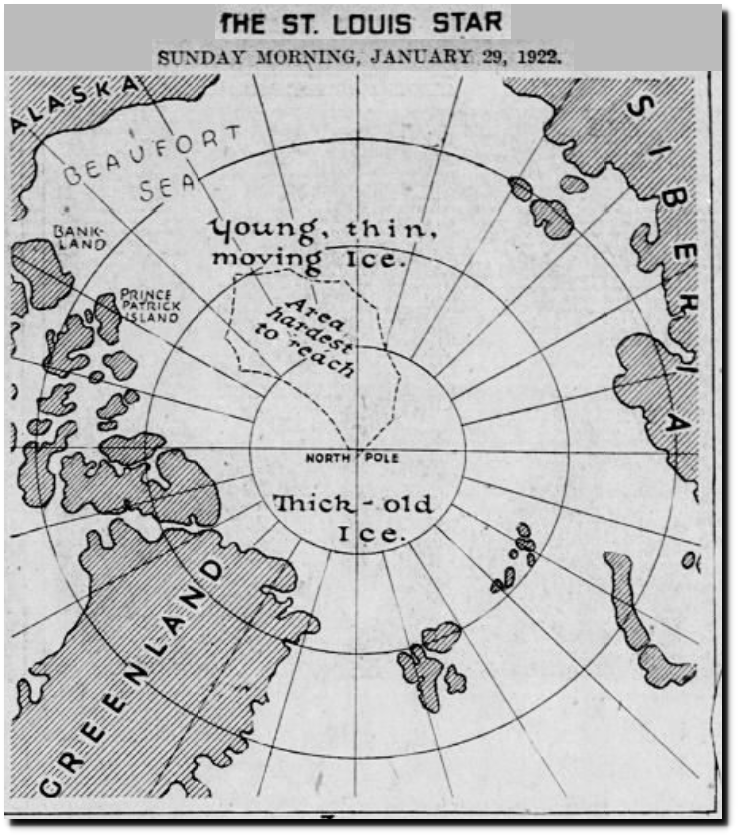
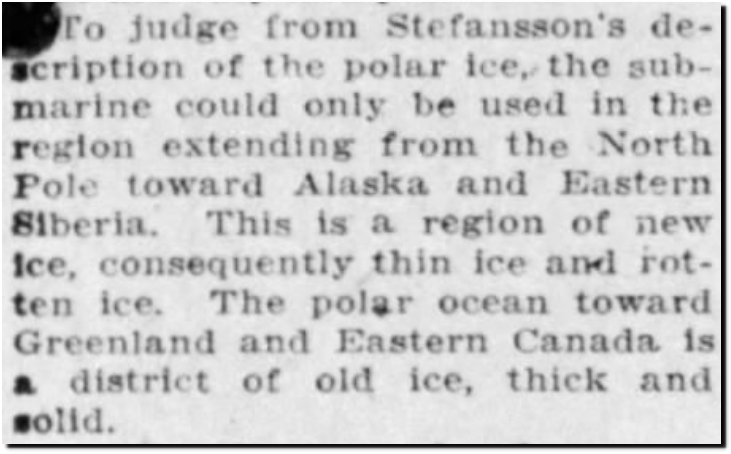
29 Jan 1922, Page 35 – The St. Louis Star and Times at Newspapers.com
Much of the world was experiencing exceptional heat, including Alaska.
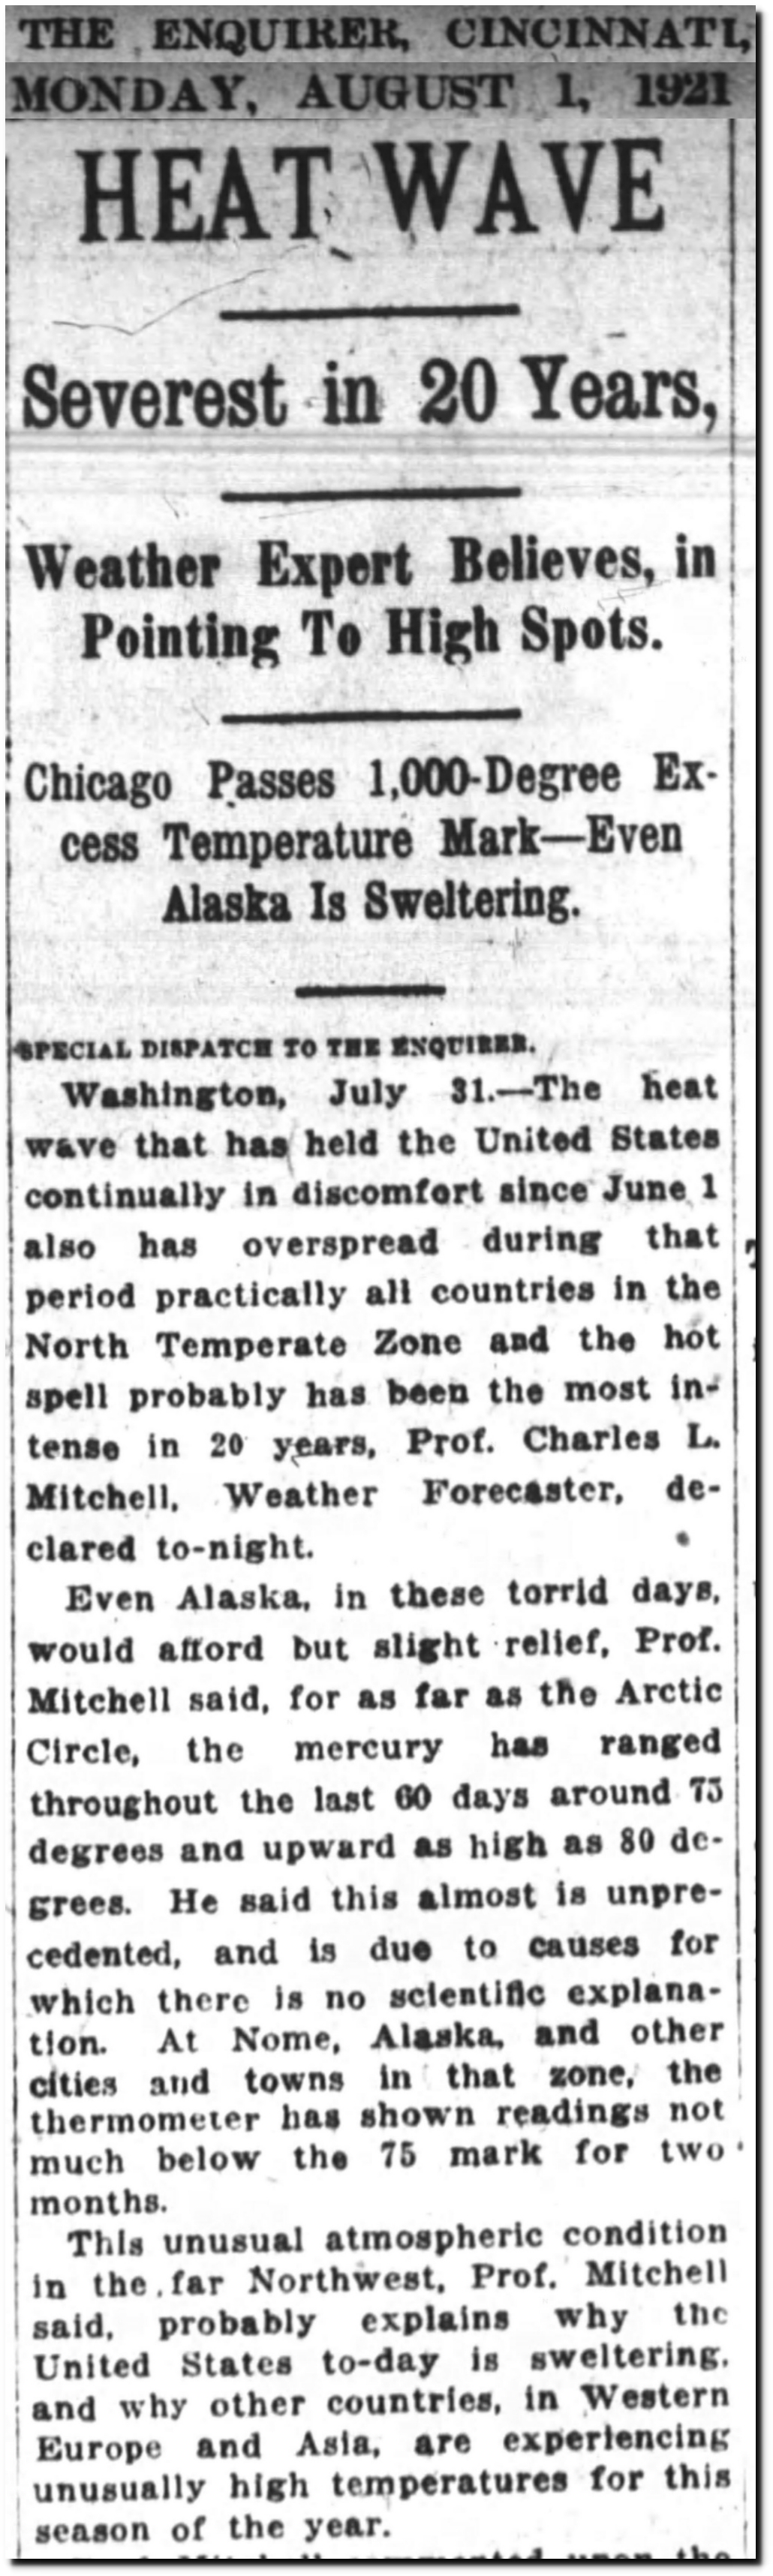
01 Aug 1921, Page 4 – The Cincinnati Enquirer at Newspapers.com
 14 Aug 1922 – Misplaced Tropical Heat. – Trove
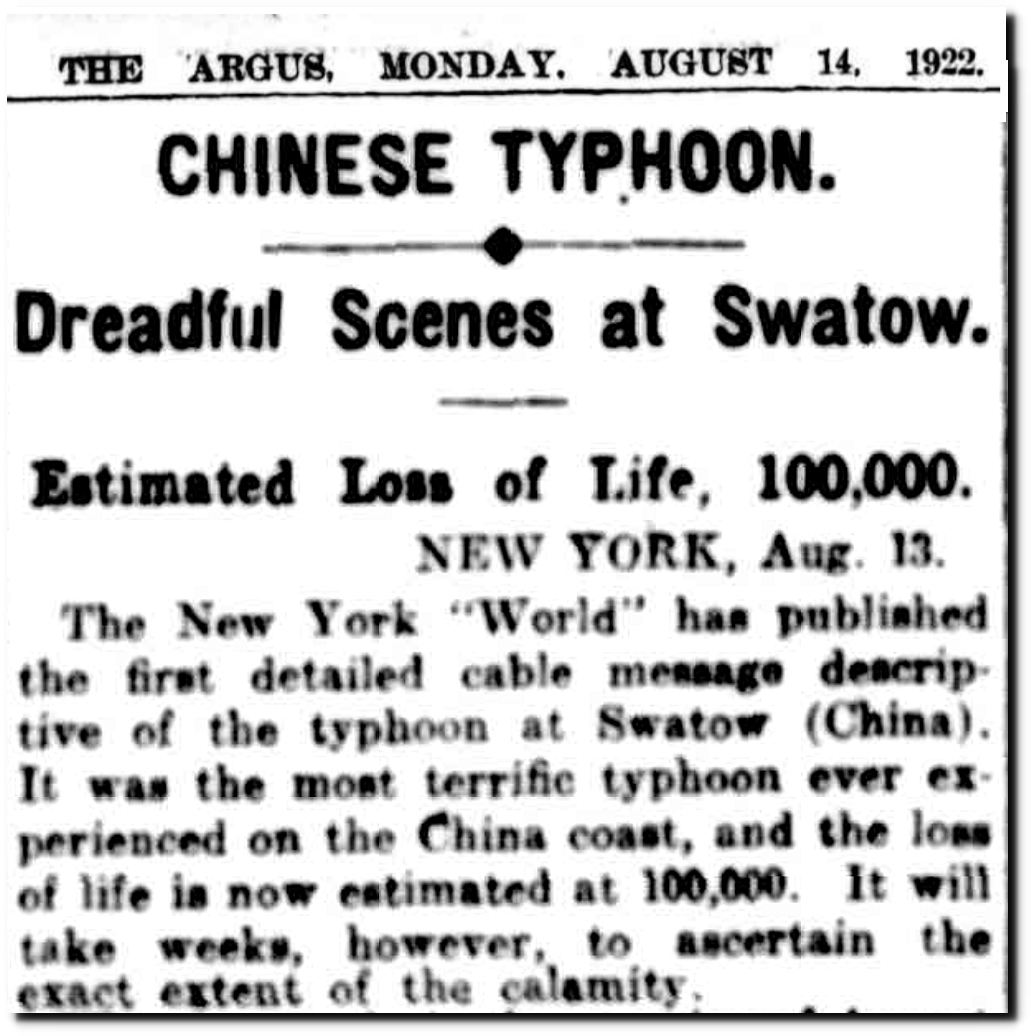
14 Aug 1922 – CHINESE TYPHOON. – Trove
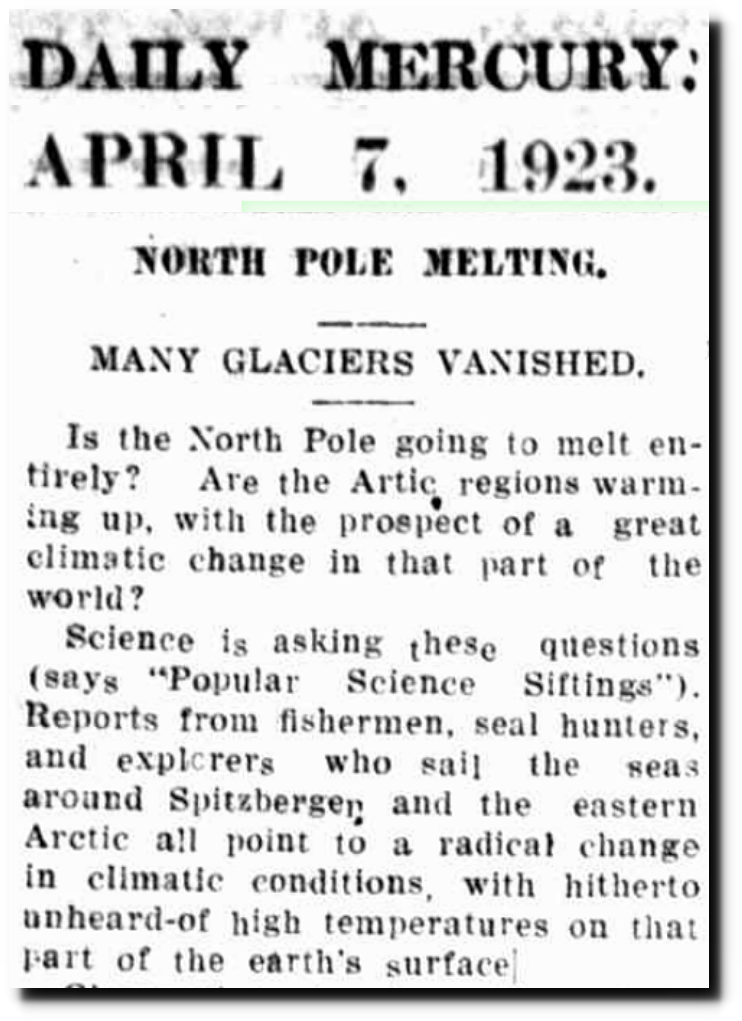
07 Apr 1923 – NORTH POLE MELTING. – Trove
Glaciers in Glacier National Park were forecast to disappear before 1950.
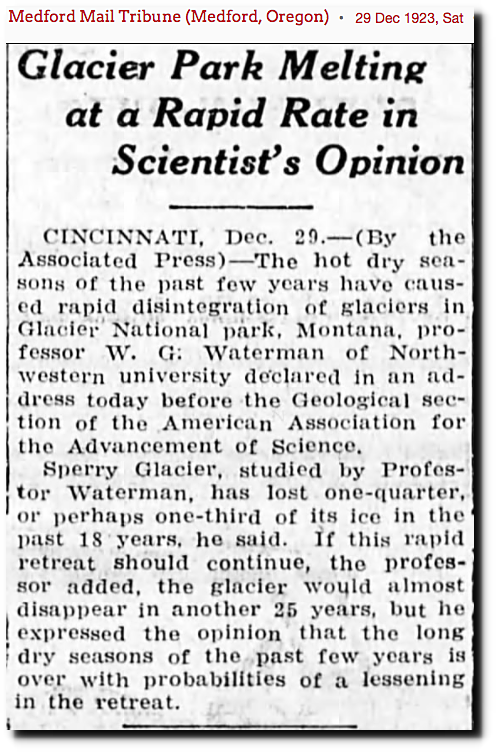
29 Dec 1923, Page 5 – at Newspapers.com
The world record heatwave occurred at Marble Bar, West Australia in 1923-1924. BOM has since deleted this article.
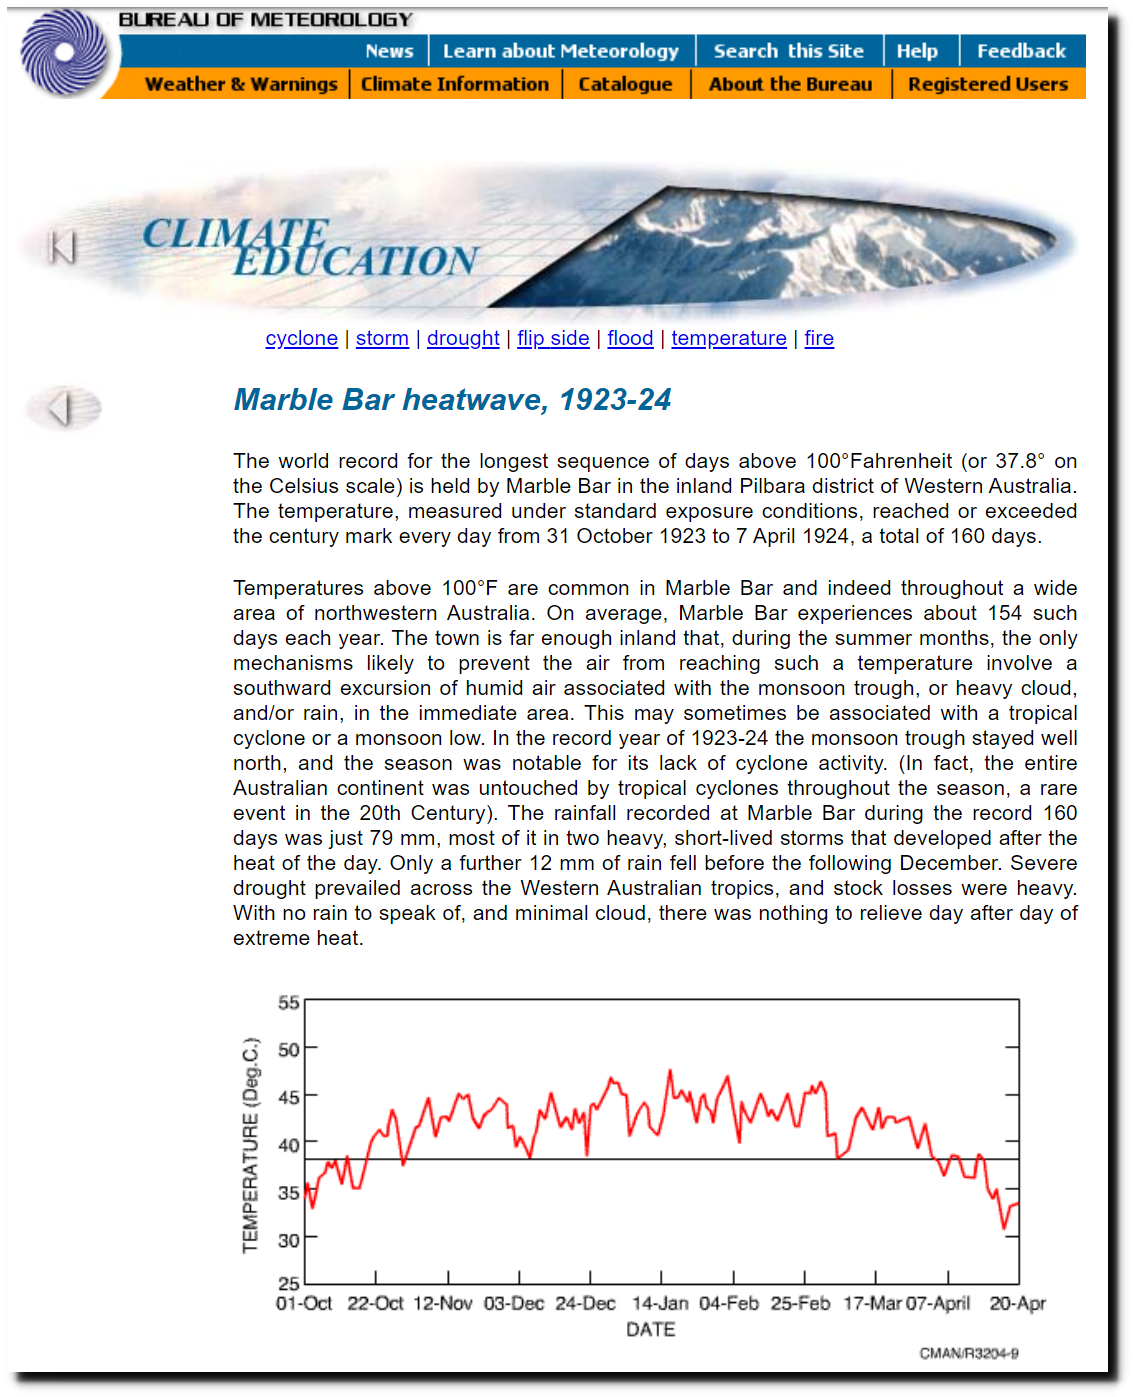
BOM – Australian Climate Extremes
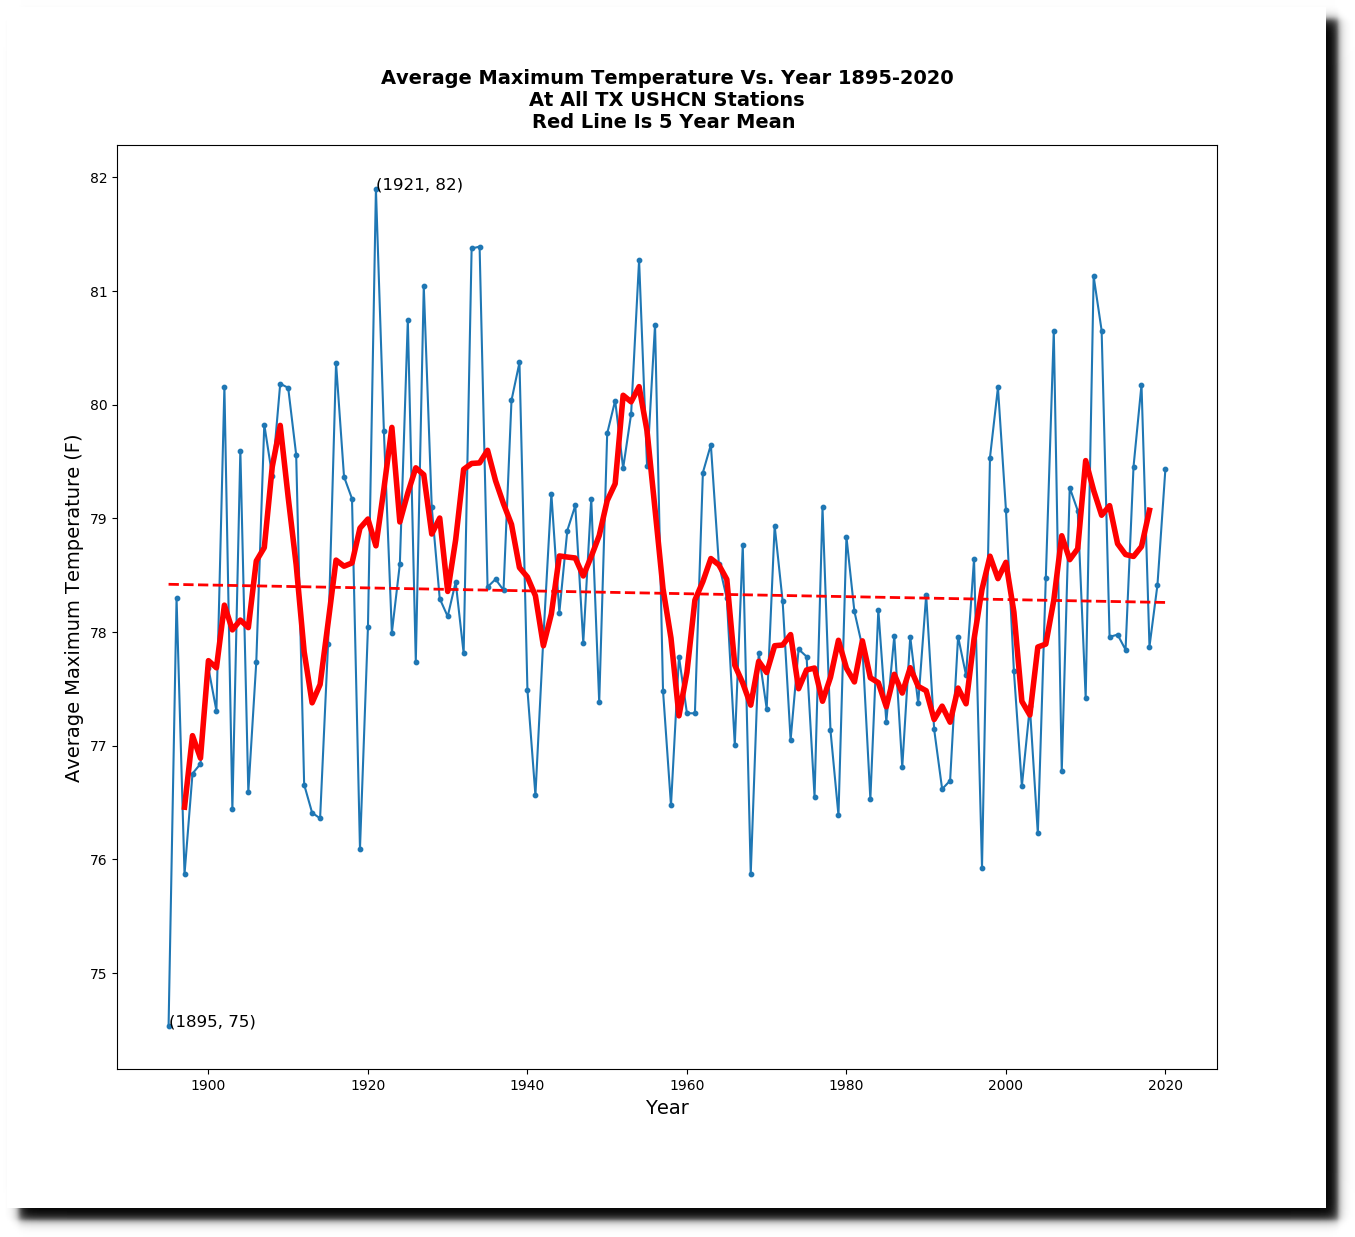
The average daily maximum temperature in Texas was highest on record in 1921.
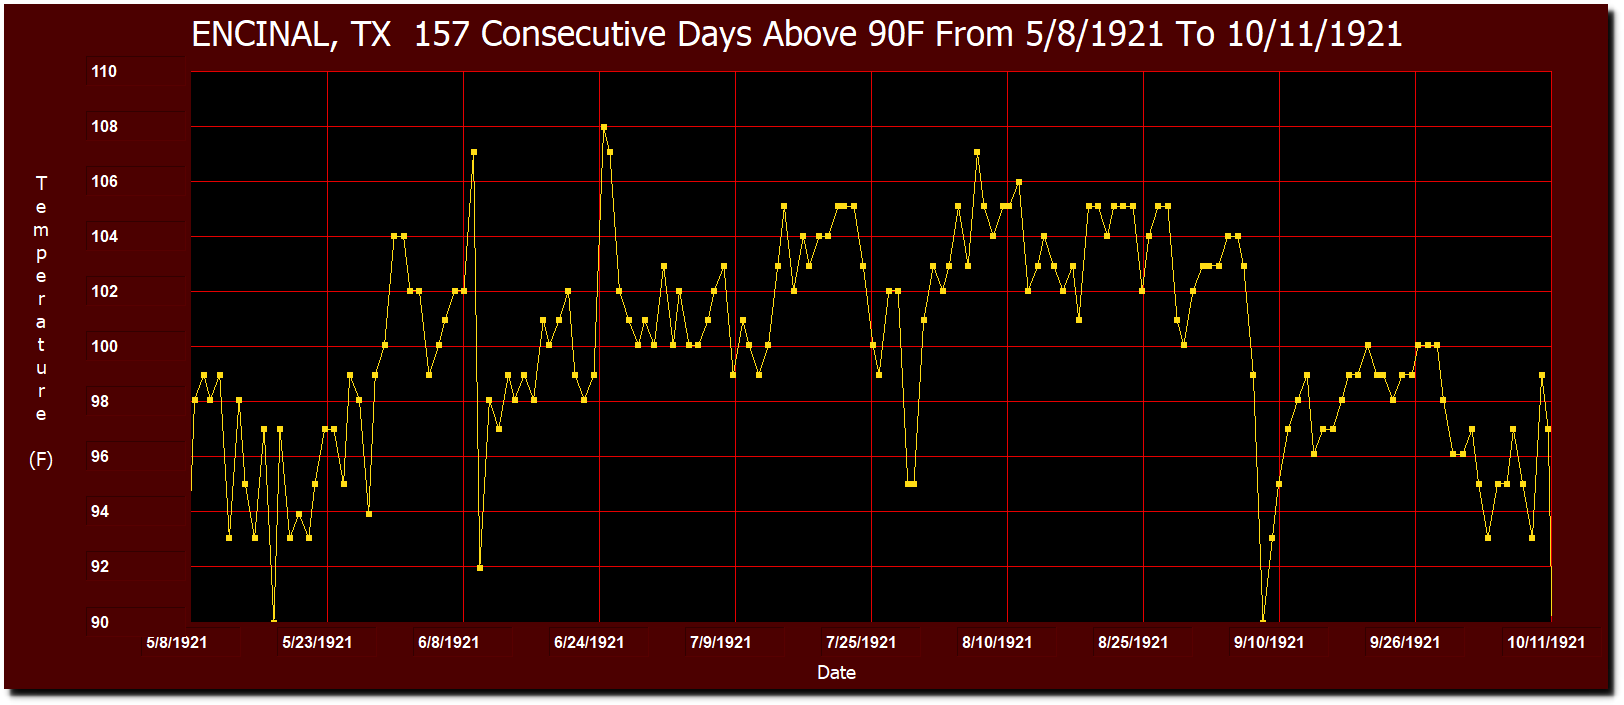
Encinal, Texas had 157 consecutive days above 90F in 1921, the Texas record.
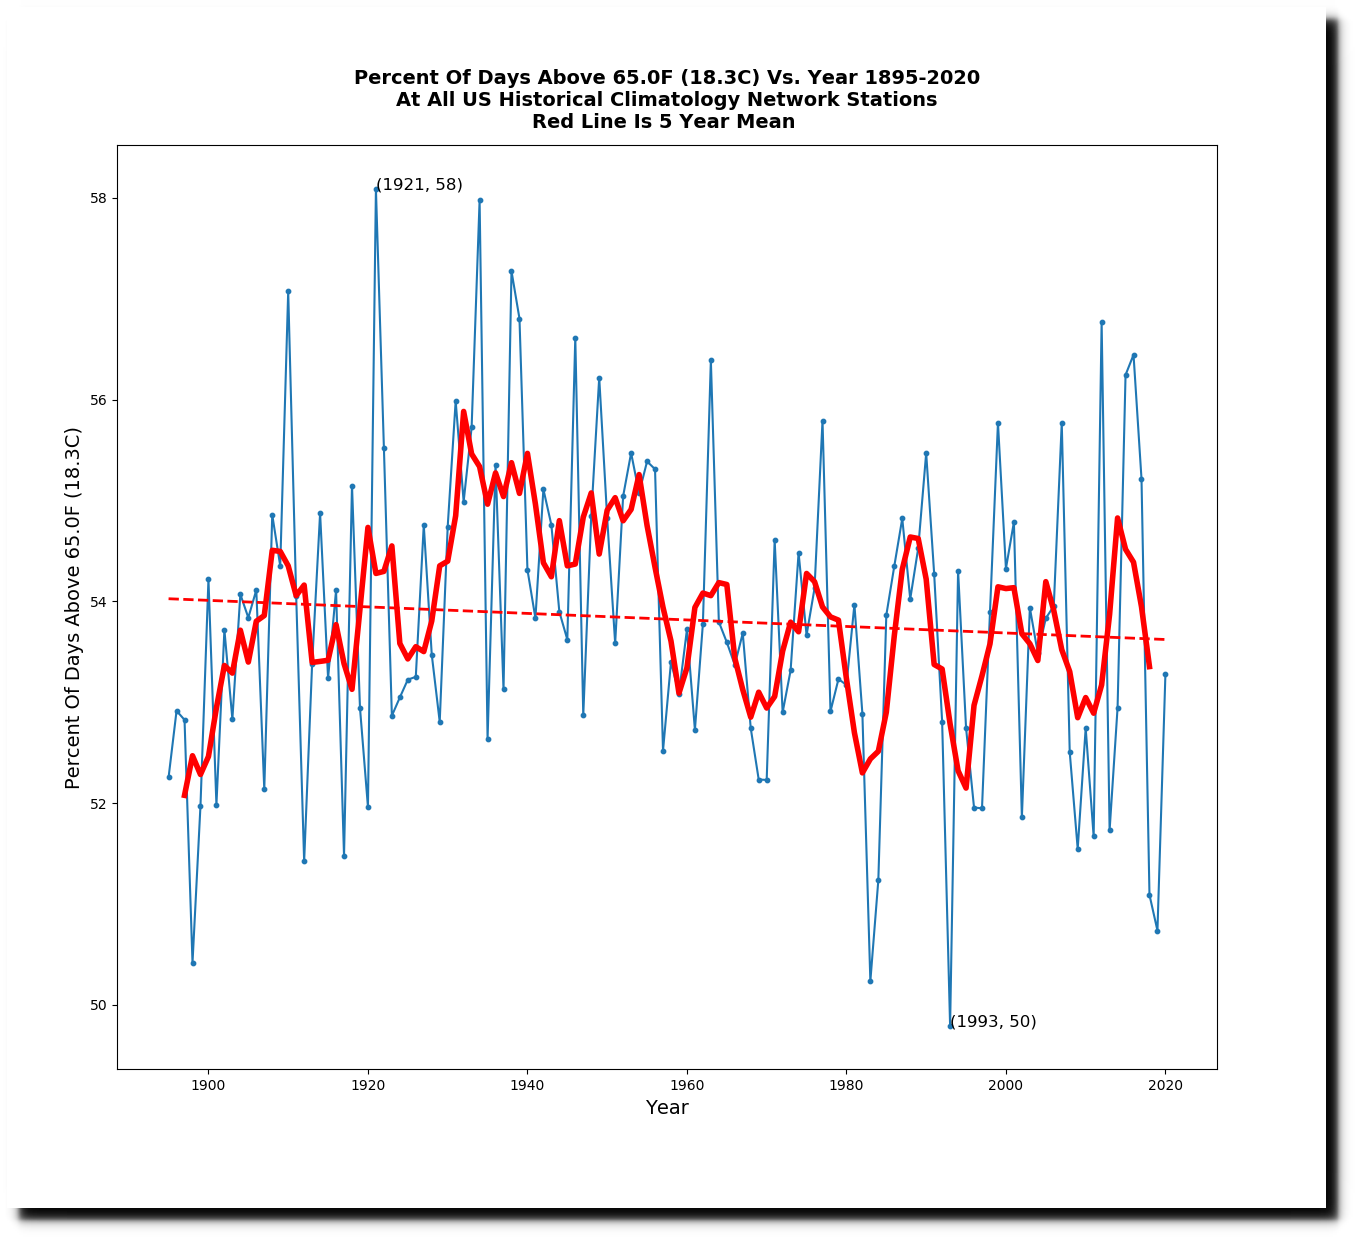
The percent of warm days in the US during 1921 was the highest on record, with 58% of days over 65F.
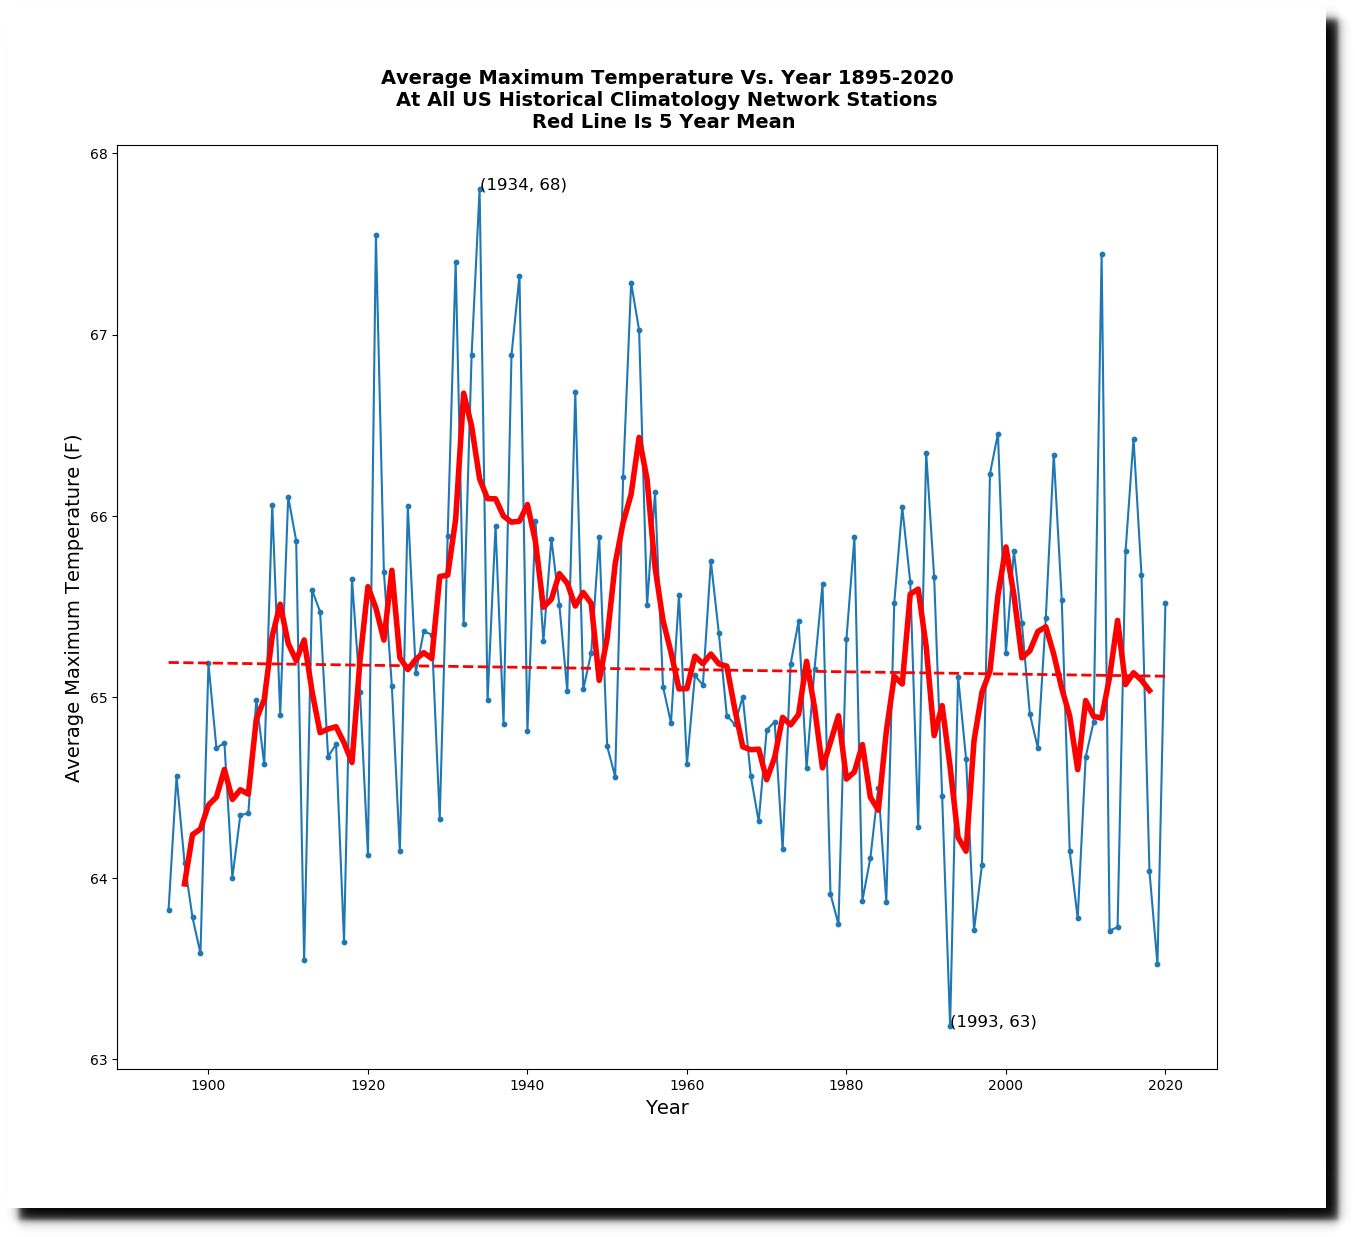
The average daily maximum temperature in the US during 1921 was second highest on record.
There was also lots of extreme weather in 1921.

11 Feb 1921, Page 2 – The Washington Post at Newspapers.com
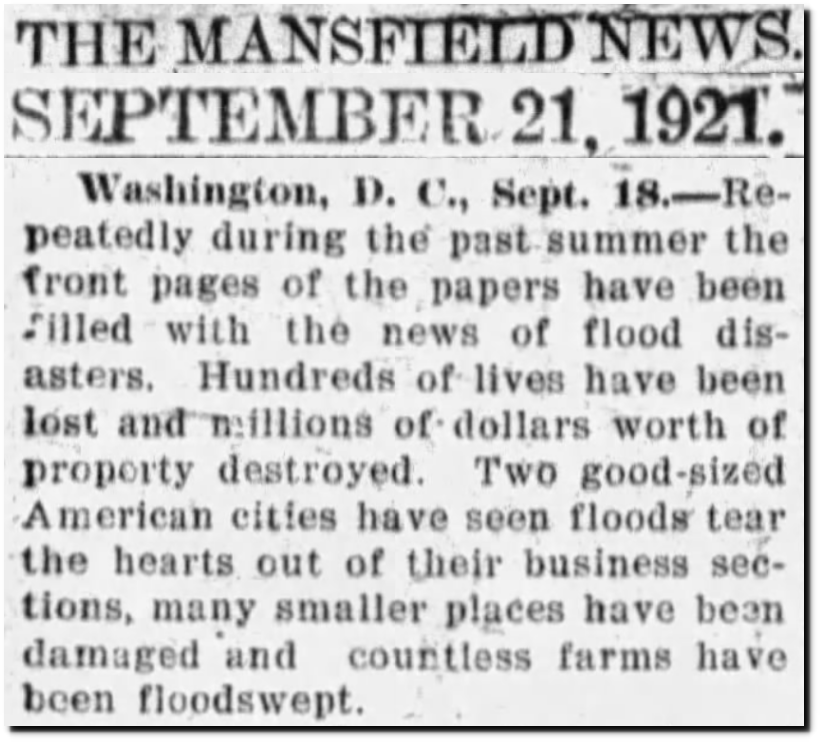
21 Sep 1921, 3 – News-Journal at Newspapers.com
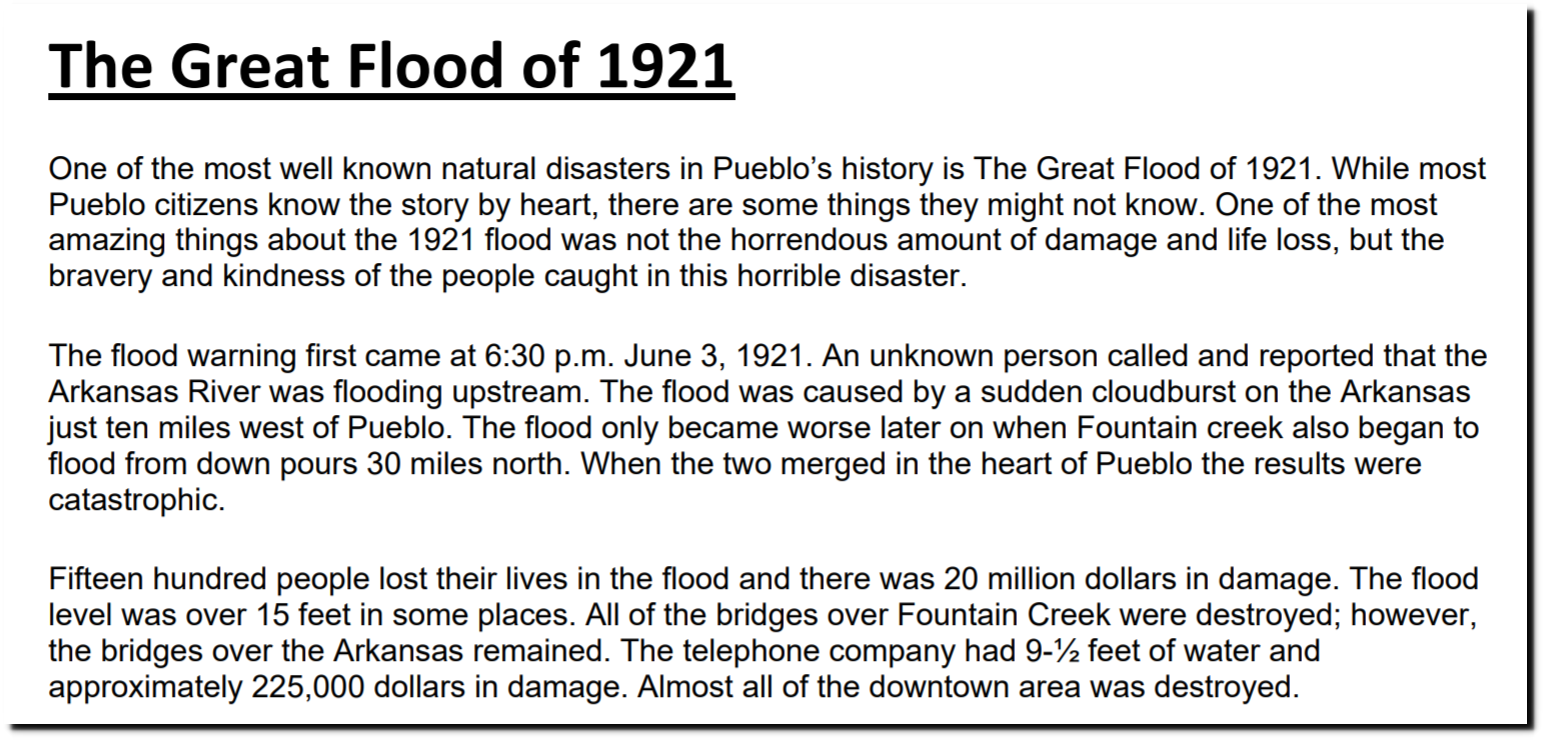
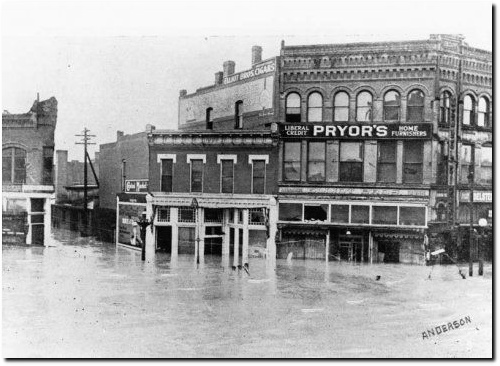
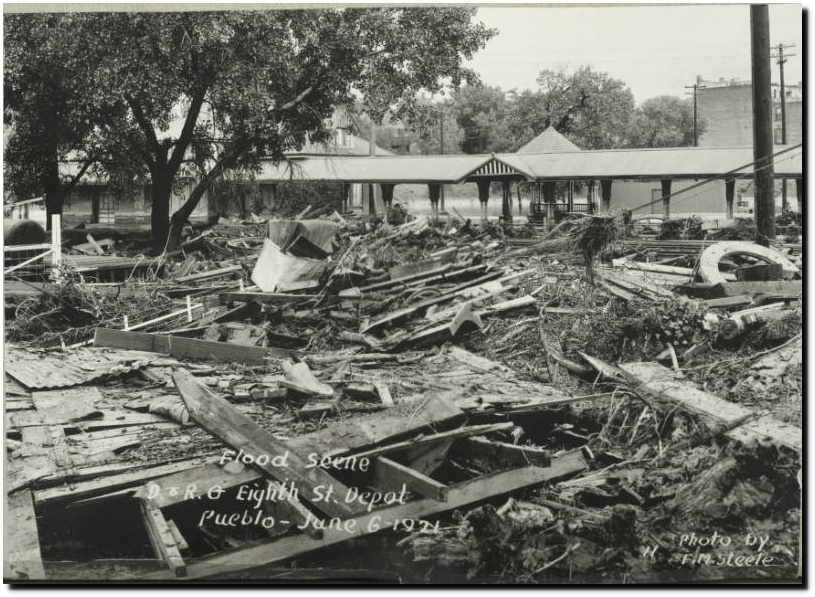
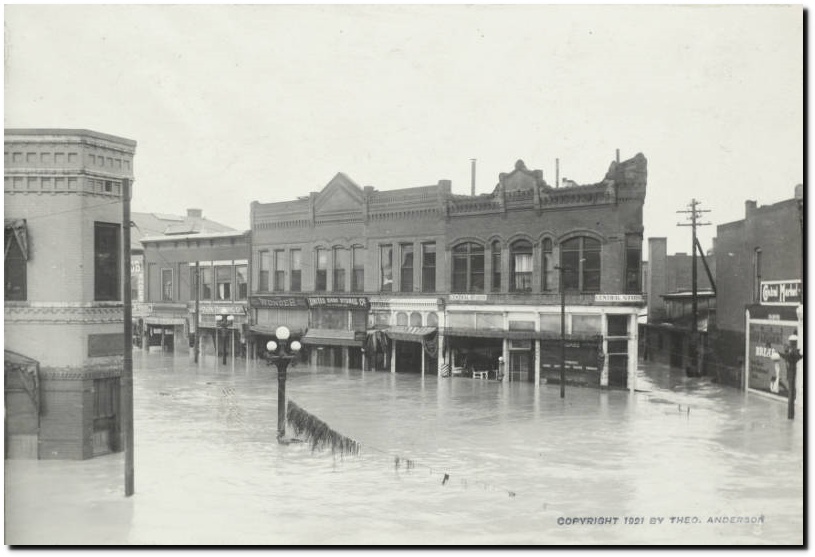
Pueblo, Colorado was largely wiped out by a flood during June, 1921. Much of Kansas suffered damage, and there was flooding on the Pecos River in New Mexico and Texas.
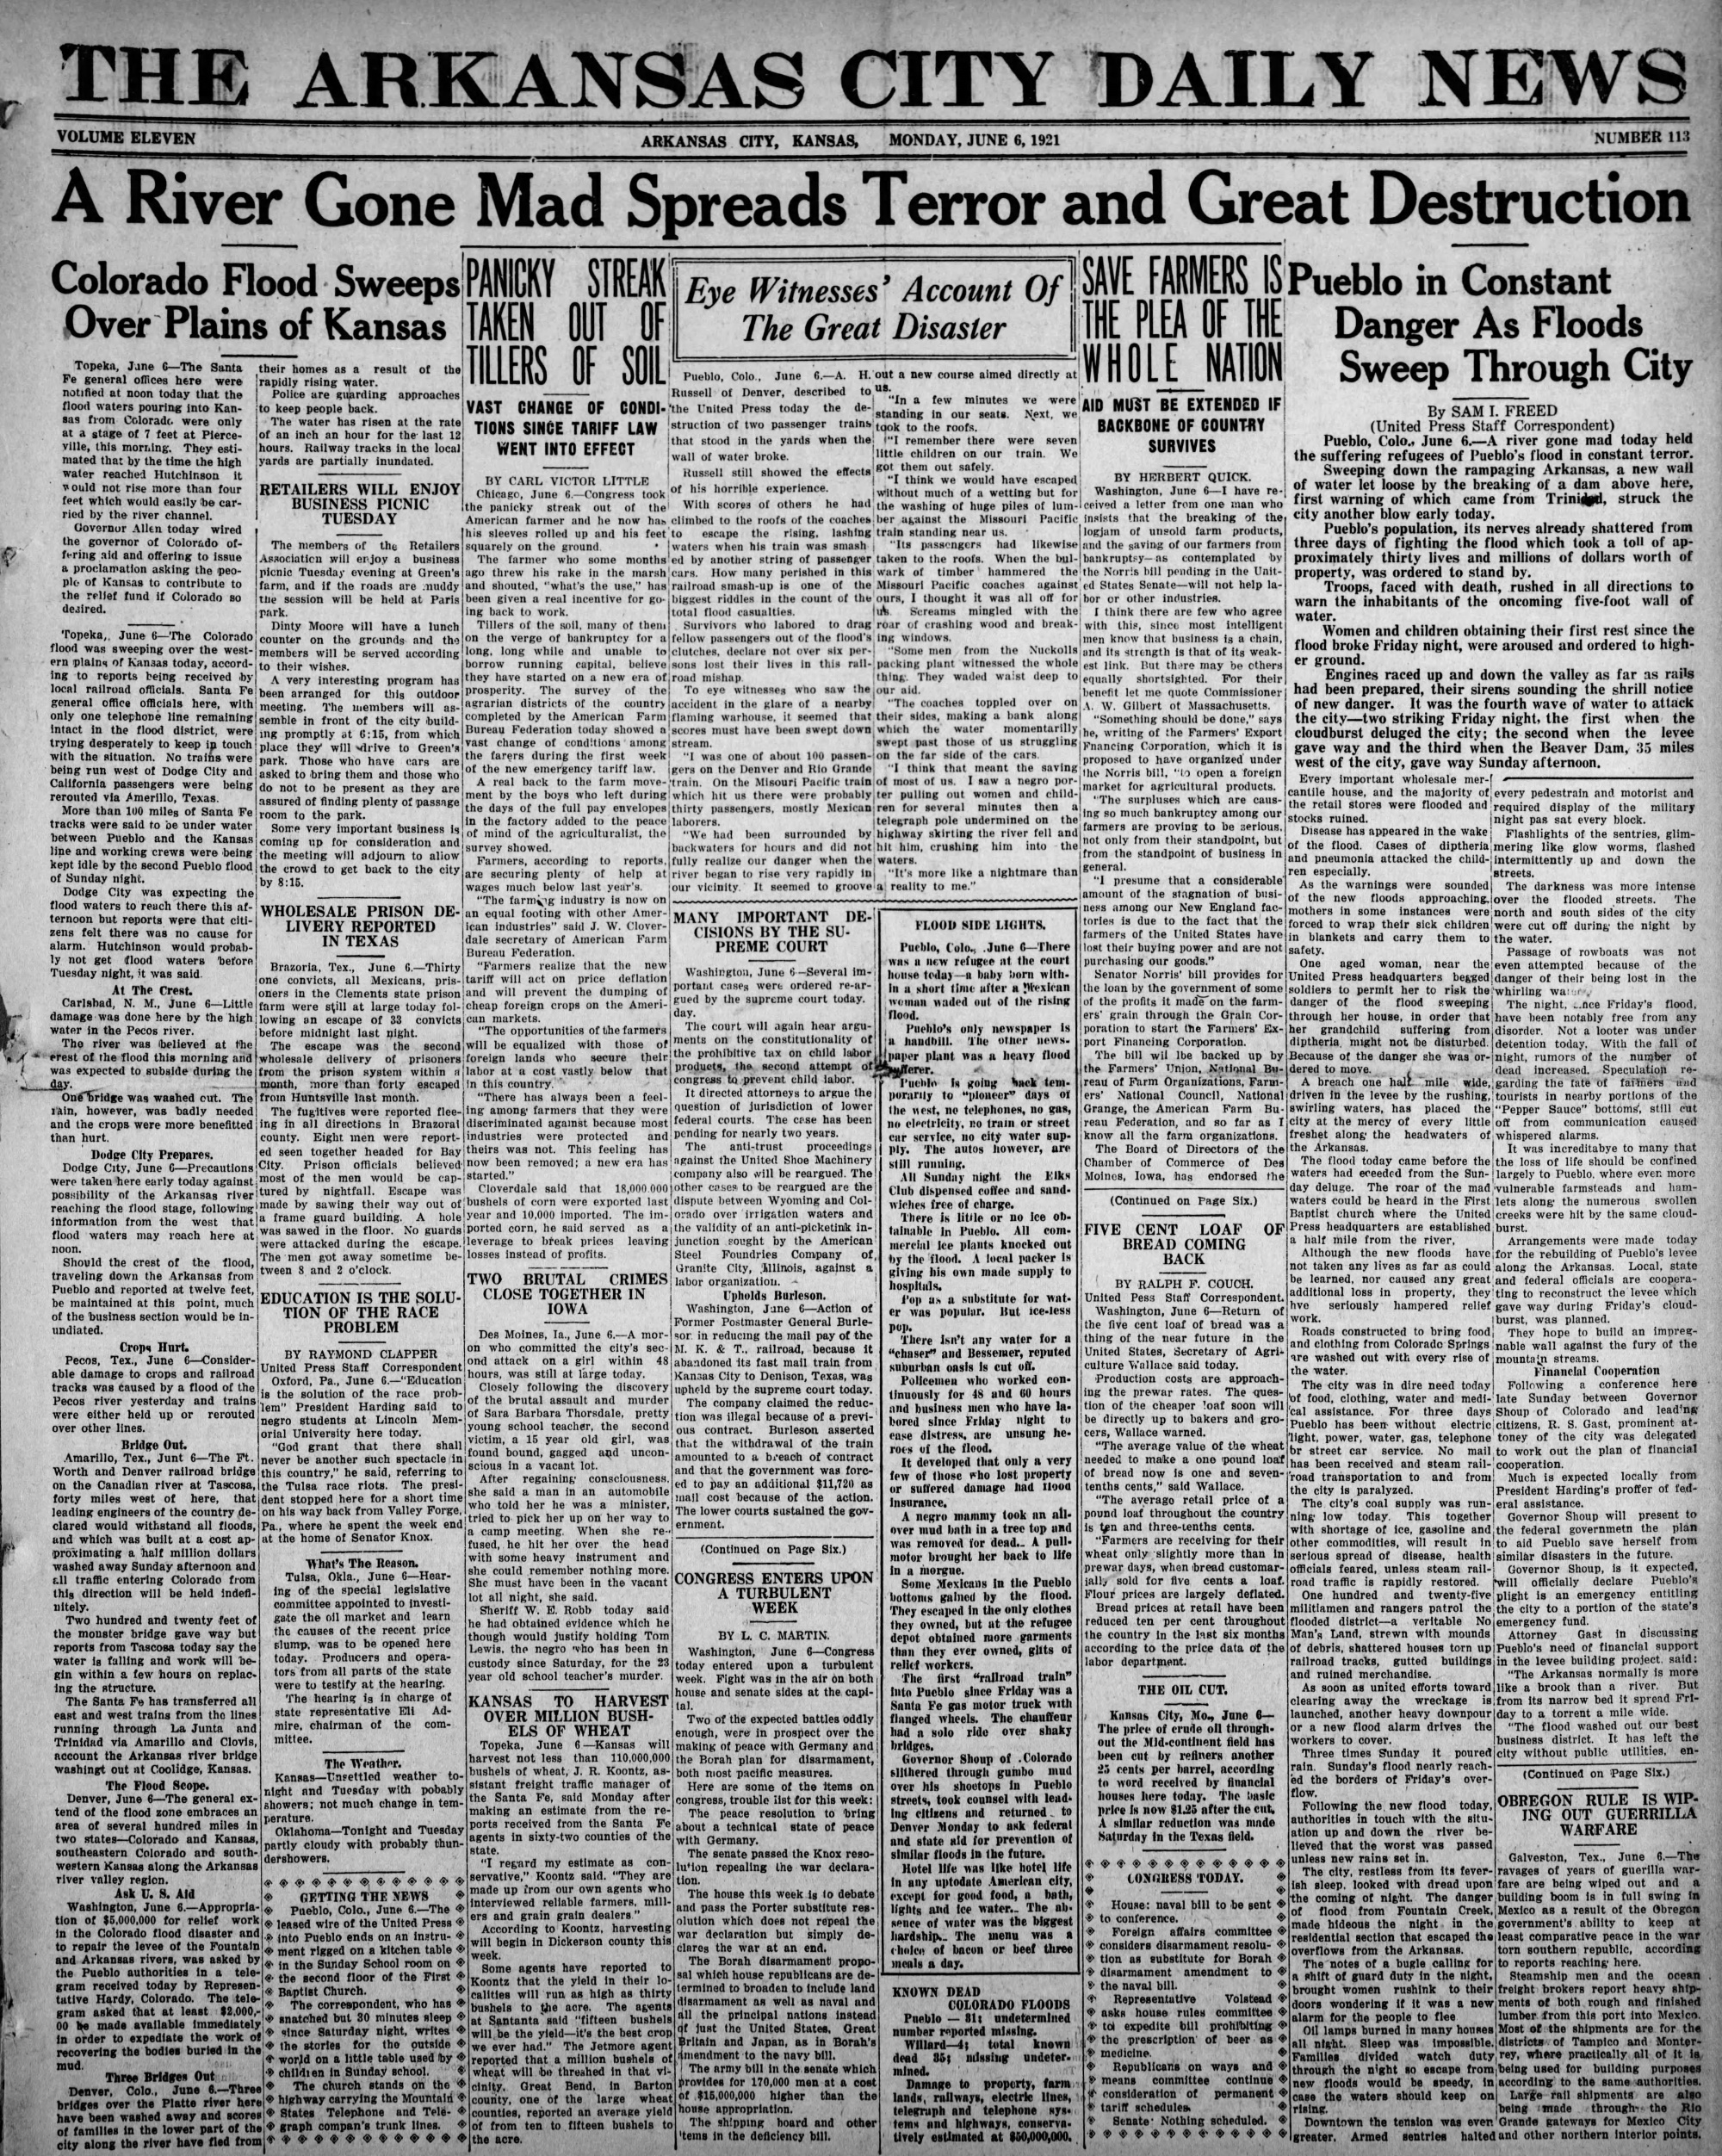
06 Jun 1921, 1 – The Arkansas City Daily News at Newspapers.com
It is estimated that 1,500 people in Pueblo, Colorado died during that flood.
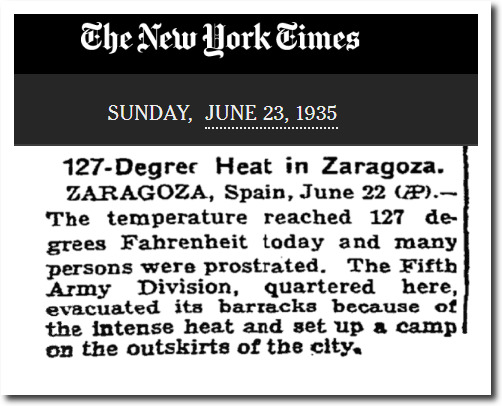 127-Degree Heat in Zaragoza. – The New York Times

17 Dec 1939, Page 15 – Harrisburg Sunday Courier

13 Oct 1940, Page 76 – Hartford Courant at Newspapers.com
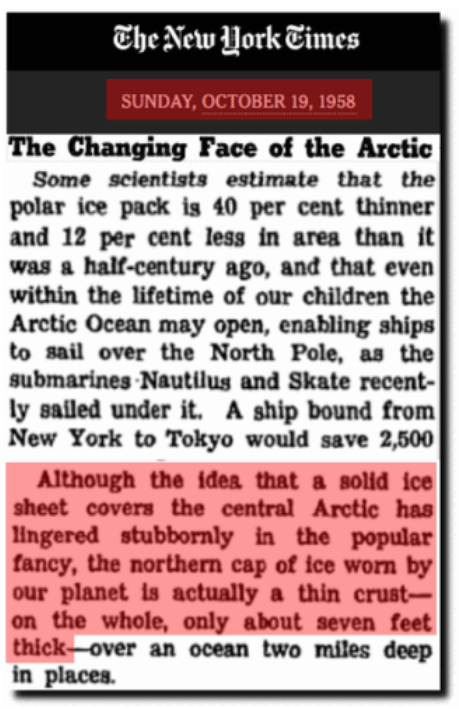
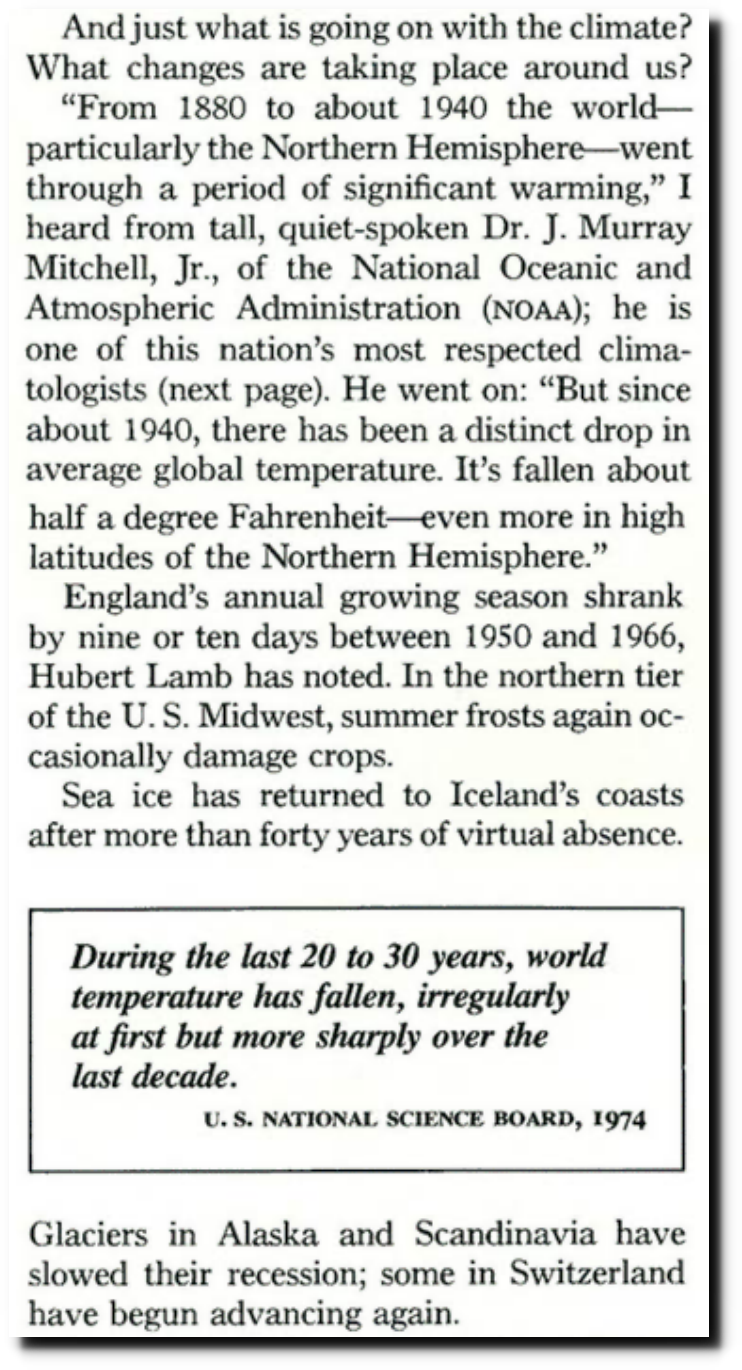
The Changing Face of the Arctic; The Changing Face of the Arctic – The New York Times
14 Jul 1974, Page 1 – Lincoln Evening Journal at Newspapers.com
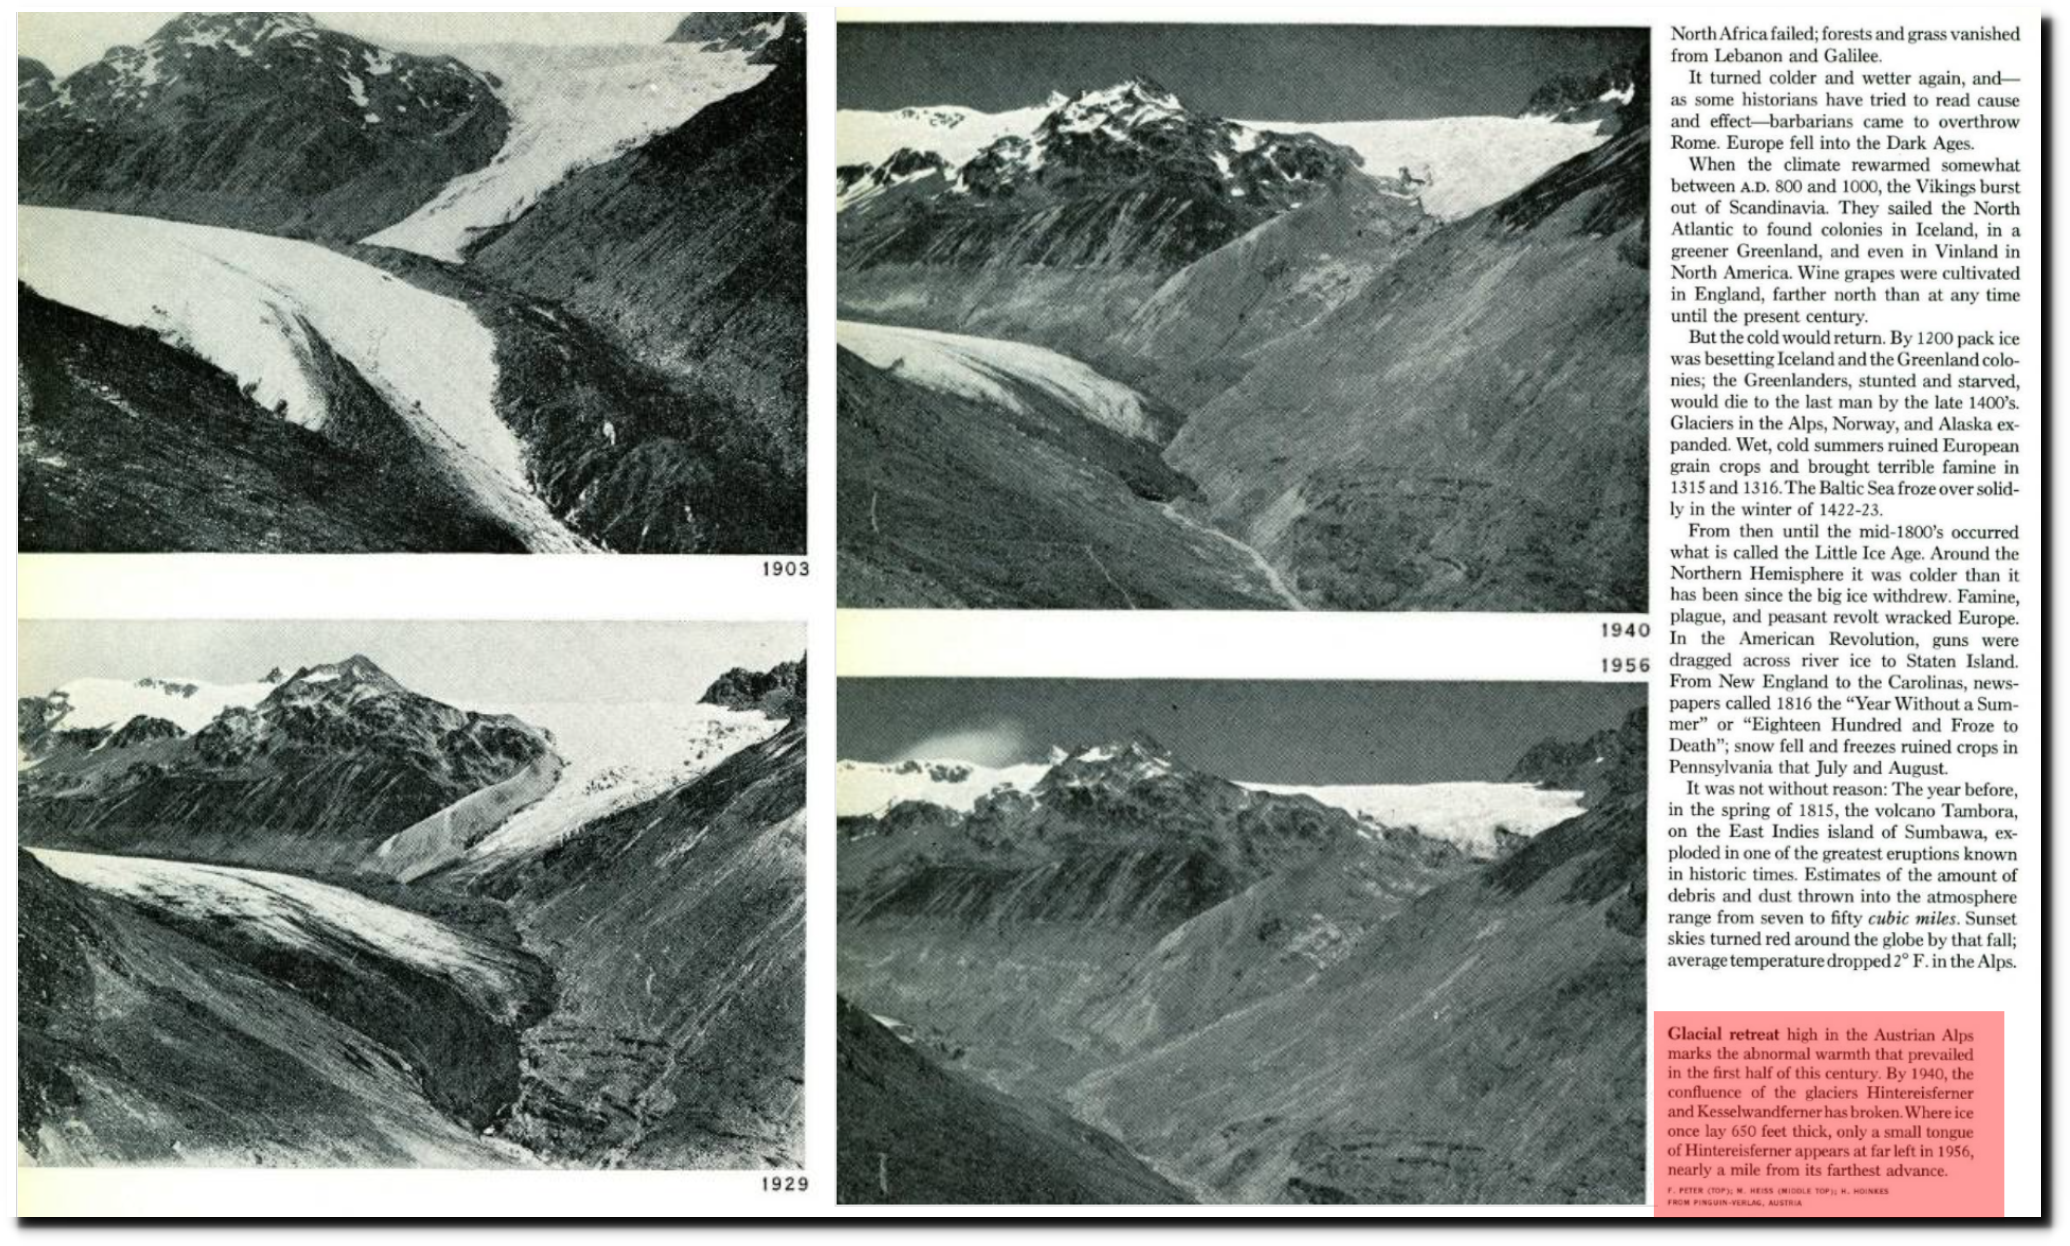
National Geographic Magazine Archive


18 Jul 1963 – Glaciers Grow In Norway – Trove
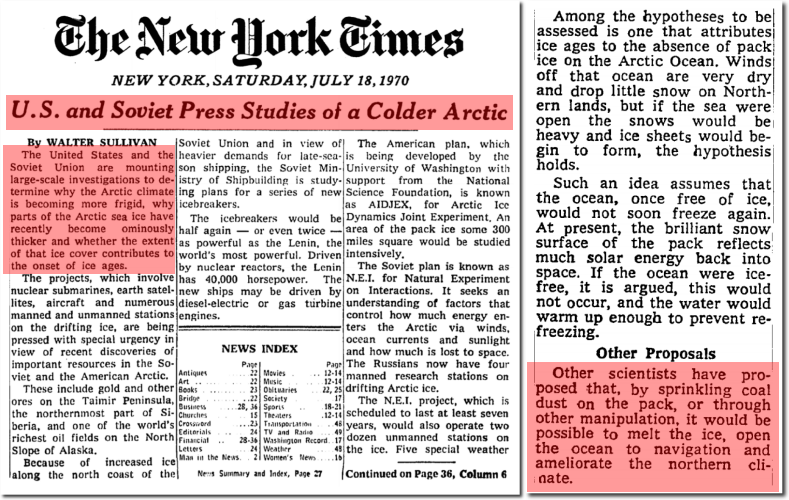
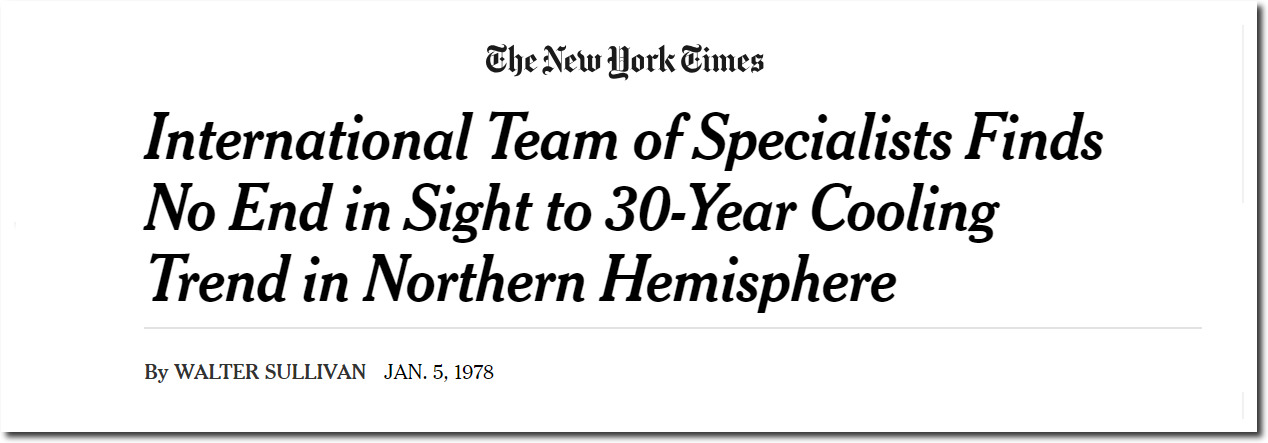
U.S. and Soviet Press Studies of a Colder Arctic – The New York Times
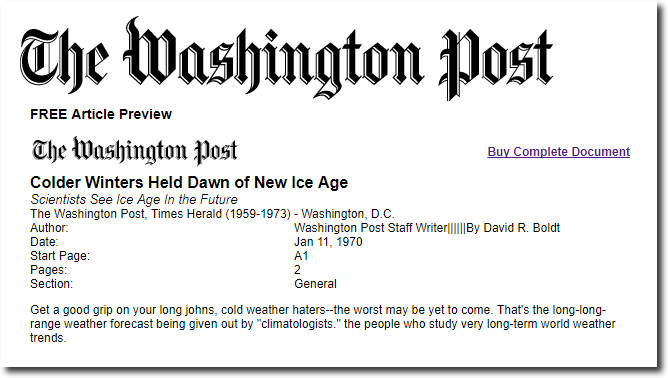
washingtonpost.com – search nation, world, technology and Washington area news archives.
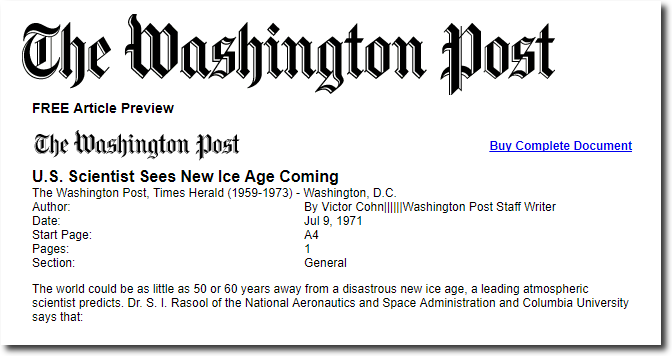
U.S. Scientist Sees New Ice Age Coming
The National Geographic Archive | November 1976 | page 1

Wood for Trees: Interactive Graphs
Posted in Uncategorized
Leave a comment
Humans Causing Climate Change Superstition
The breathless headlines have arrived : “Humans are causing climate change: It’s just been proven directly for the first time”
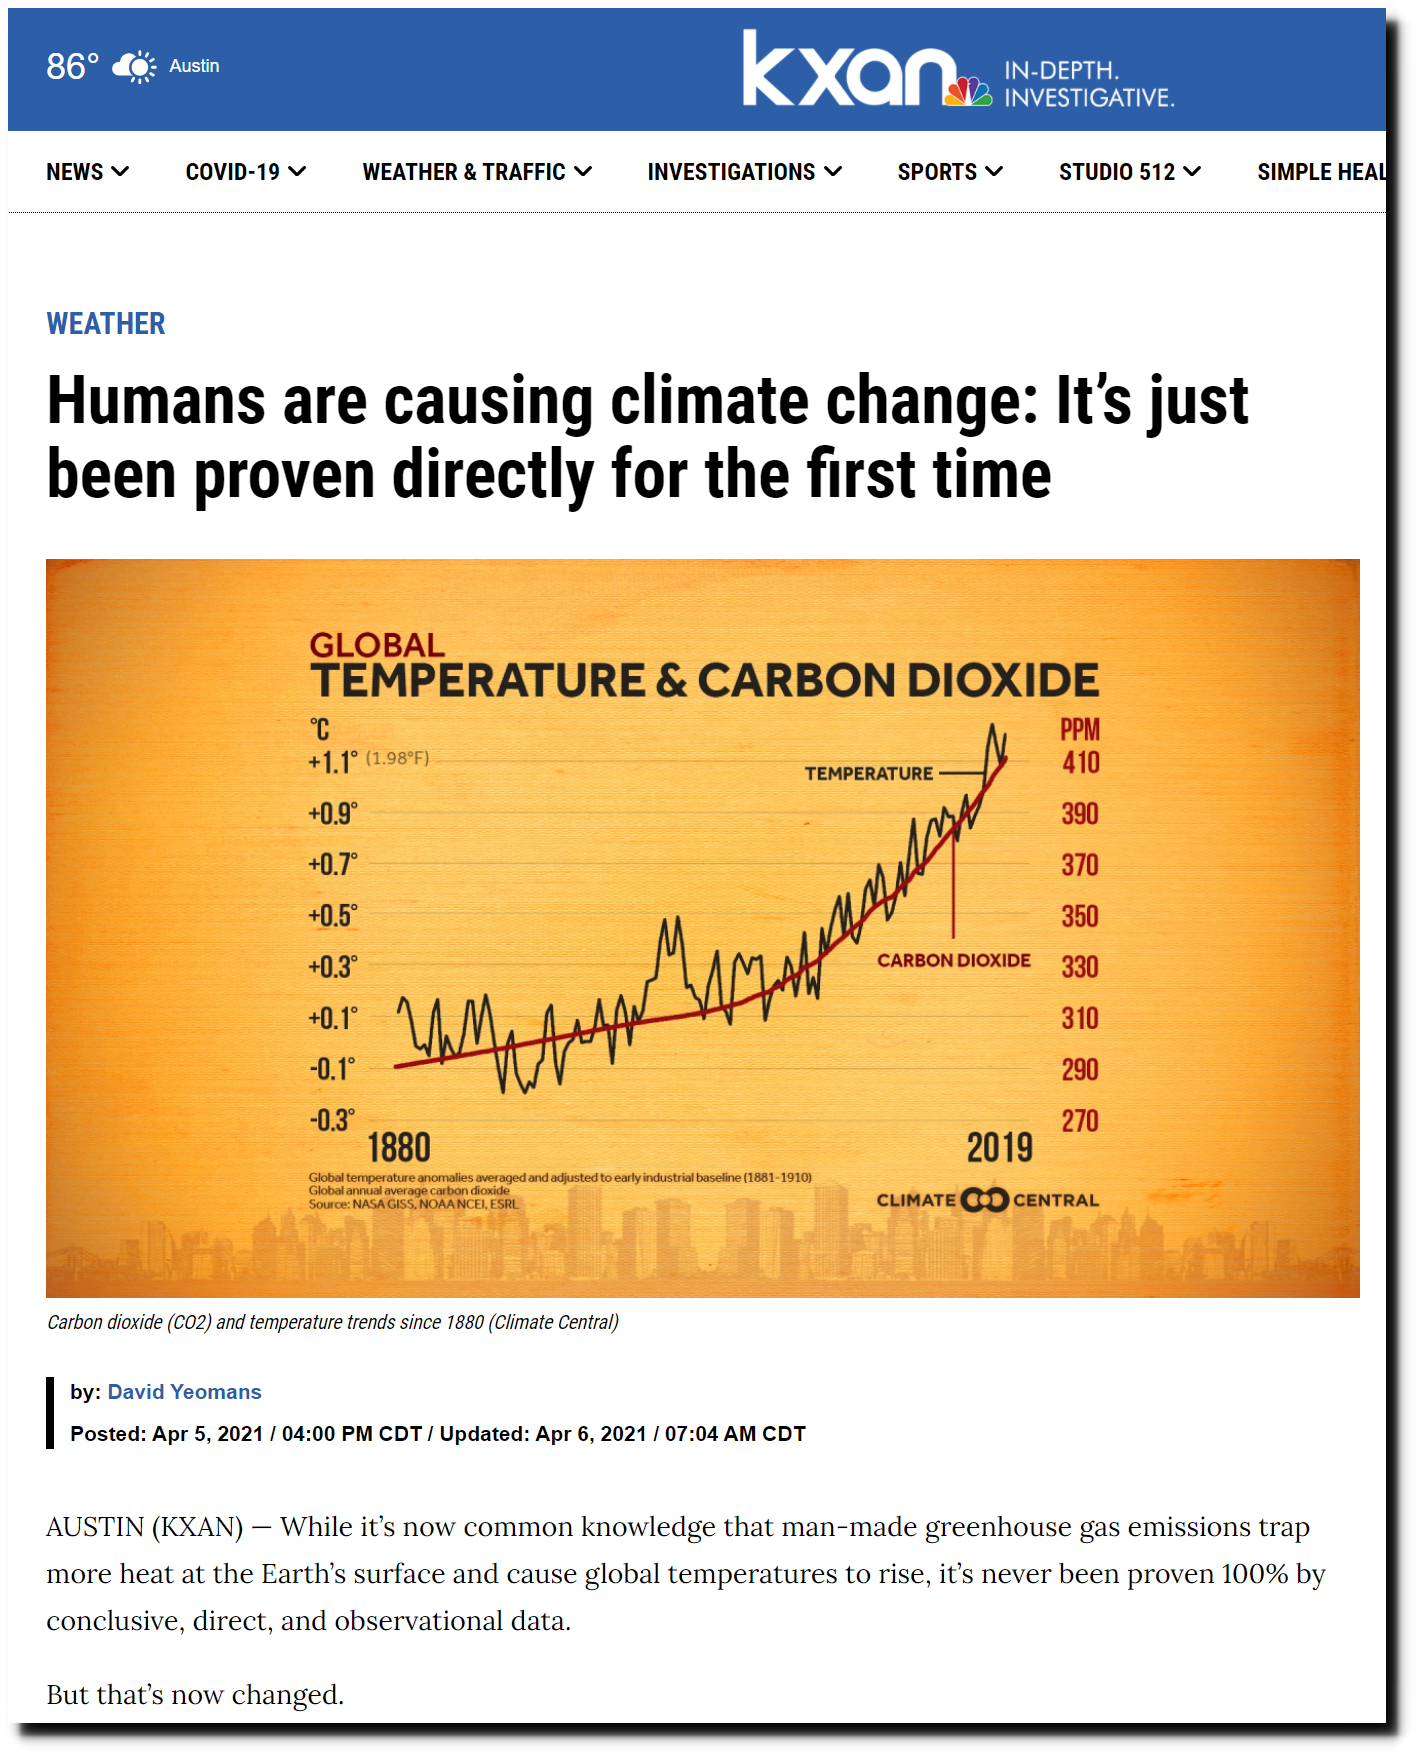
Humans are causing climate change: It’s just been proven directly for the first time | KXAN Austin
All they actually did was replot the same graph which the US Government has had out there for several years.
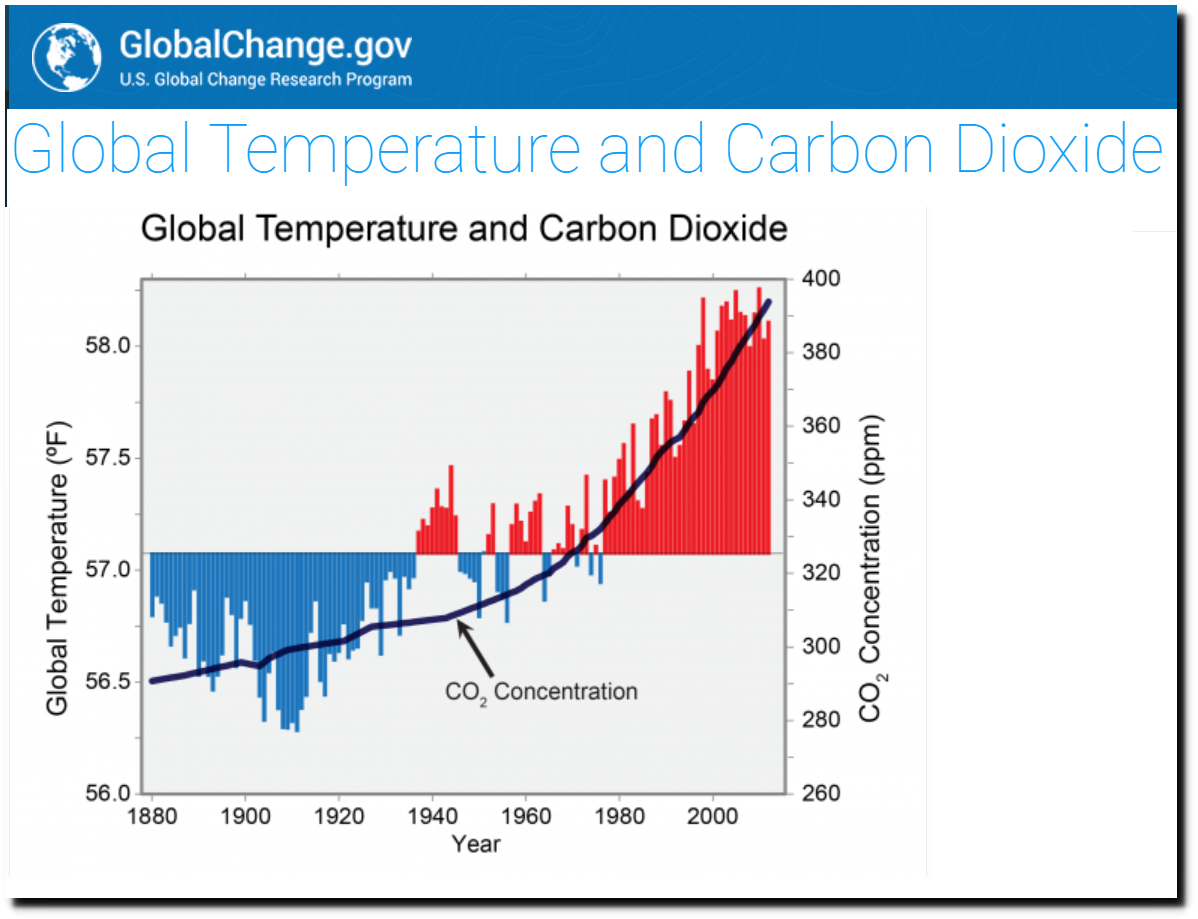
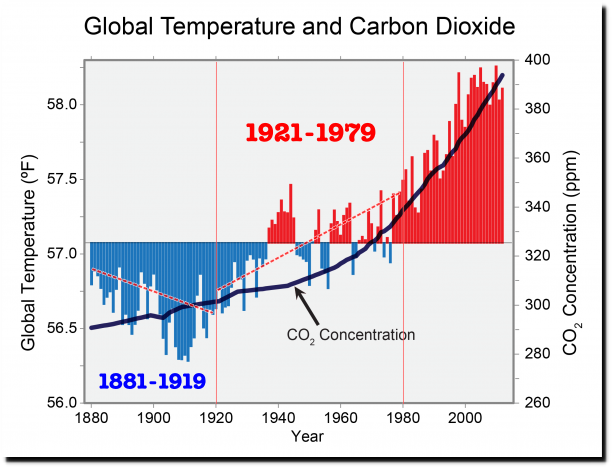
Global Temperature and Carbon Dioxide | GlobalChange.gov
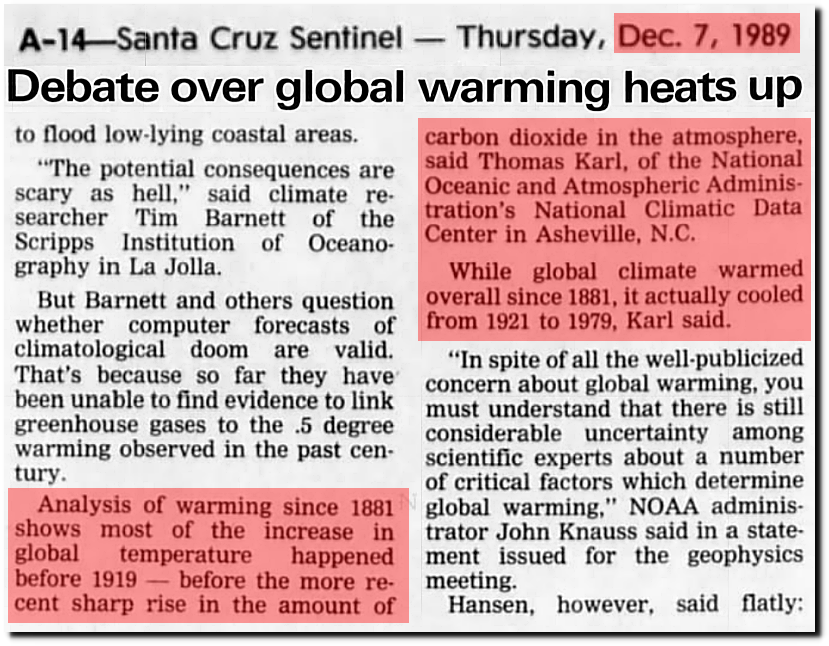
This graph directly contradicts what Tom Karl, longtime head of NOAA’s National Climatic Data Center said in 1989. He retired in 2017 just as President Trump took office.
“Analysis of warming since 1881 shows most of the increase in global temperature happened before 1919 — before the more re-cent sharp rise in the amount of carbon dioxide in the atmosphere, said Thomas Karl, of the National Oceanic and Atmospheric Administration’s National Climatic Data Center in Asheville, N.C. While global climate warmed overall since 1881, it actually cooled from 1921 to 1979, Karl said”
07 Dec 1989, Page 14 – Santa Cruz Sentinel at Newspapers.com
The warming from 1881-1919 has turned into cooling, and the cooling from 1921-1979 has turned into warming. When academics and government employees are willing to tamper with data – they can “prove” anything.
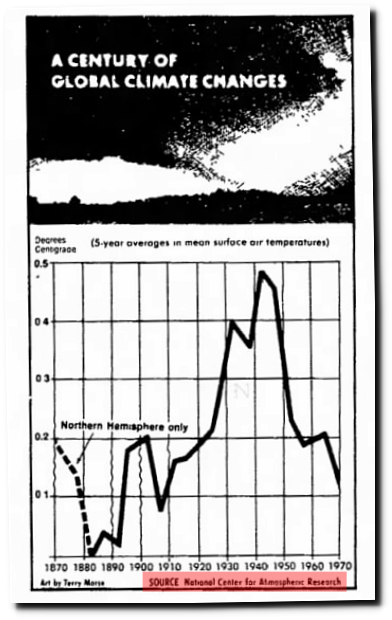
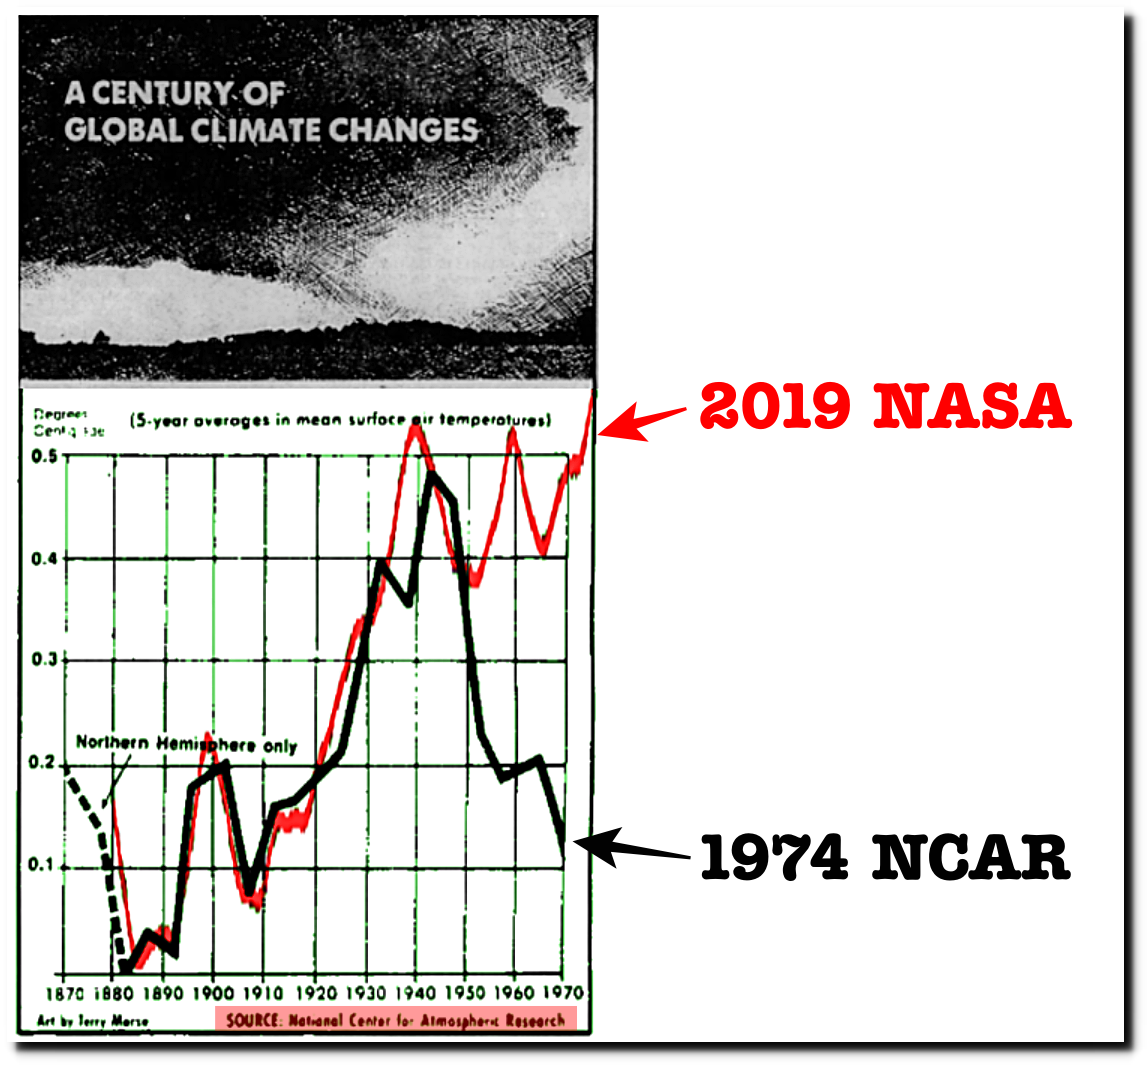
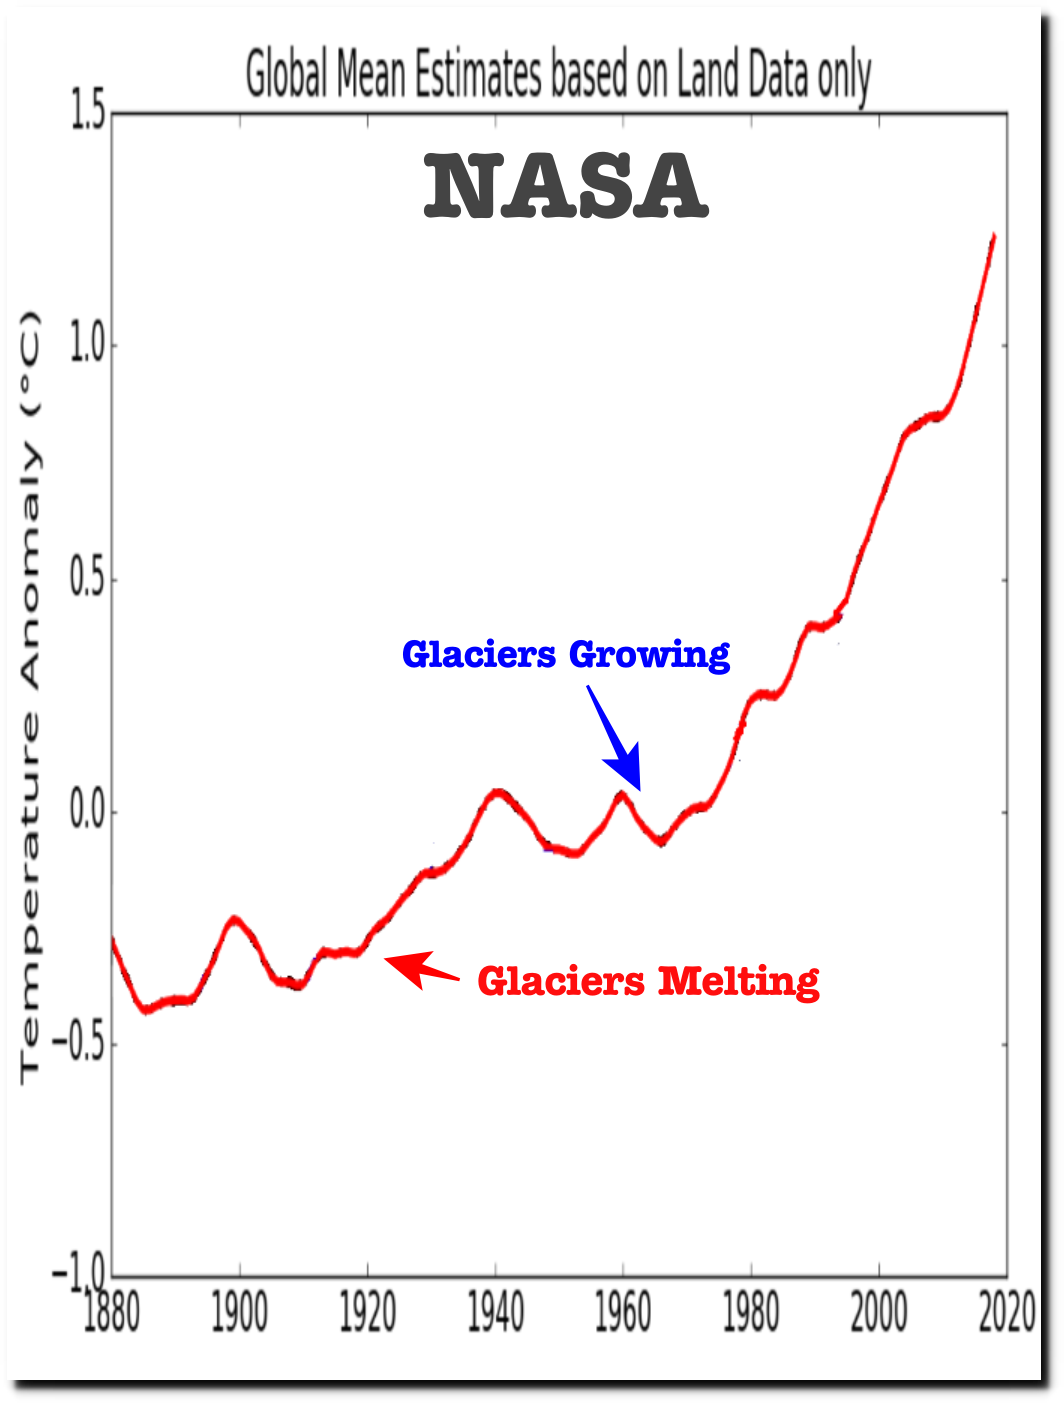
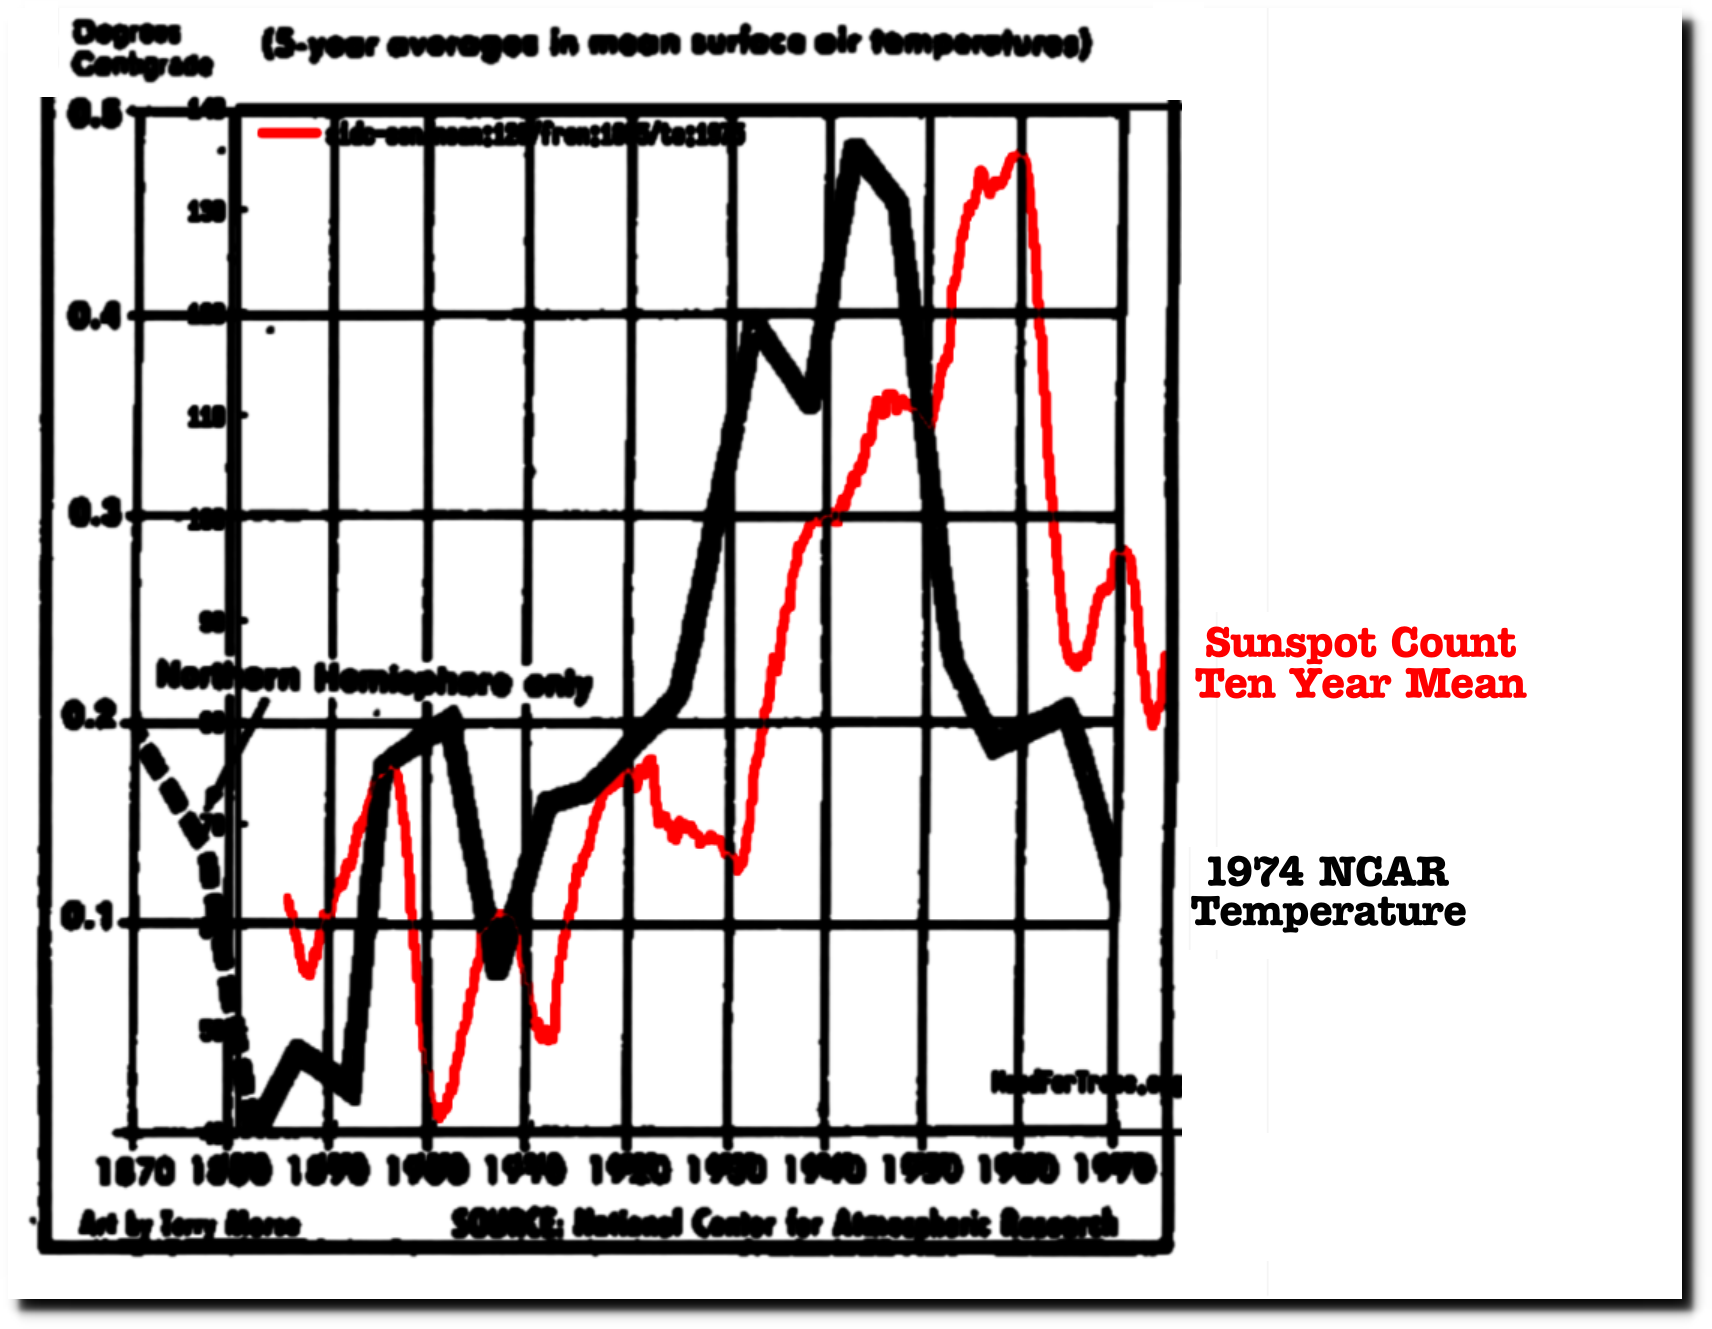
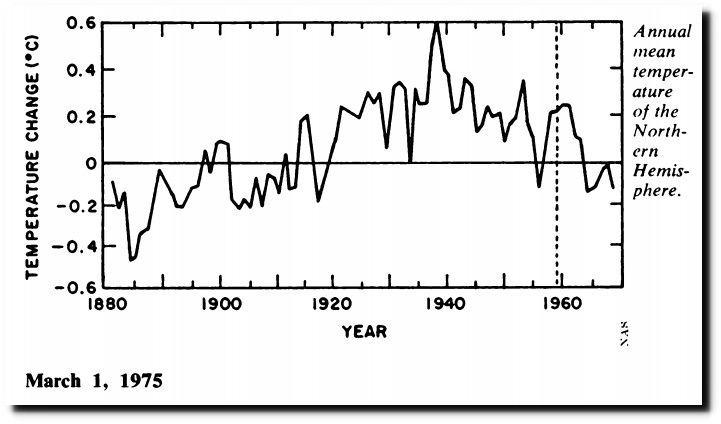
Global temperature his has been rewritten by government scientists over the past 30 years In 1974, the National Center For Atmospheric Research showed no net warming from 1870 to 1970.
14 Jul 1974, Page 1 – Lincoln Evening Journal at Newspapers.com
As of the year 2000, NASA showed no net warming from 1866 to 1979, with 1878 being the warmest year of that period.
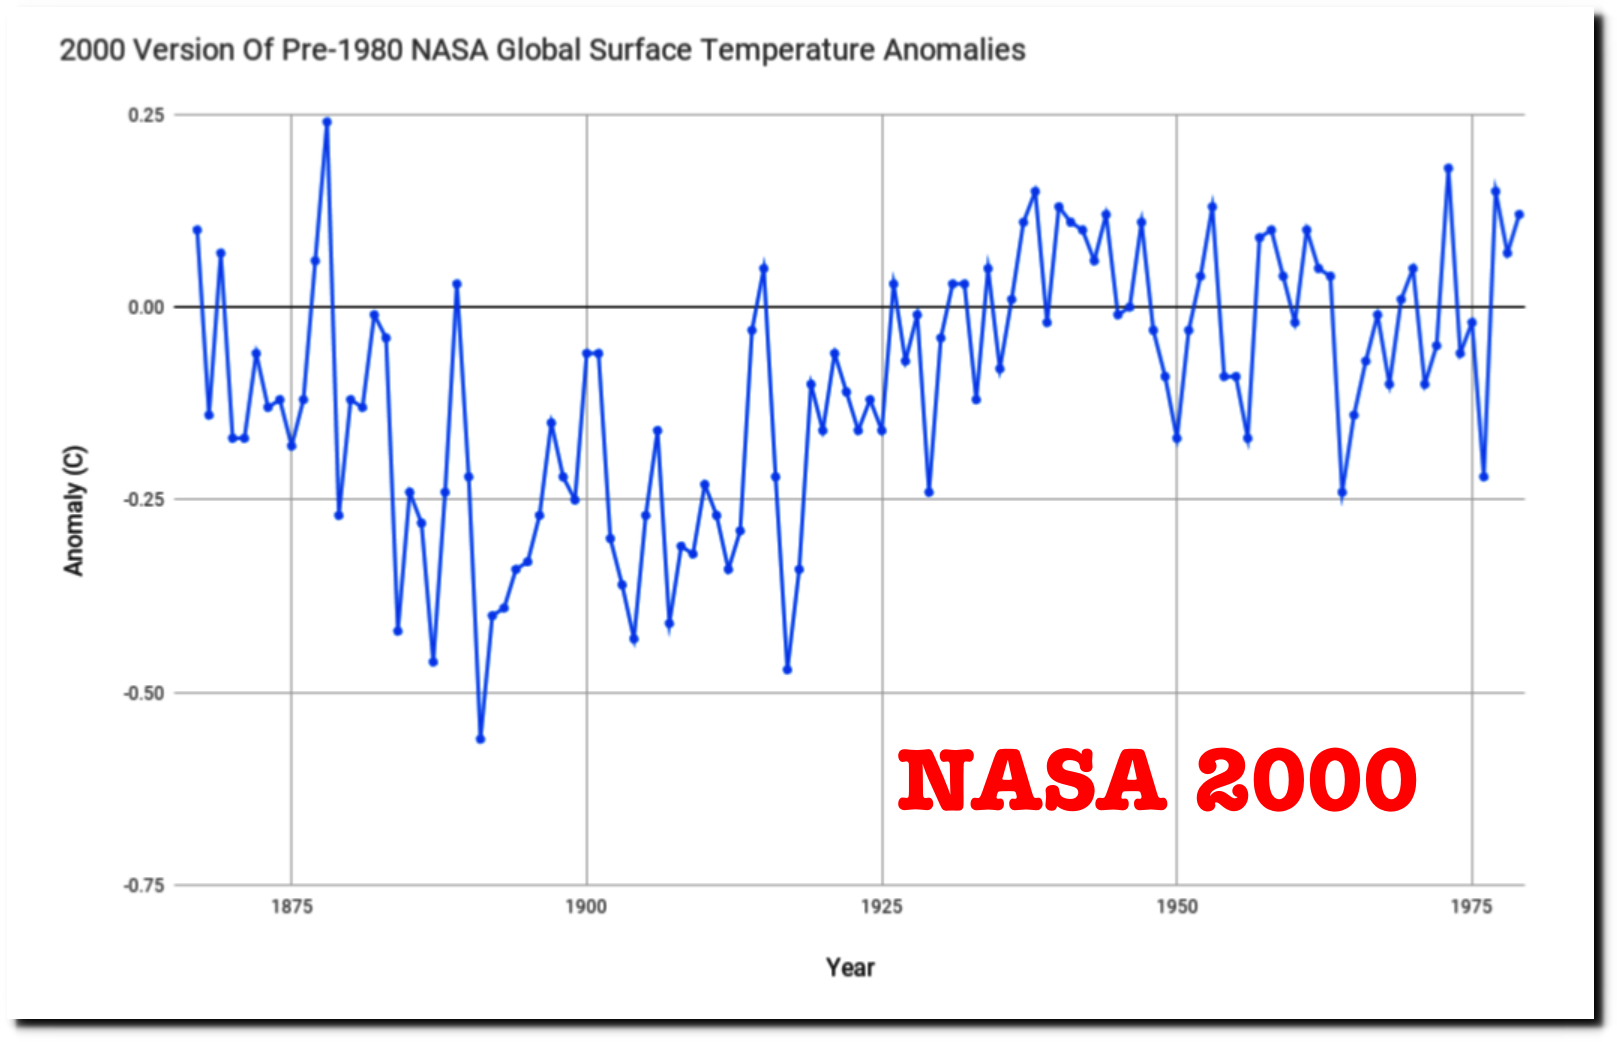
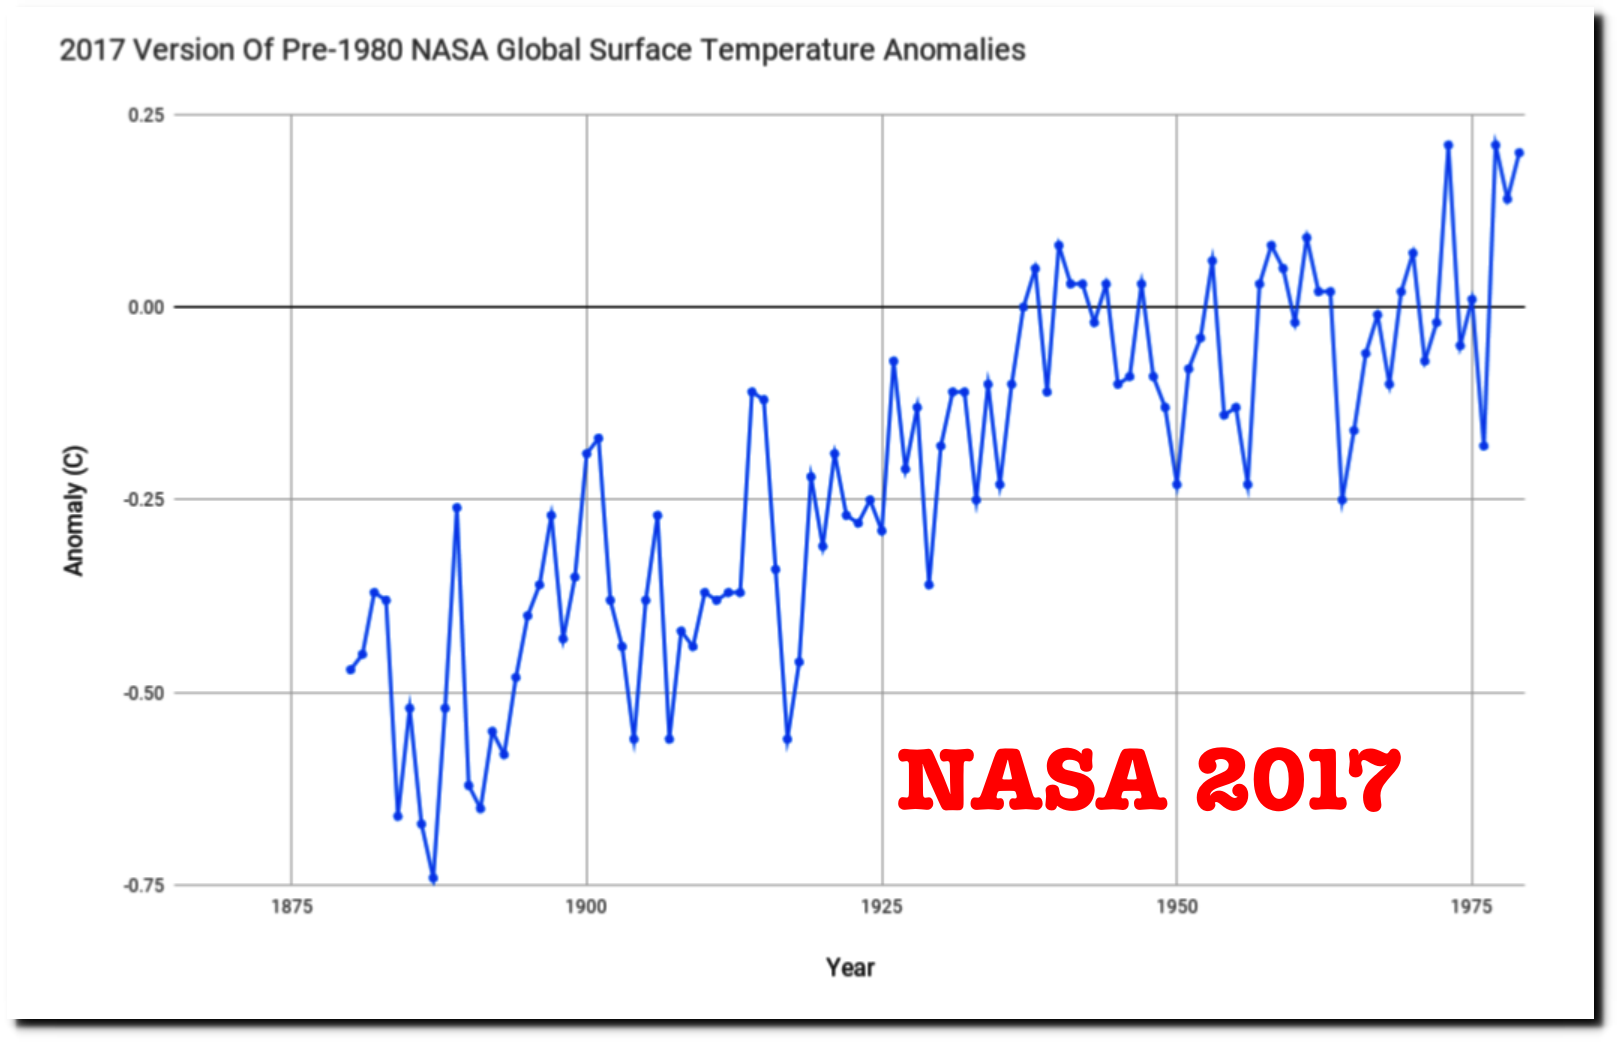
But they now hide data before 1880, and show about 0.7C warming prior to 1980
https://data.giss.nasa.gov/gistemp/history/output/met_used.zip
This animation shows how they have altered the data
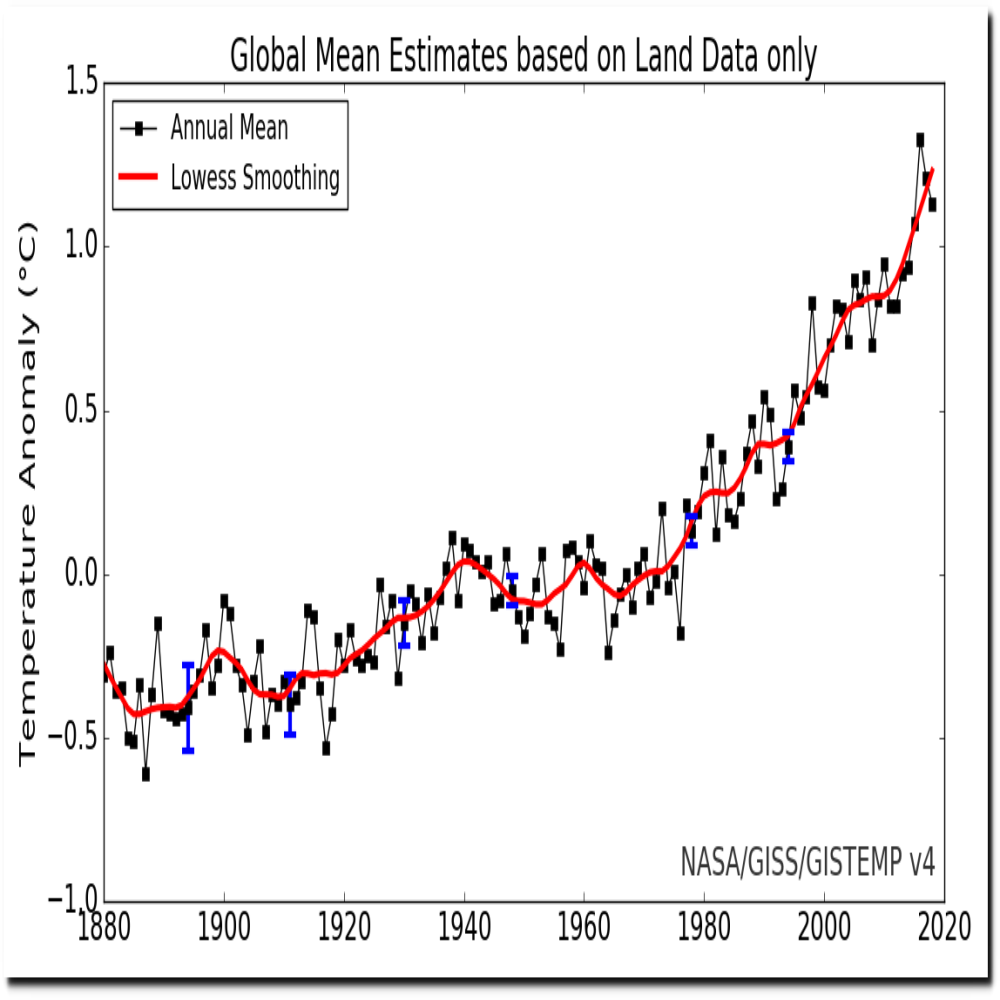
NASA GISS v4 shows more than 2C warming over land since 1880.
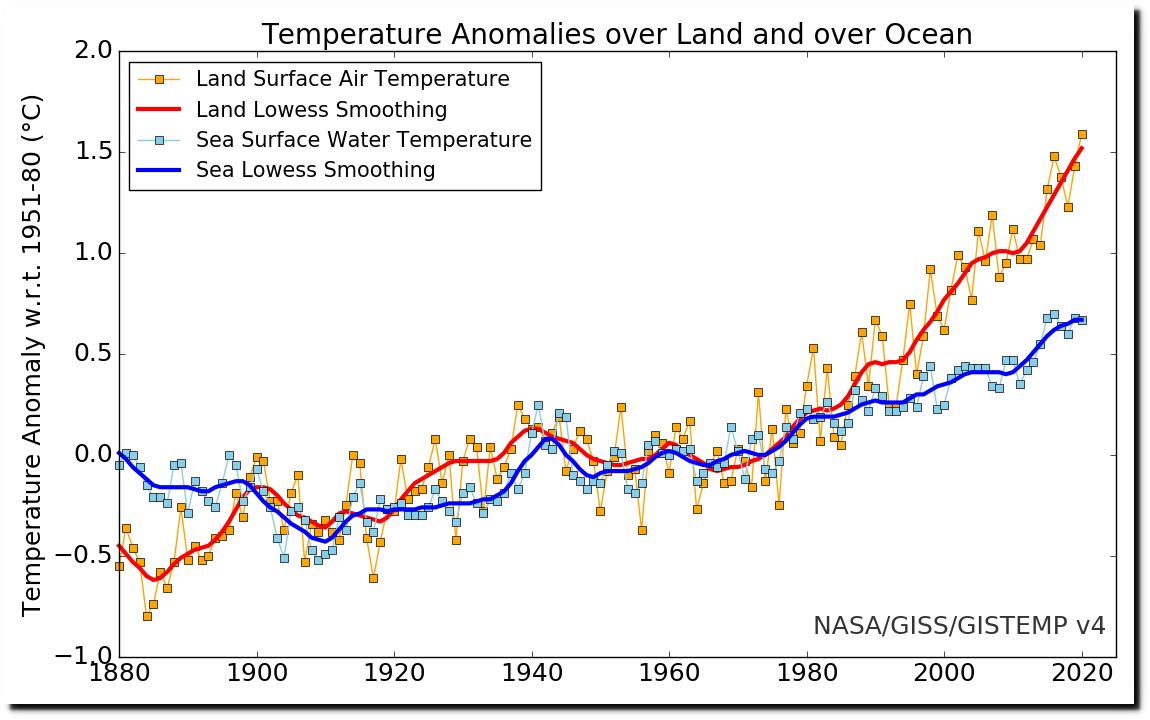
A different version of the same V4 graph also shows about 1.6C warming over land since 1880. This graph used to be linked to from their website, but I can no longer find any links. However the graph is still present on their website.
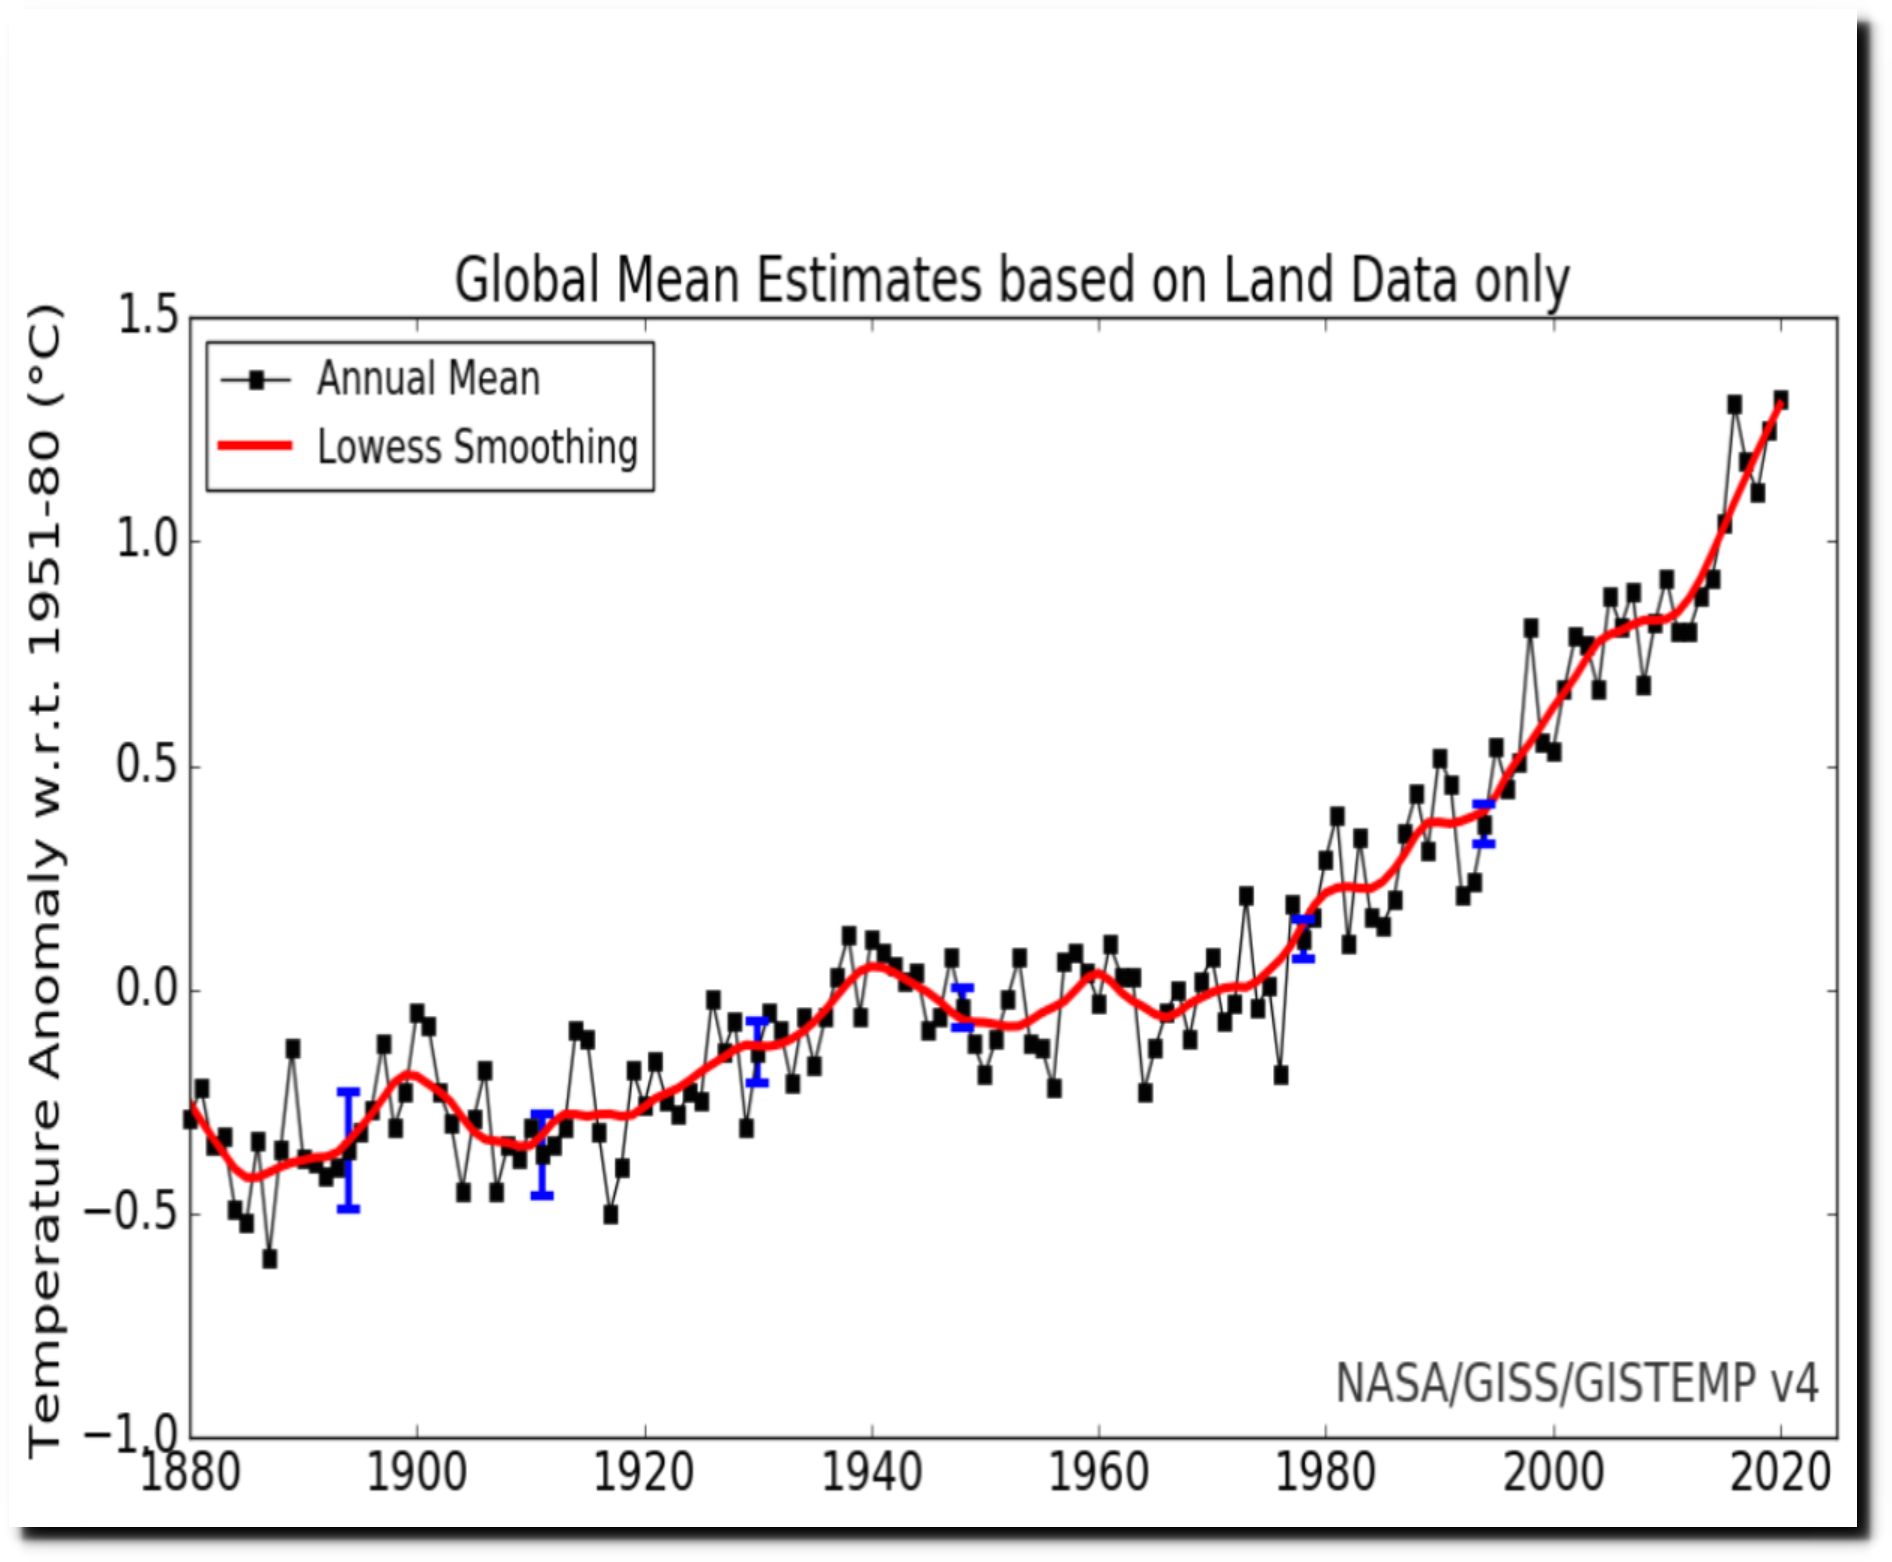
The red lines in both of the graphs above should be identical, but they aren’t. Here is an animation showing how they are altering the land data in the new graph vs. the old graph. They have increased recent temperatures by about 0.3C and cooled past temperatures by about the same amount.
In 2001, NASA published the same graph showing half as much warming from 1880 to 2000.
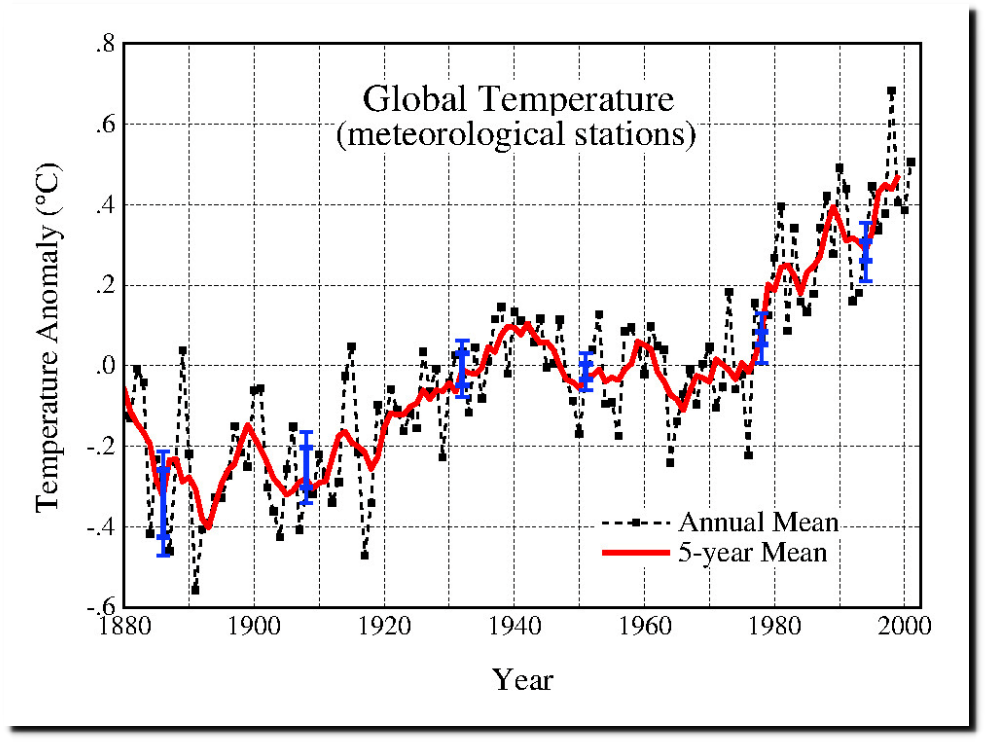
2001: Fig.A.ps
This animation cycles through how NASA has altered the data over the past 20 years to greatly increase warming.
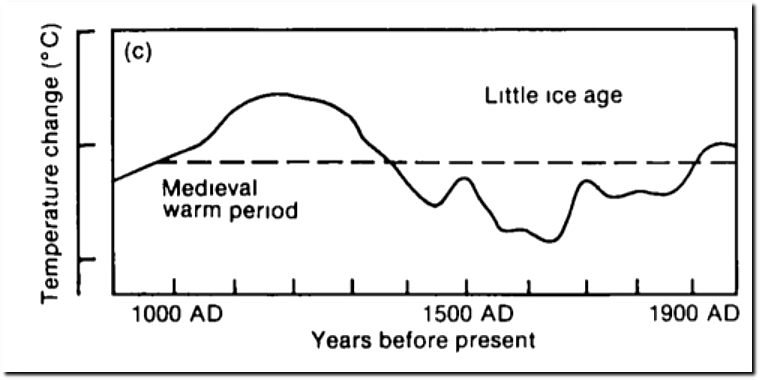
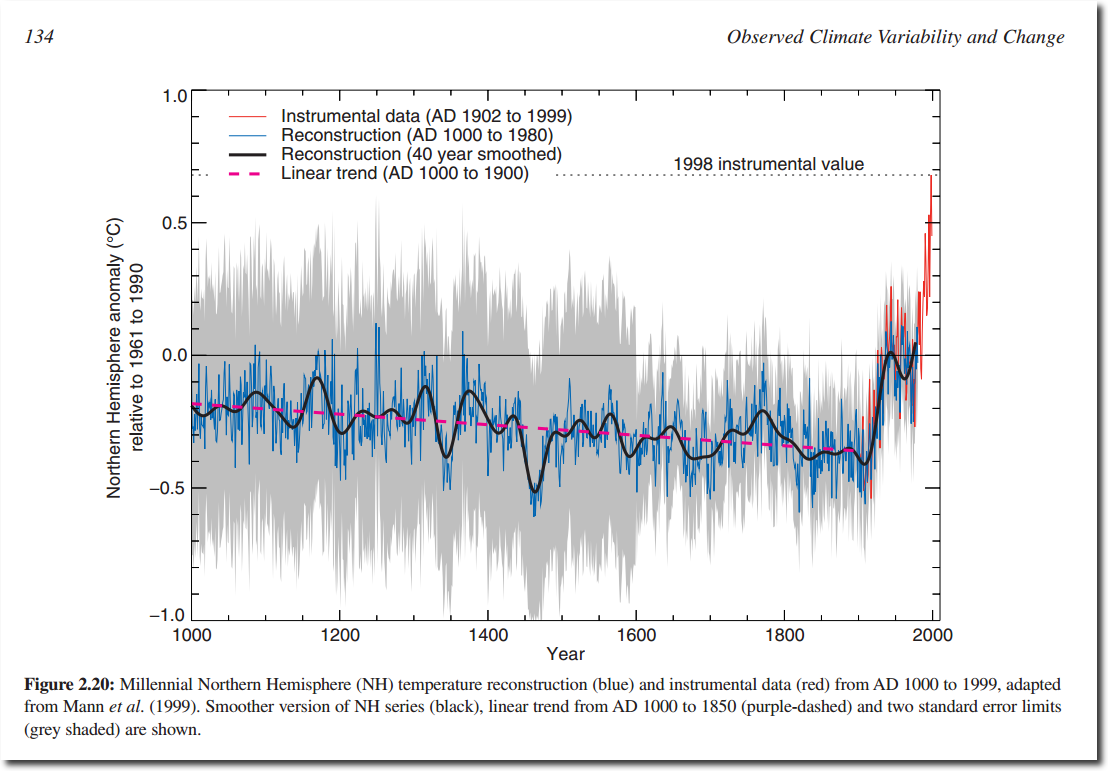
Let’s look now at why the data is being altered. In 1990, the IPCC showed no indication of man-made global warming and that current temperatures were just about average for the past thousand years.
In 1992, the New York Times said there was no indication of global warming and that the MWP and LIA were global.
Warming? Tree Rings Say Not Yet
Lisa J. Graumlich, who examines the ring patterns of foxtail pine trees and western junipers in the Sierra Nevada, has compiled a detailed record of the year-to-year variation in temperature and precipitation over the last thousand years.
She has seen in the North American trees the feathery but unmistakable signatures of the Medieval Warm Period, a era from 1100 to 1375 A.D. when, according to European writers of the time and other sources, the climate was so balmy that wine grapes flourished in Britain and the Vikings farmed the now-frozen expanse of Greenland; and the Little Ice Age, a stretch of abnormally frigid weather lasting roughly from 1450 to 1850. A Crucial Question
“We can now see that these were global climate phenomena, not regional temperature variations,” she said. “The question is, how did we get those warmer temperatures during pre-industrial times, and what can we learn from those conditions about what is going on today?”
Al Gore was elected VP in 1992, and he was determined to change things.
“any scientist who studied the Antarctic ice cores and did not consider global warming an immediate “crisis” was being “unethical.”
- Al Gore 1990
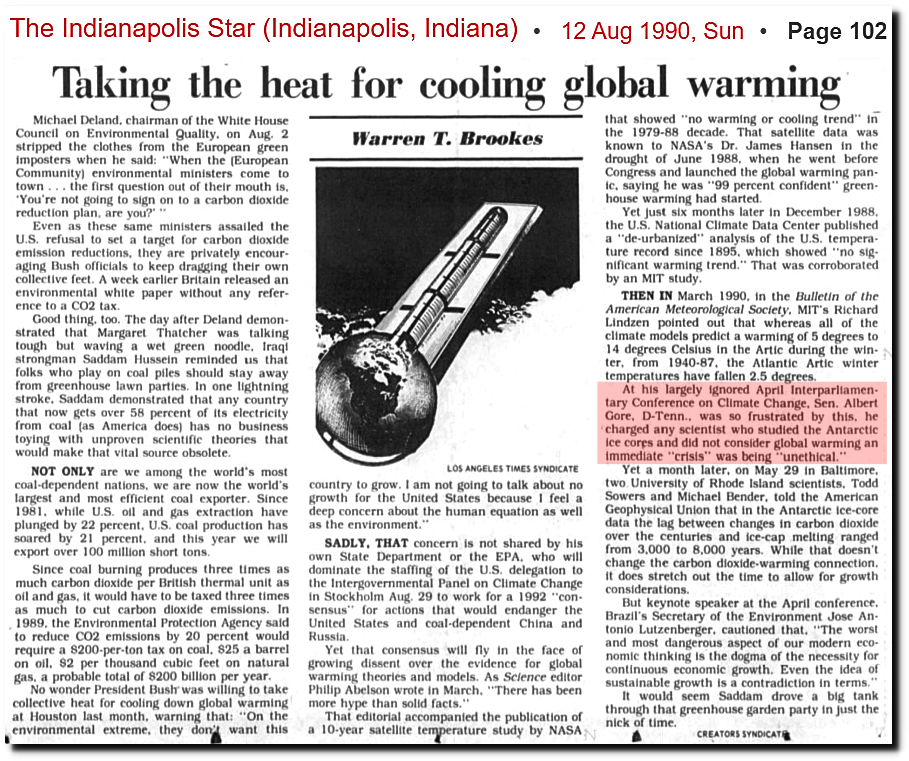
12 Aug 1990, Page 102 – The Indianapolis Star at Newspapers.com
He misinterpreted Antarctic ice core graphs to show CO2 drove ocean temperature rather than the opposite. Under his model, a 100 PPM change in CO2 caused a 10C swing in temperature.
If that was the case, the 7,000 PPM of the Cambrian Era would have produced Antarctic temperatures of 700C.

Here’s a better graph of CO2 and temperature for the last 600 million years! | by G Horner | Medium
Science went out the window in 1992, and in 1993 my good friend Dr. Bill Gray – who was considered the world’s leading tropical meteorologist and the inventor of modern hurricane forecasting – received a phone call from VP Gore requesting his attendance at a global warming meeting Gore was having. Bill said he “would be happy to attend but was not a believer in Gore’s global warming apocalypse theories.” Dr. Gray immediately got his finding cut off and never received another penny from the government. Bill passed away five years ago this week and largely self-funded his research and his graduate students’ research from 1993 to 2016.

Everyone in the climate science community became aware that ongoing funding depended on towing the global warming line. Here he is with his Al Gore $8 bill.

Bill never gave an inch to climate fraudsters even when attacked by Judith Curry and her husband Peter Webster.
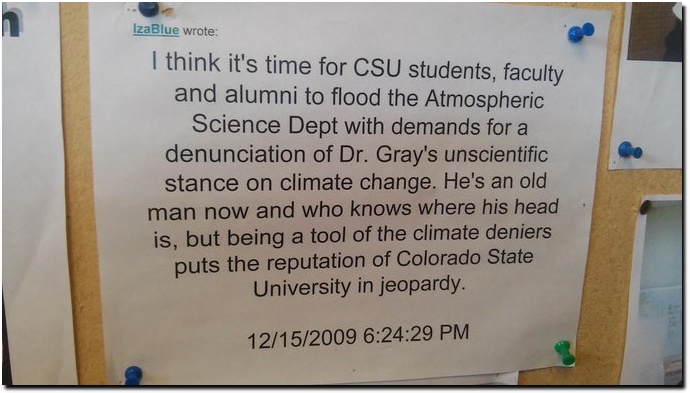
“CSU’s William Gray, told a U.S. Senate hearing last month that talk of global warming is “bogus science and media hype” driven by “scientists who were willing to bend their objectivity to obtain government grants.”
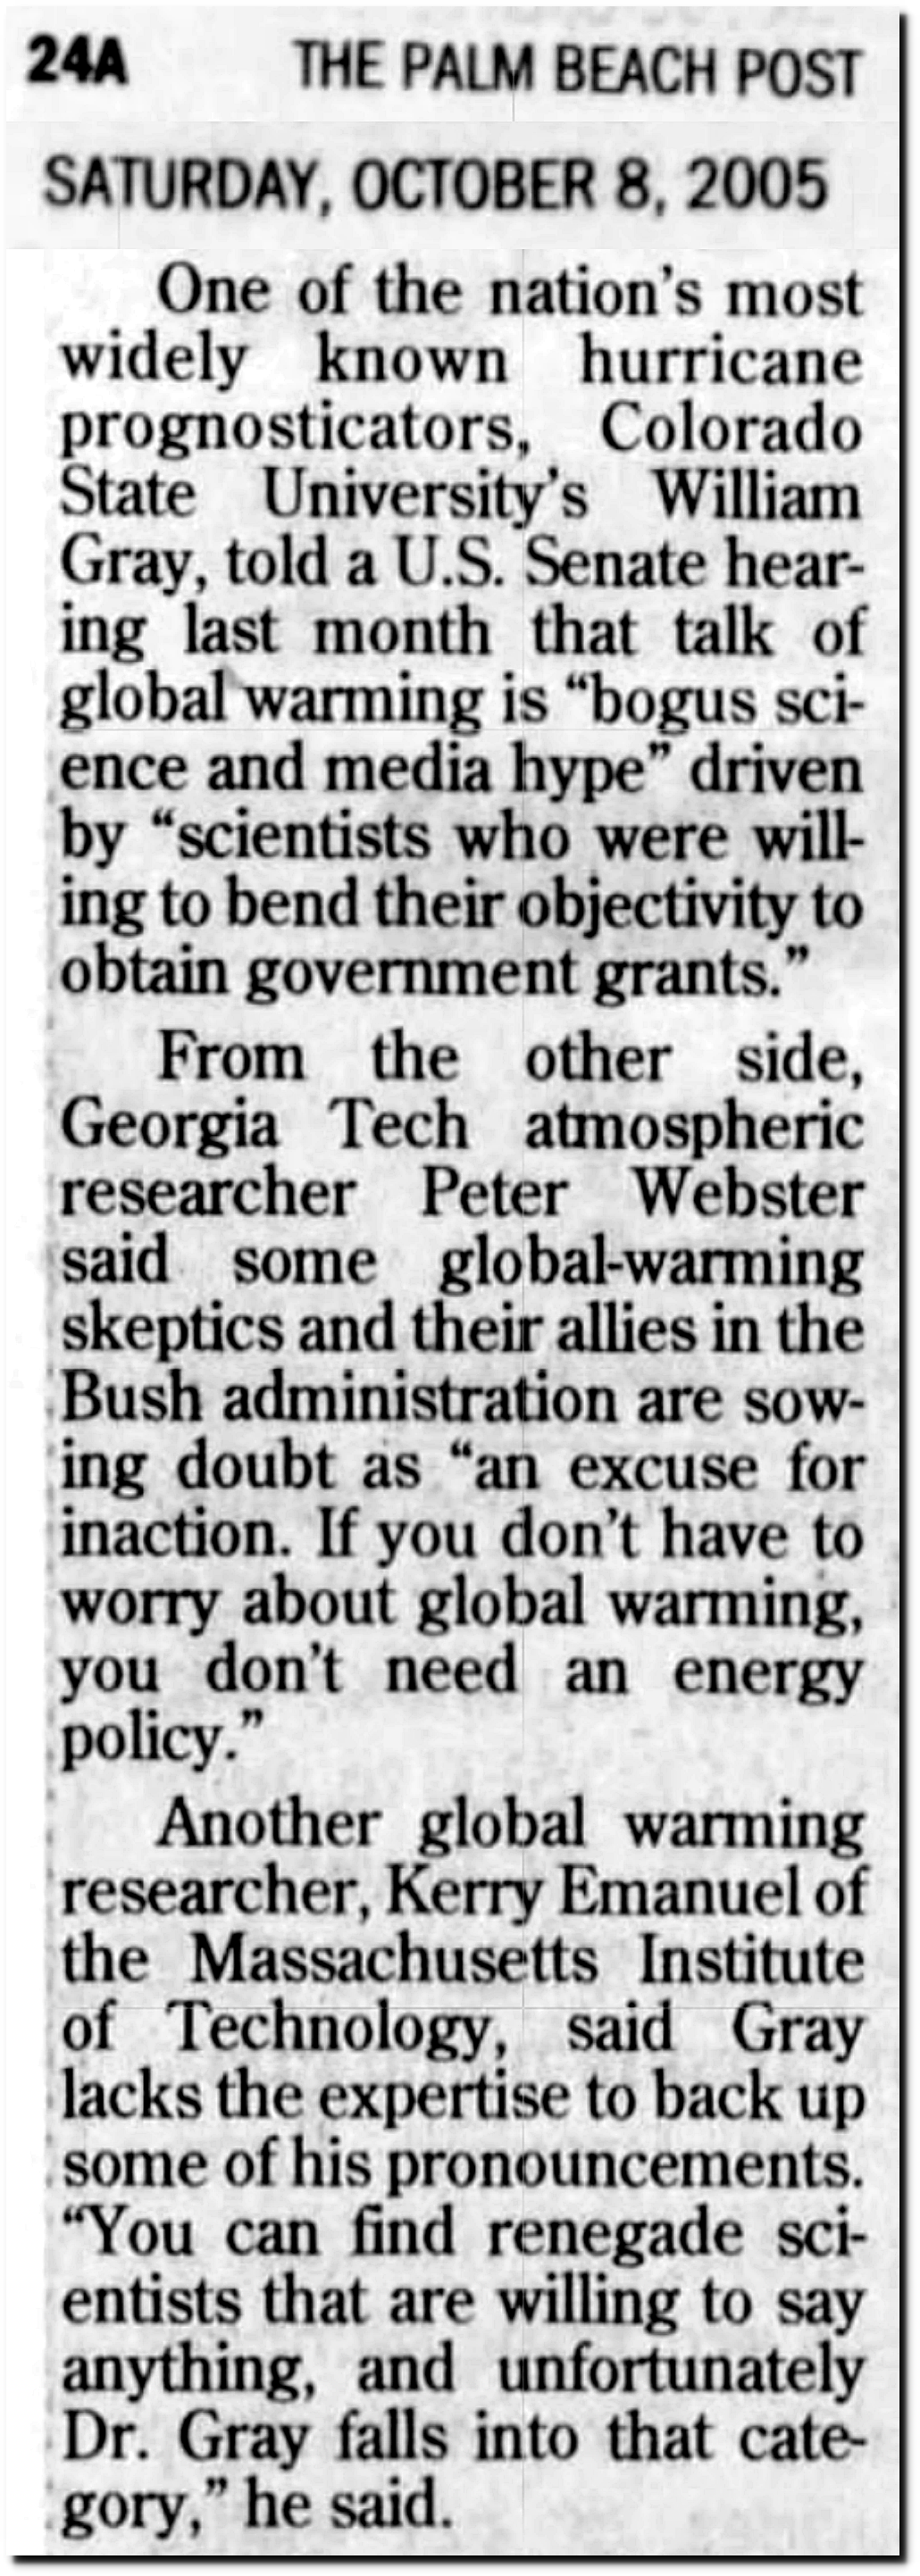
08 Oct 2005, Page 9 – The Palm Beach Post at Newspapers.com
When Bill passed away five years ago, even the climate alarmists at Weather Underground acknowledged his tremendous accomplishments, though they have since deleted this post.
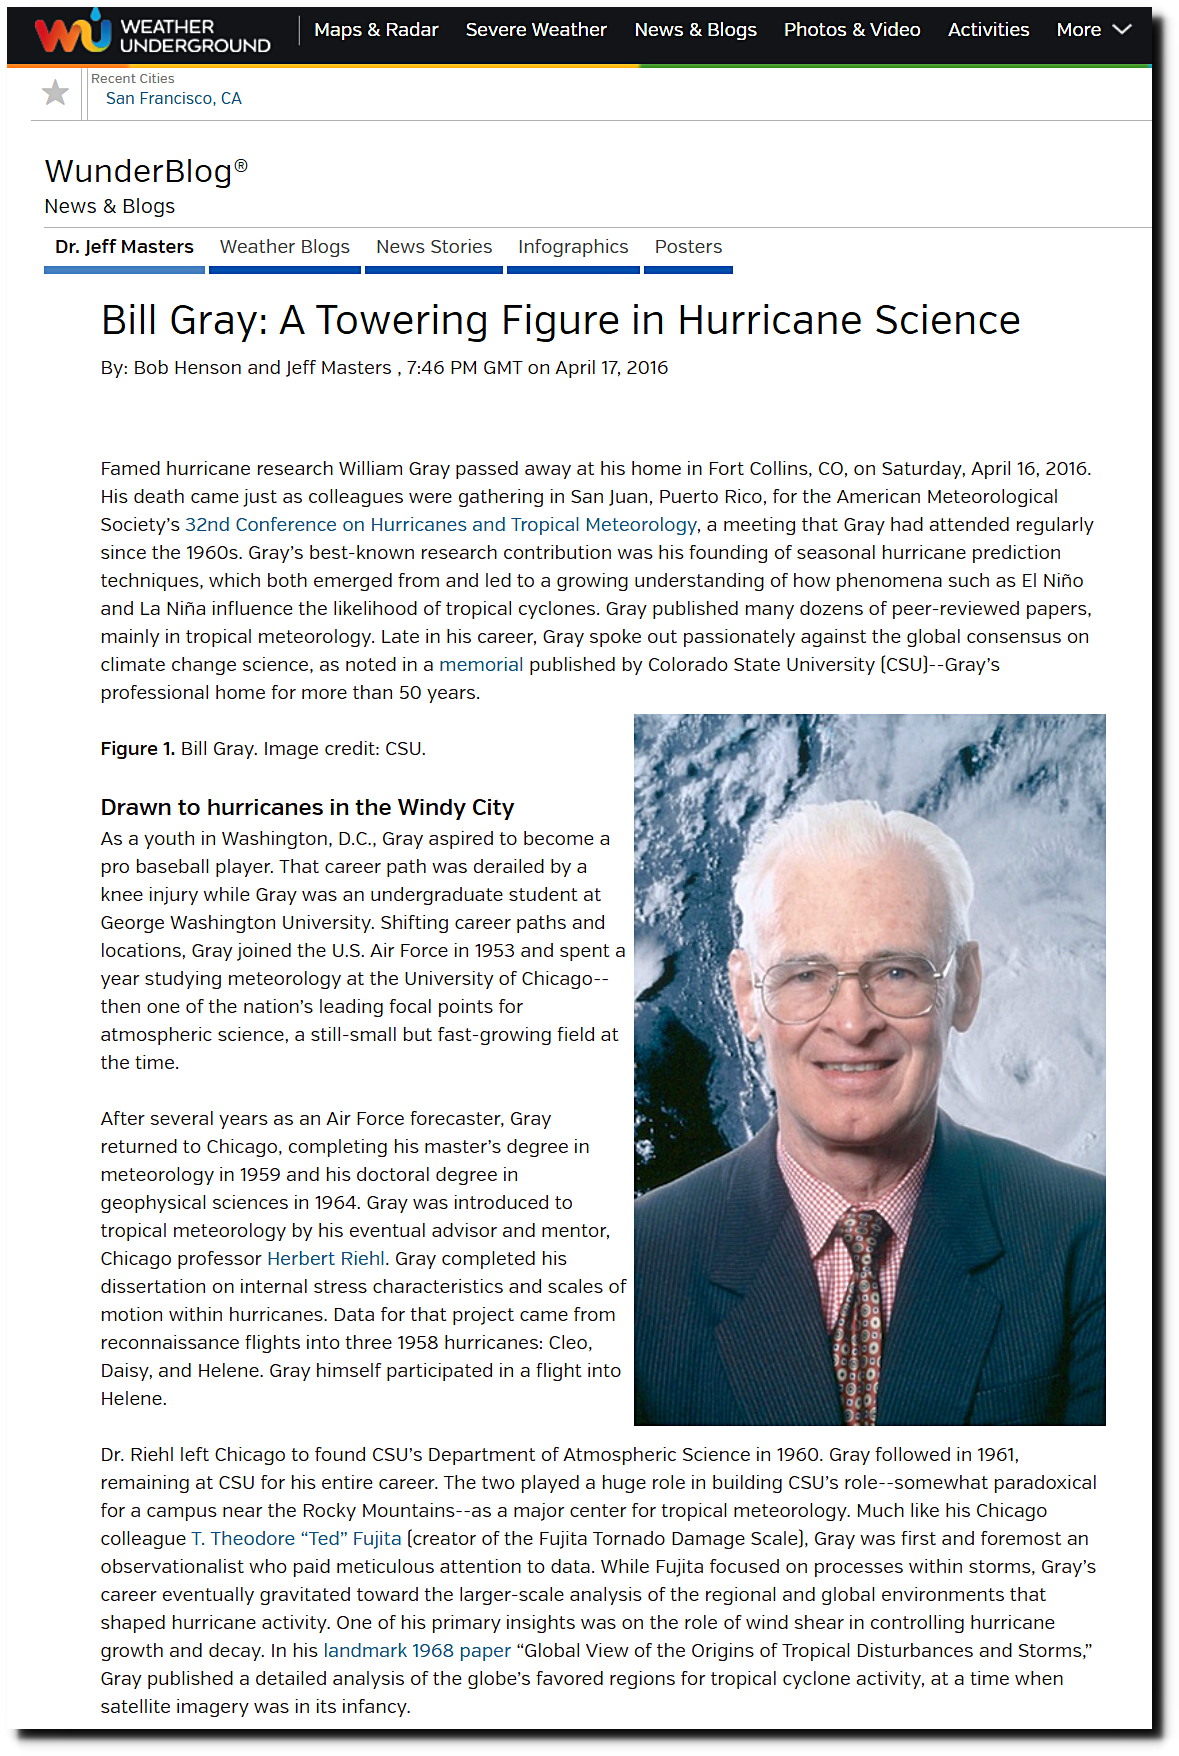
Bill Gray: A Towering Figure in Hurricane Science | Dr. Jeff Masters’ WunderBlog
But climate science became hopelessly corrupt as soon as Al Gore took office. He was under constant attack for telling the truth and thus threatening university funding.
By 1995, climate science and climate journalism was hopelessly corrupt.
“In 1995, I published a short paper in the academic journal Science. In that study, I reviewed how borehole temperature data recorded a warming of about one degree Celsius in North America over the last 100 to 150 years. The week the article appeared, I was contacted by a reporter for National Public Radio. He offered to interview me, but only if I would state that the warming was due to human activity. When I refused to do so, he hung up on me.”
“I had another interesting experience around the time my paper in Science was published. I received an astonishing email from a major researcher in the area of climate change. He said, “We have to get rid of the Medieval Warm Period.”
“it would be foolish to establish national energy policy on the basis of misinformation and irrational hysteria.”
- Dr David Deming
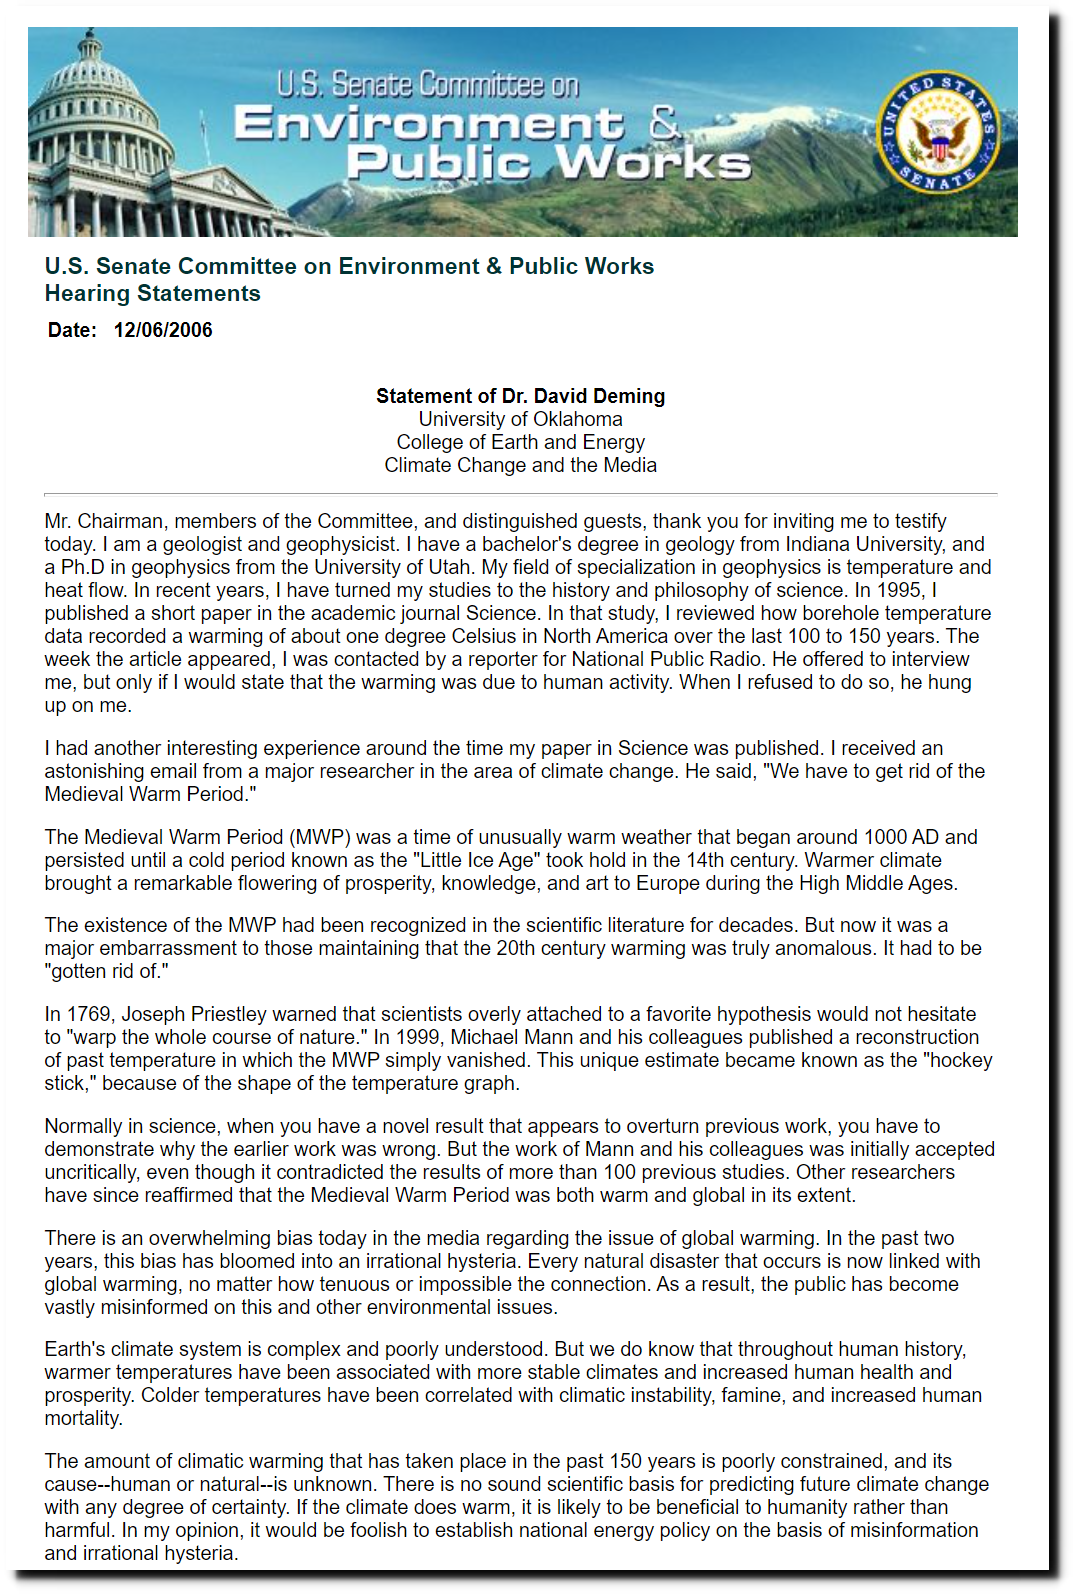
U.S. Senate Committee on Environment and Public Works
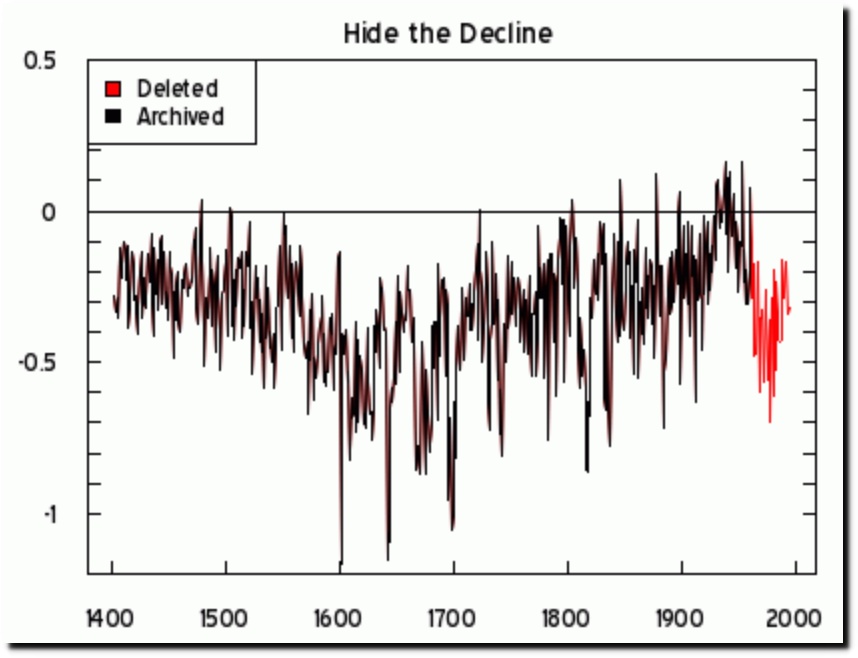
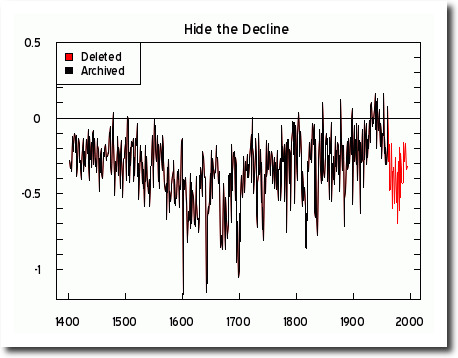
And three years later, Michael Mann hid the decline and made the Medieval Warm Period, Little Ice Age and post-1940 cooling disappear. He replaced the proxy data which showed cooling after 1940 with fake global temperature data from NASA and NOAA.
The United States temperature record is particularly important, because the vast majority of high quality long-term temperature data around the world are in the US.
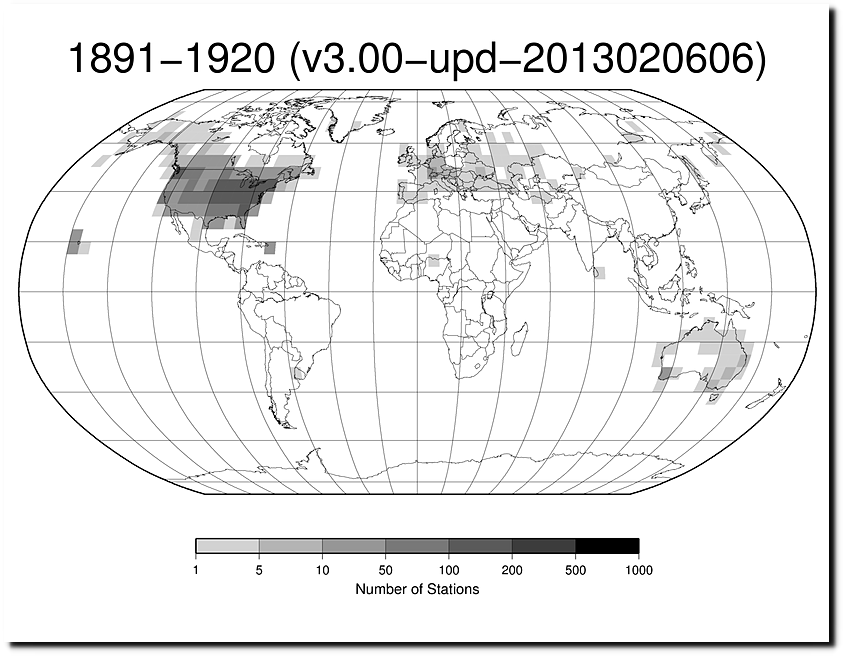
station-counts-1891-1920-temp.png
In 1989, NOAA’s Tom Karl said there had been no warming in the US over the past century, and no indication the greenhouse effect had affected temperatures. He directly contradicted NASA’s James Hansen’s 1988 testimony before Congress.
U.S. Data Since 1895 Fail To Show Warming Trend – NYTimes.com
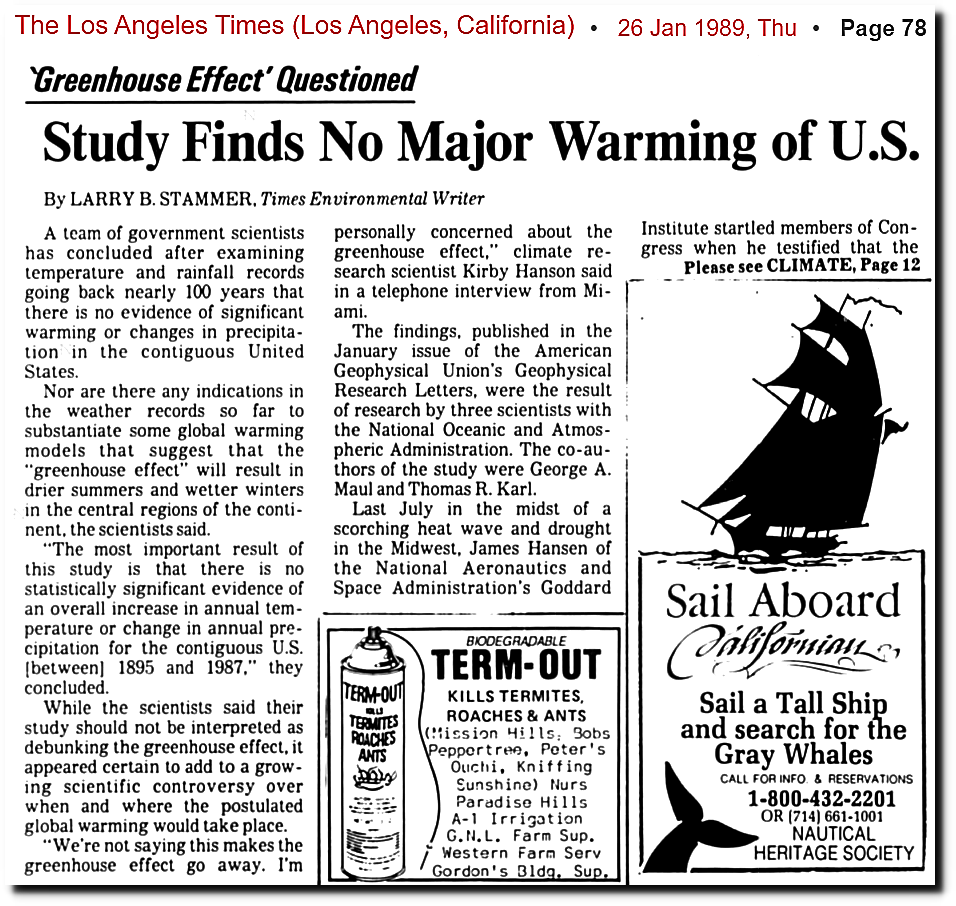
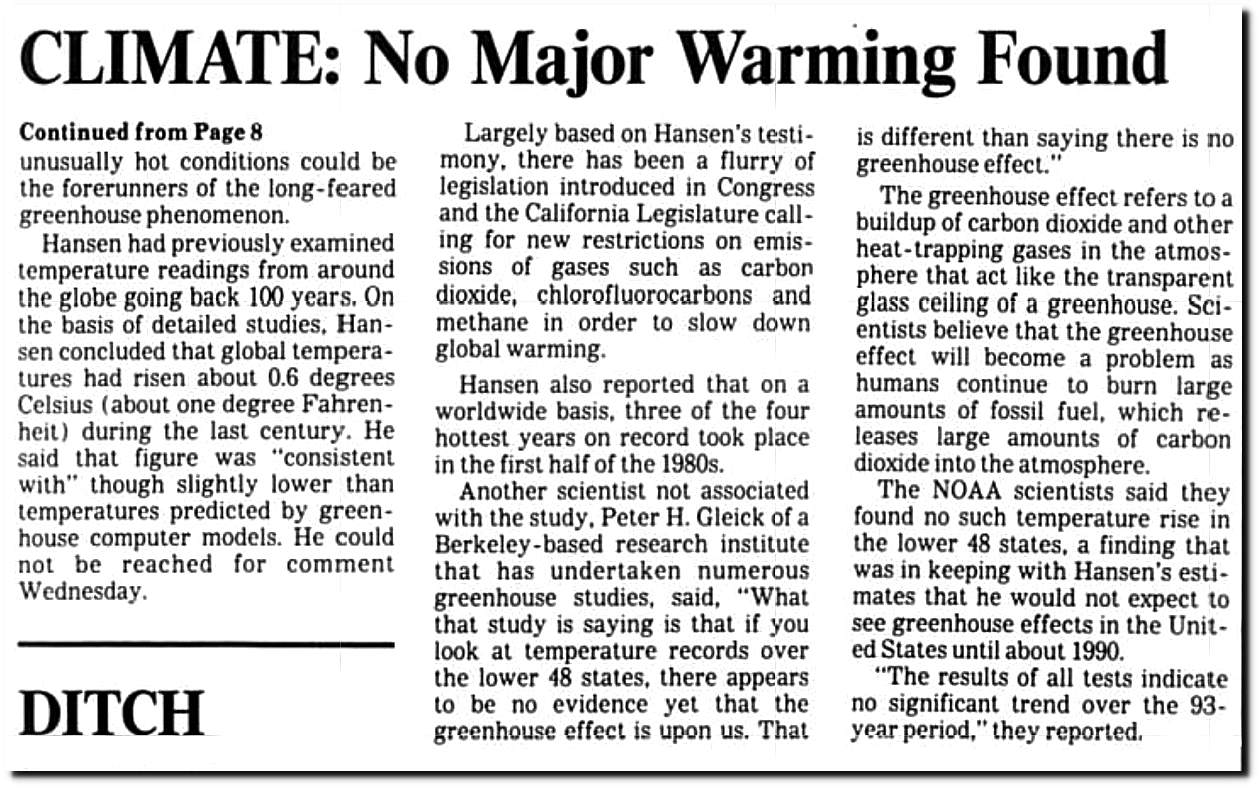
26 Jan 1989, 78 – The Los Angeles Times at Newspapers.com
This graph of US temperatures was posted by NASA in 1999, showing a strong cooling trend from the 1930’s through the end of the century. The years 1934 and 1998 are circled.
But NASA and NOAA changed the data after 1999 to reverse the trend.
Here is an animation showing how the data has been altered over the past 20 years.
Data from NOAA is being altered to turn a cooling trend into a warming trend.
The hockey stick of data tampering is being done precisely to match the increase in CO2 – which is the same story as is being done with the global temperature record.
So why is this being done? Apparently a decision was made decades ago by people who wanted to shut down the US energy supply to link CO2 and climate. Now that that has been done, Joe Biden is actually shutting down the US energy supply.
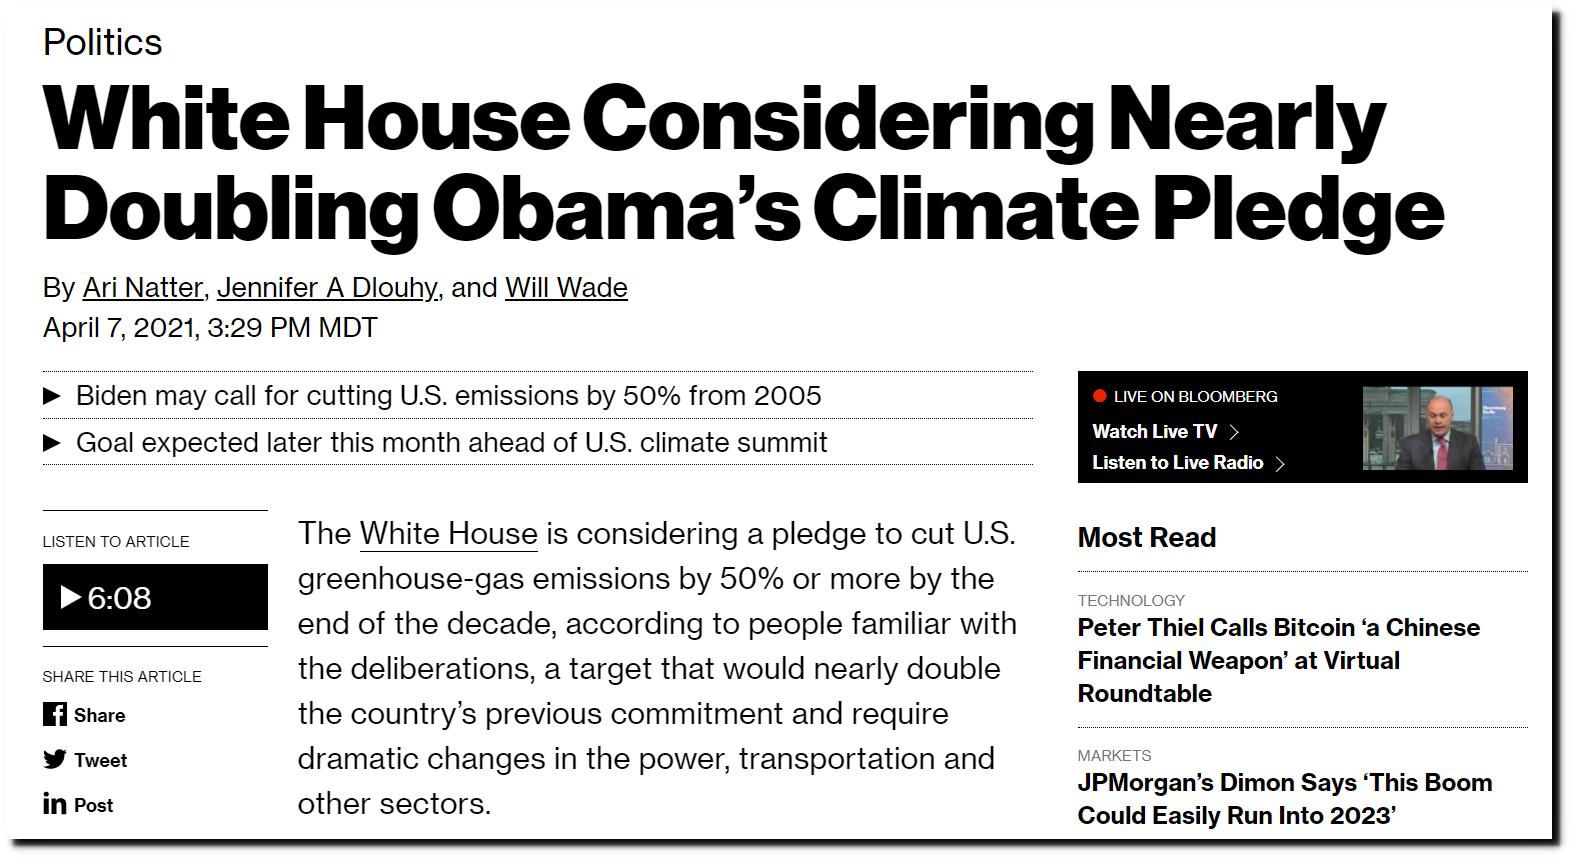
White House Considering Nearly Doubling Obama’s Climate Vow – Bloomberg
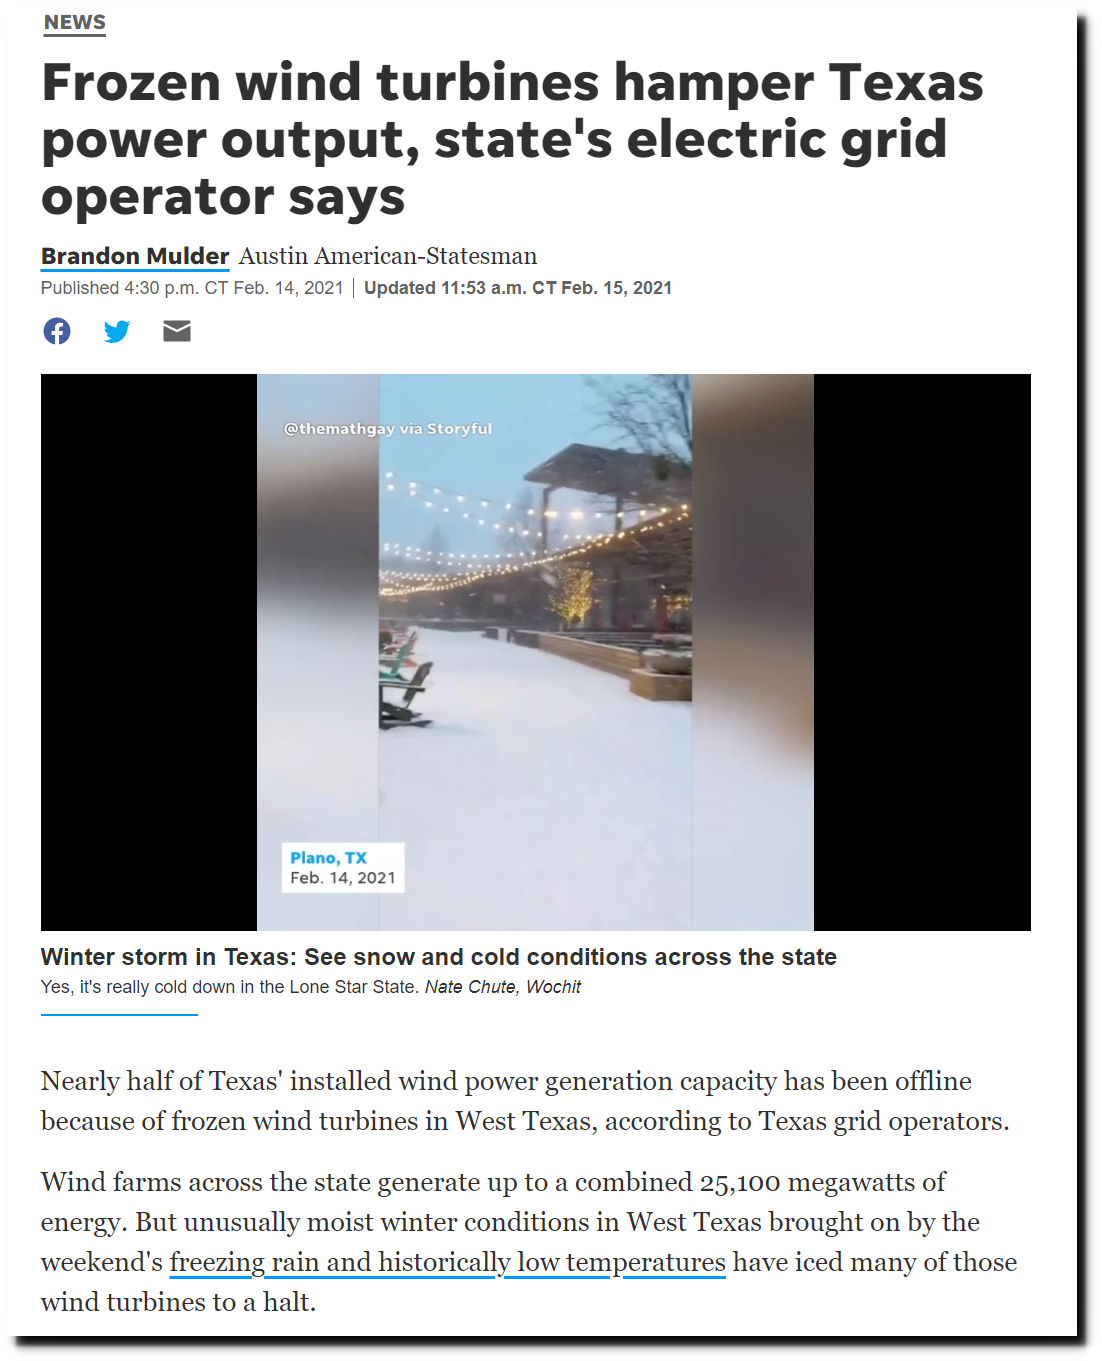
A lot of people froze to death in Texas during February because the state chose to rely on green energy.
The same thing would have happened in Colorado, but they had other more responsible states like Wyoming to provide their electricity for them. We had our coldest late winter day on record on Valentines Day in Cheyenne. Wyoming when the temperature never got above -7F (-22C.) This is what the Rawhide Coal Fired Power Plant and solar panels looked like across the border in Colorado. The state is panning on shutting down the coal plant in the next few years, despite the fact that most of Northern Colorado was depending on it for their survival.
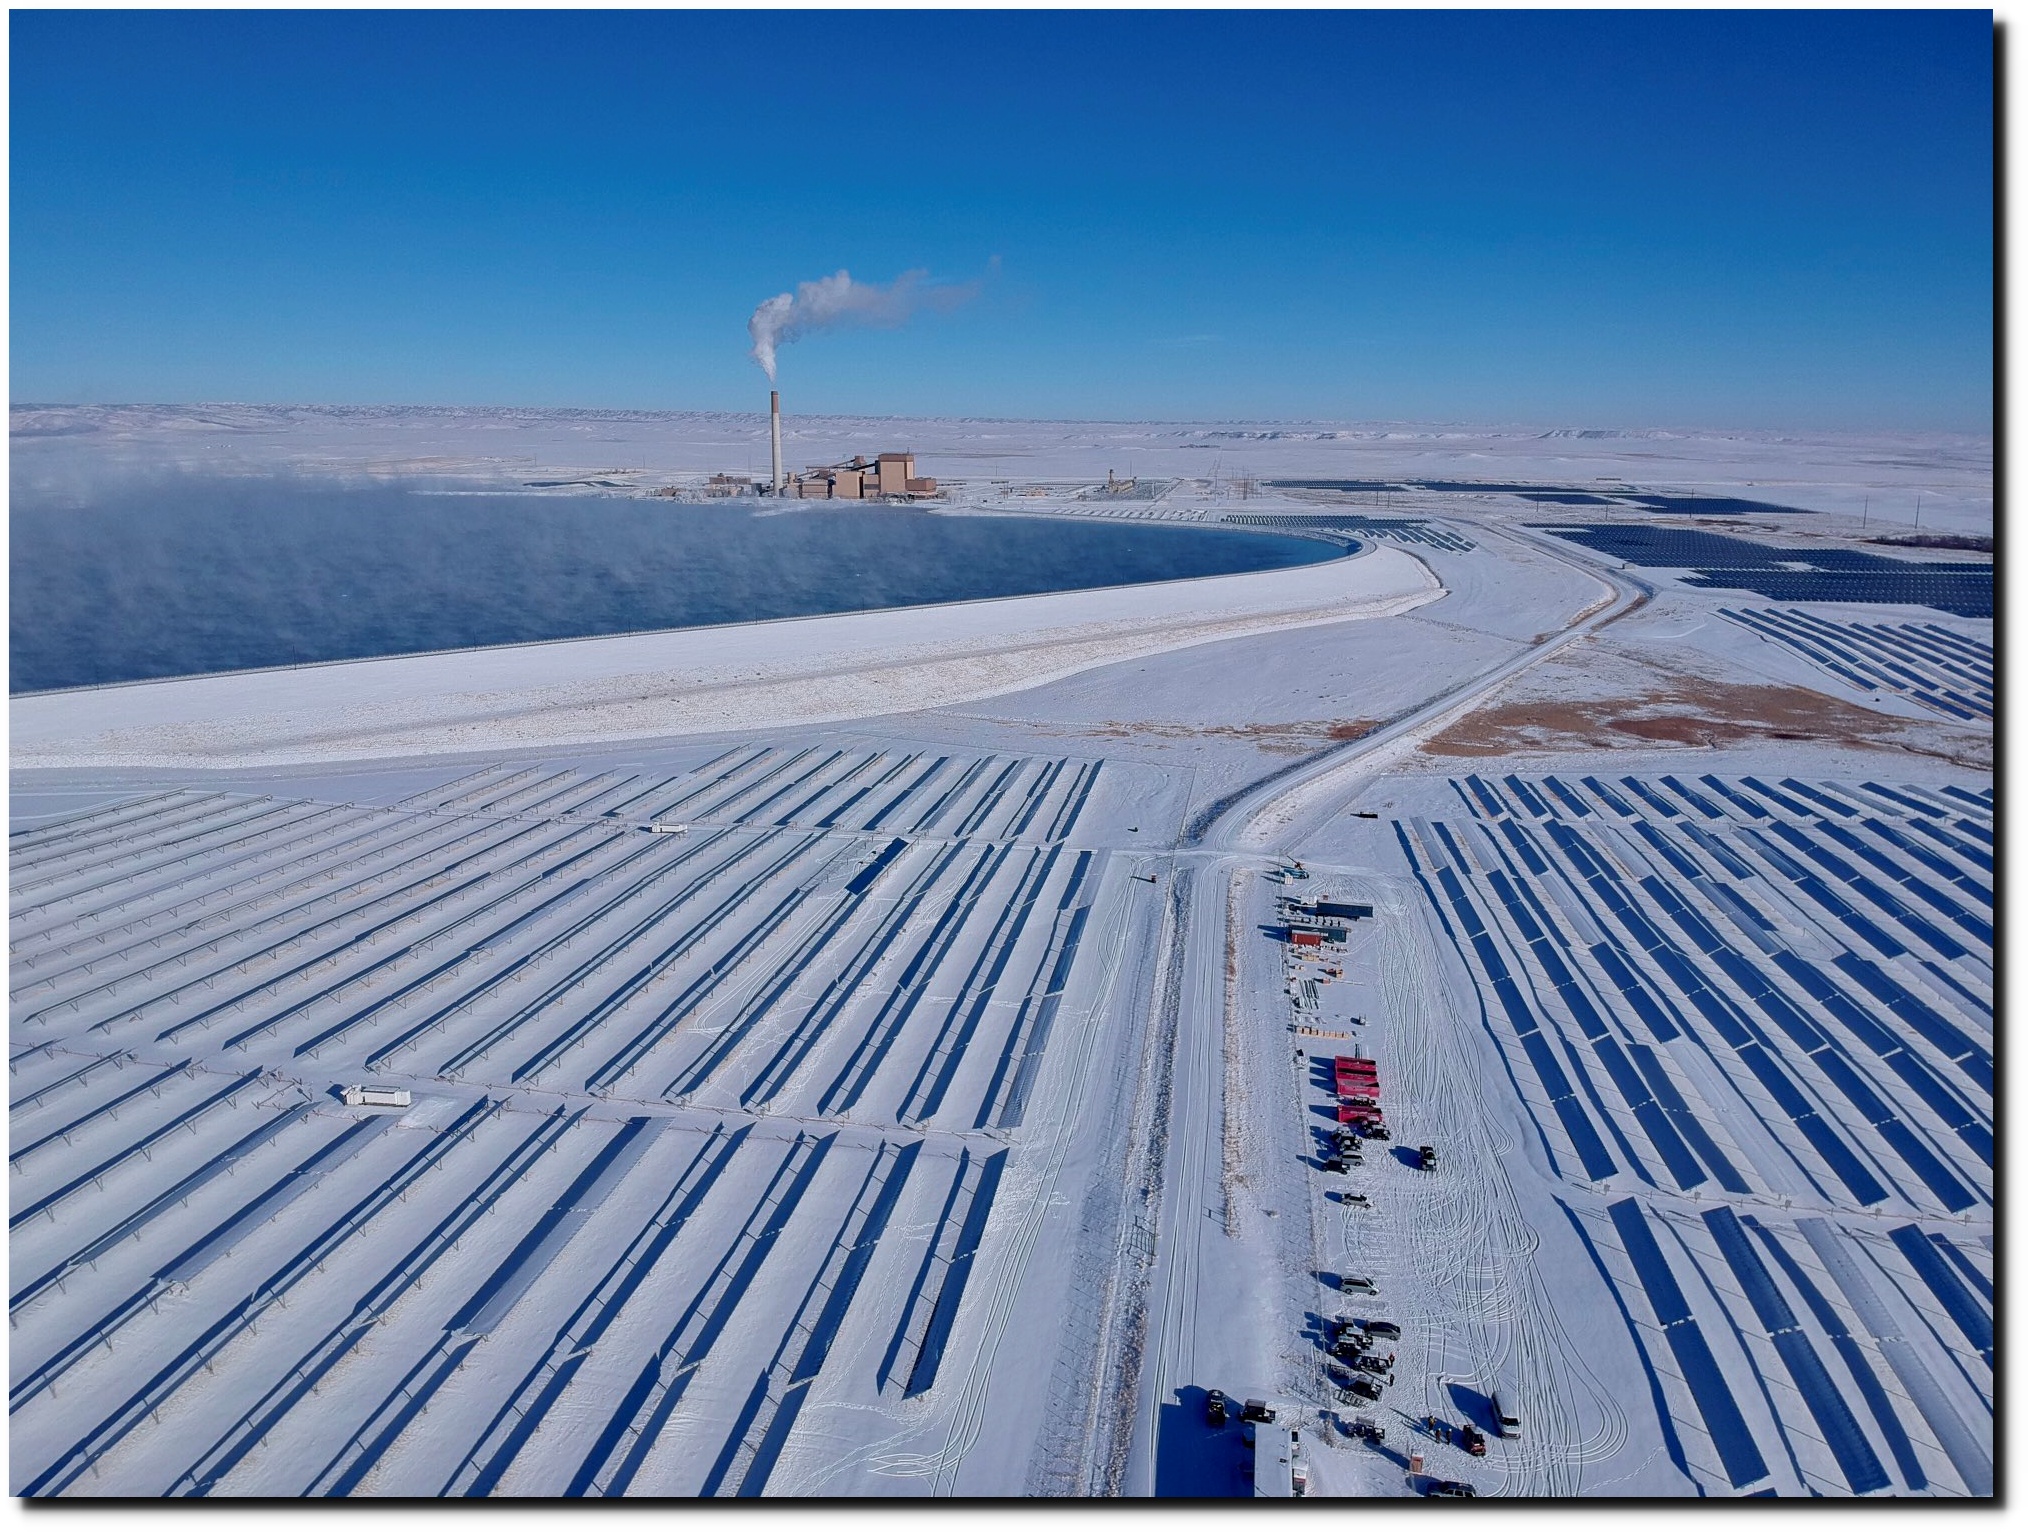
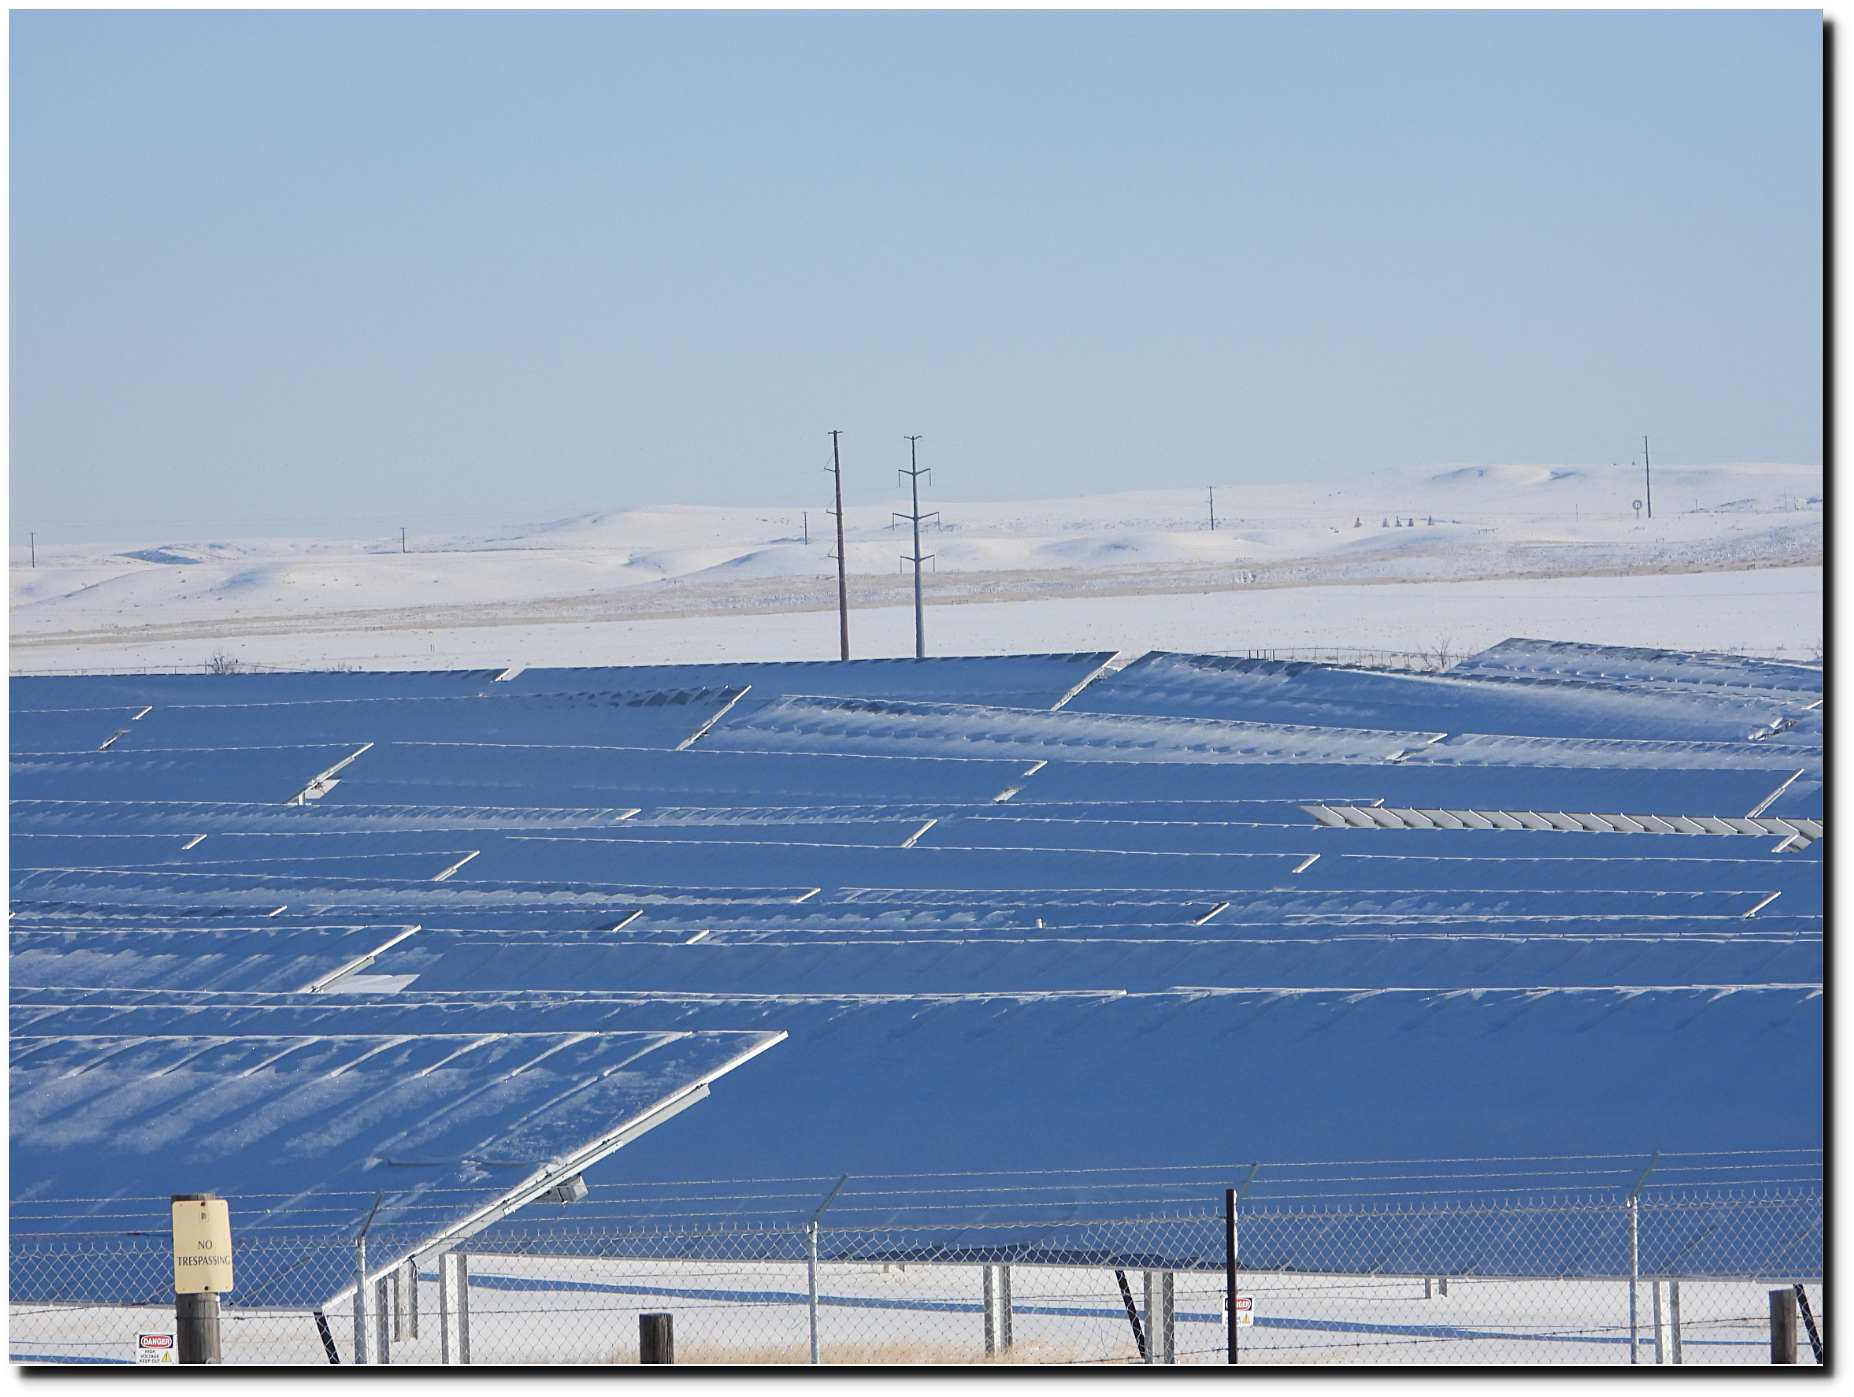
“In recent years, PRPA has shifted more of its energy load to renewable sources, and it plans to reach 100% non-carbon generation by 2030
the intense cold at PRPA’s wind farms in Wyoming forced operators to shut them down. When ice builds on the windmill blades, it creates an imbalance that can damage the turbines, Roalstad said. As it turned out, the wind wasn’t blowing there anyway, so wind farm shutdowns had little impact. Solar resources were also of little to no help because the solar panels were covered with snow. The cold and limited sunshine kept the snow from melting.
Roalstad said that left the utility with two alternatives, and it used both. It bought power from neighboring utilities that might have had some to spare, and it asked consumers to reduce use.
The solution to situations such as this past weekend and what could occur in future years as PRPA and other utilities shut down coal-fired plants will be tapping into larger networks.”


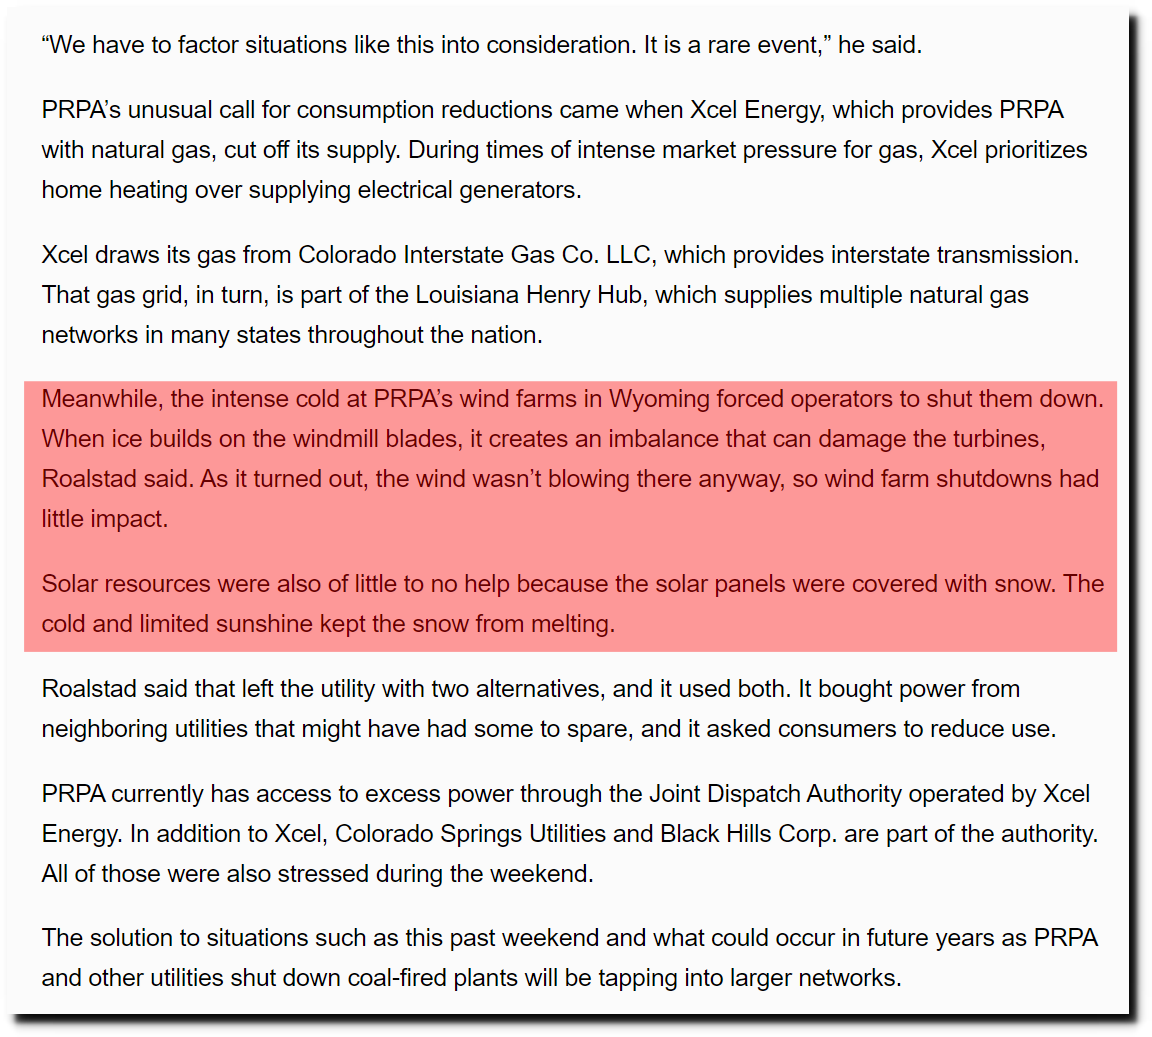
PRPA: Cold snap accentuates importance of energy networks – Loveland Reporter-Herald
Colorado is planning on being bailed out of their irresponsible behavior by Wyoming and Nebraska, but a national mandate from the White House would cause almost everyone to freeze to death next time this happens.
US CO2 emissions have been declining for 15 years, as China’s have skyrocketed. The US could disappear off the map and it would have almost impact on atmospheric CO2.

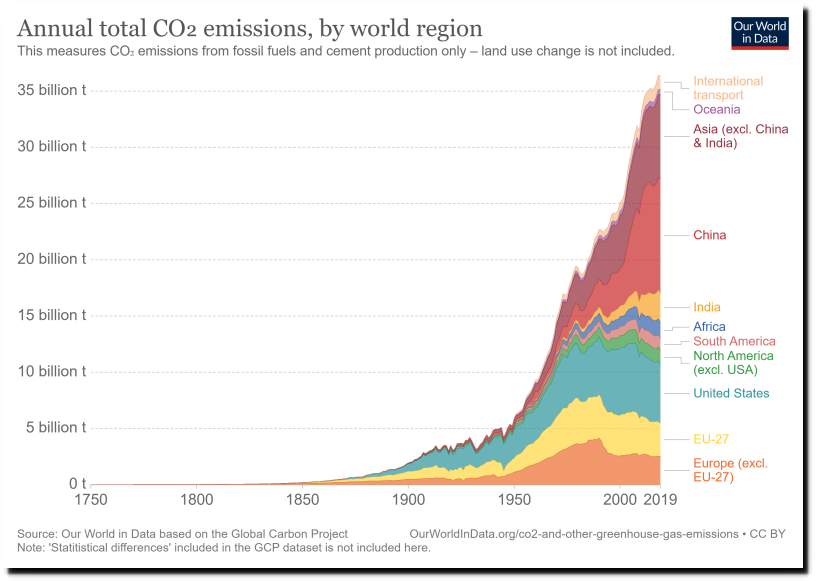
CO? and Greenhouse Gas Emissions – Our World in Data
Even John Kerry admits that the US could drop off the map and it wouldn’t make any difference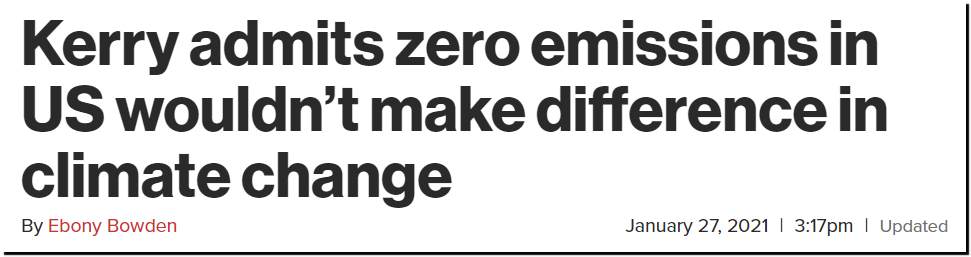
.Kerry: Zero emissions won’t make difference in climate change
Governments don’t have any control of climate.
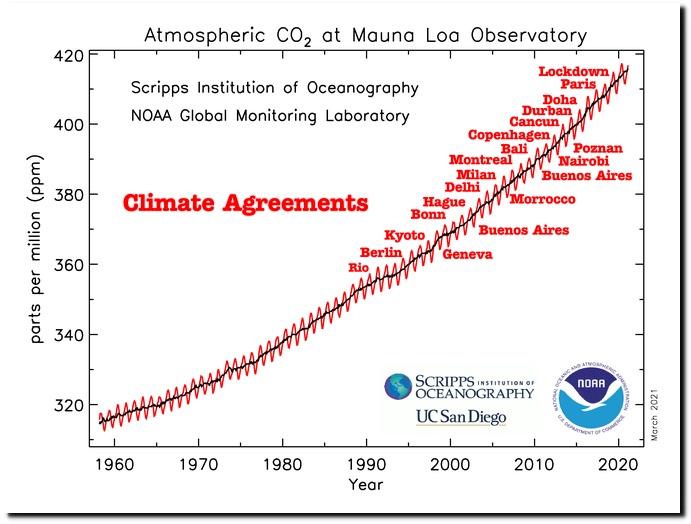
Global Monitoring Laboratory – Carbon Cycle Greenhouse Gases
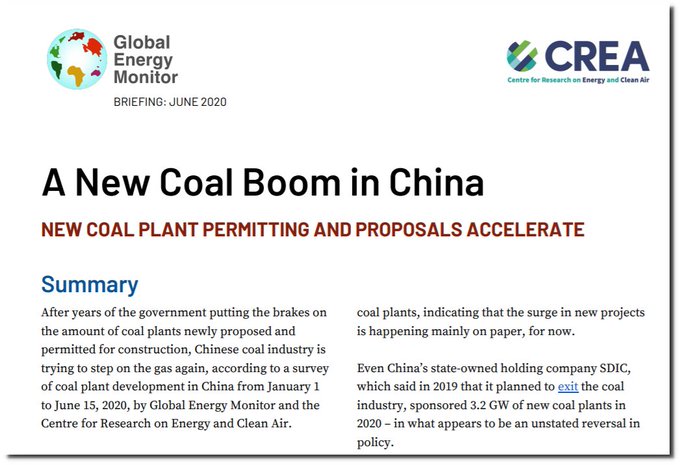
China is building a huge number of new coal fired power plants.
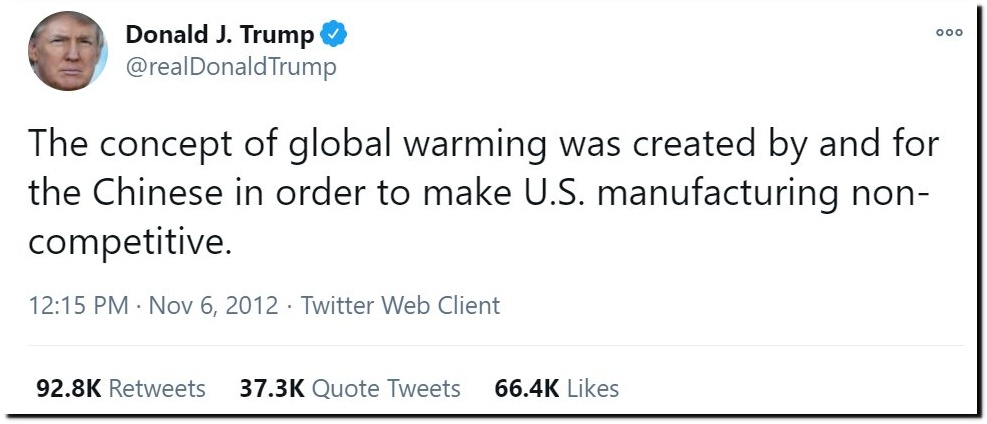
President Trump has understood what is going on for many years, which was one of the reasons for the coup against him and the across the board conspiracy by the press and social media to censor him.
Posted in Uncategorized
Leave a comment
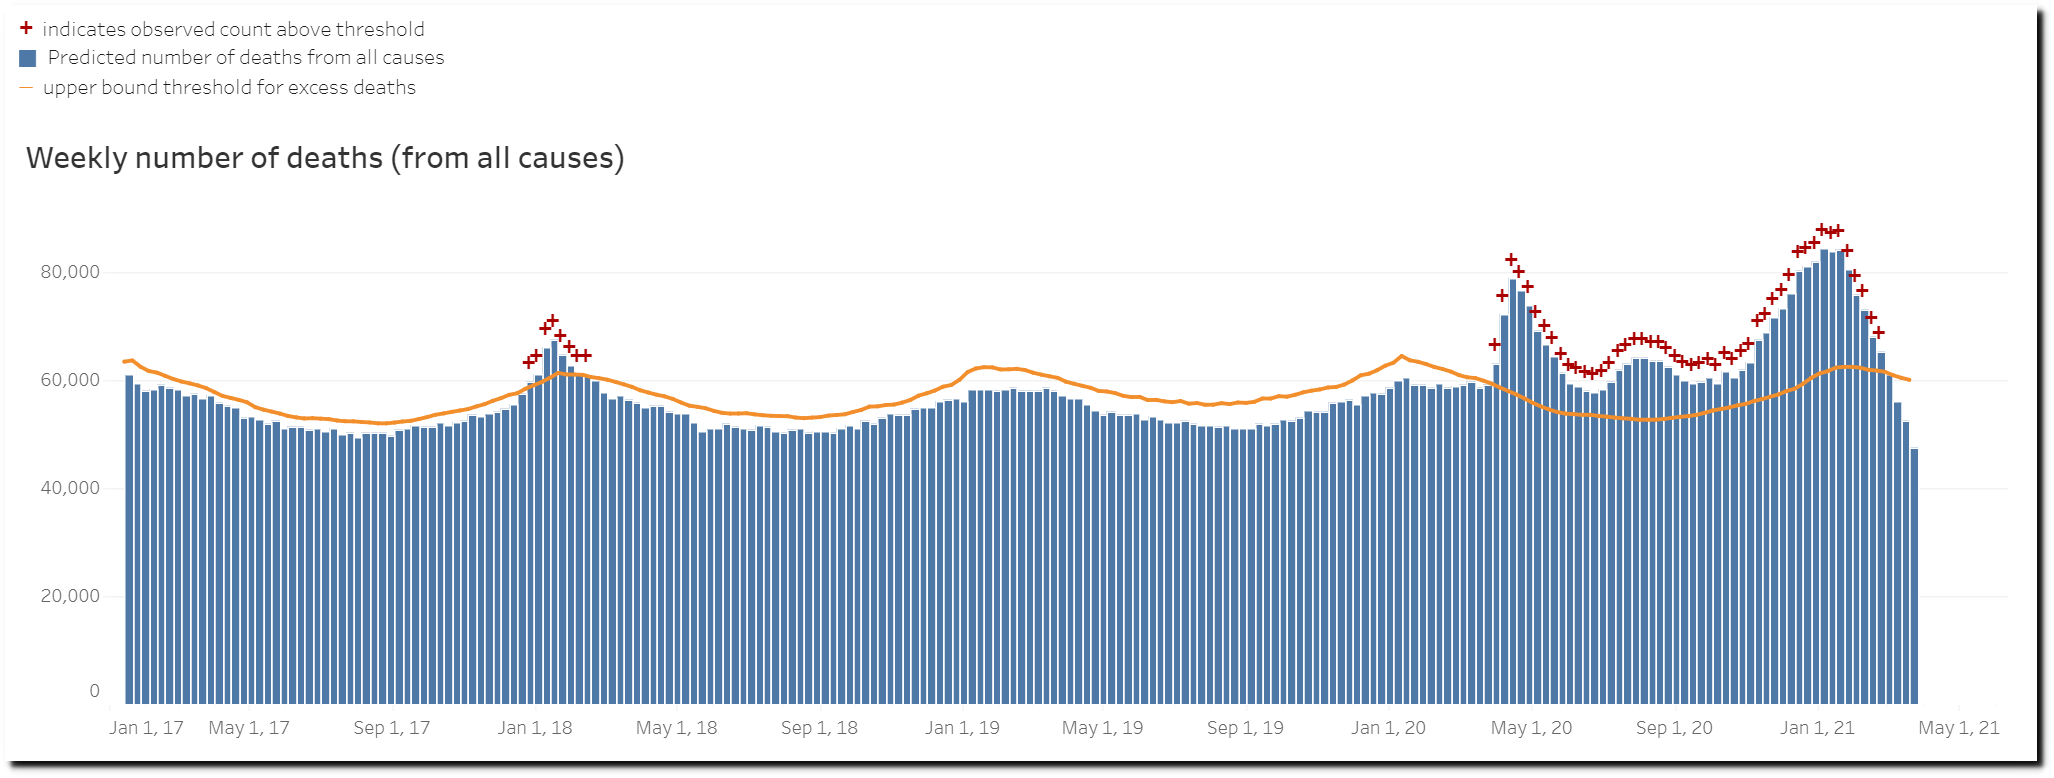
March US Deaths Lowest In At Least Four Years
As part of the ongoing unprecedented health crisis in the US which requires that everyone stay home, wear masks and get injected with something, US deaths last month were well below normal and the lowest in at least four years.
Posted in Uncategorized
Leave a comment
UnScientific UnAmerican
On hundred years ago, Scientific American relied on empirical data. Based on experimental evidence and hundreds of millions of years of earth history, they published this article explaining why increased atmospheric CO2 levels would benefit agriculture.
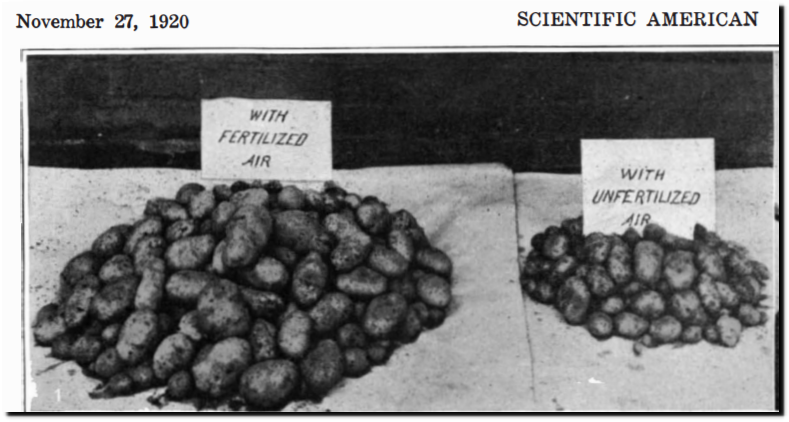
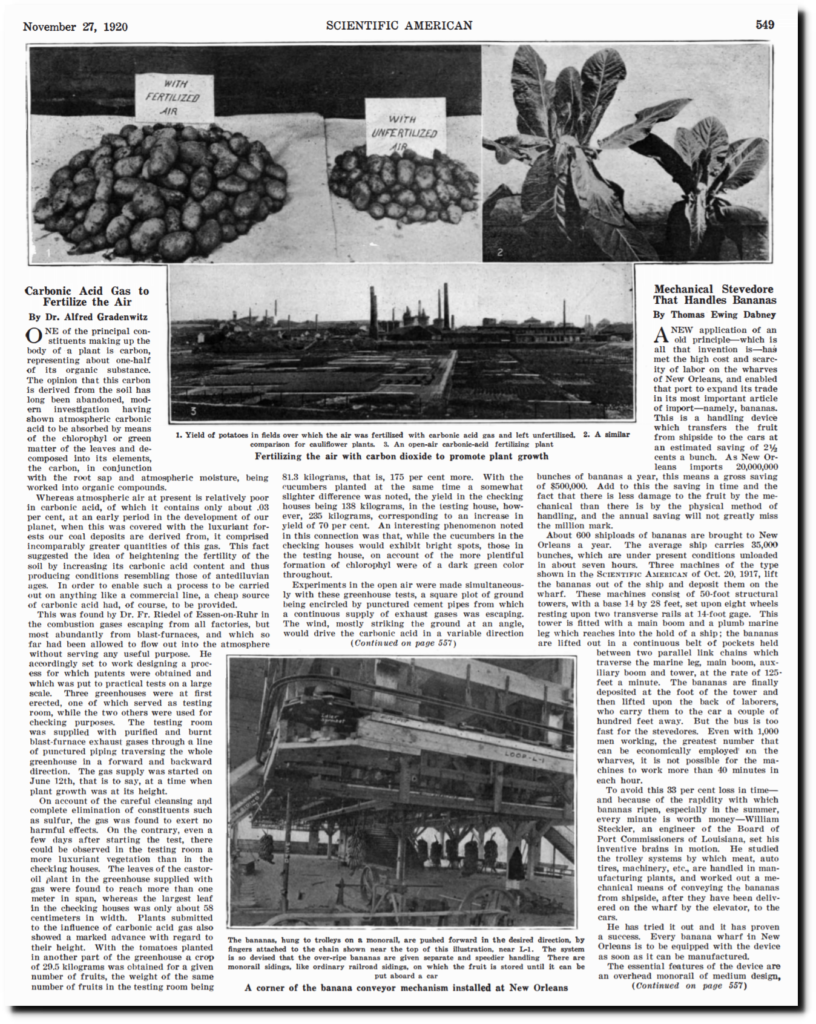
“Fertilizing the air with carbon dioxide to promote plant growth
ONE of the principal constituents making up the body of a plant is carbon, representing about one-half of its organic substance. The opinion that this carbon is derived from the soil has long been abandoned, modern investigation having shown atmospheric carbonic acid to be absorbed by means 0f the chlorophyll 0r green matter of the leaves and decomposed into its elements, the carbon, in conjunction with the root sap and atmospheric m0isture, being worked into organic compounds.
Whereas atmospheric air at present is relatively poor in carb0nic acid, of which it contains only about .03 per cent, at an early period in the development of our planet, when this was covered with the luxuriant forests our coal deposits are derived from, it comprised incomparably greater quantities of this gas. This fact suggested the idea of heightening the fertility of the soil by increasing its carbonic acid content and thus producing conditions resembling those of antediluvian ages.”
This view has been confirmed by lots more empirical data since the 1920 article.
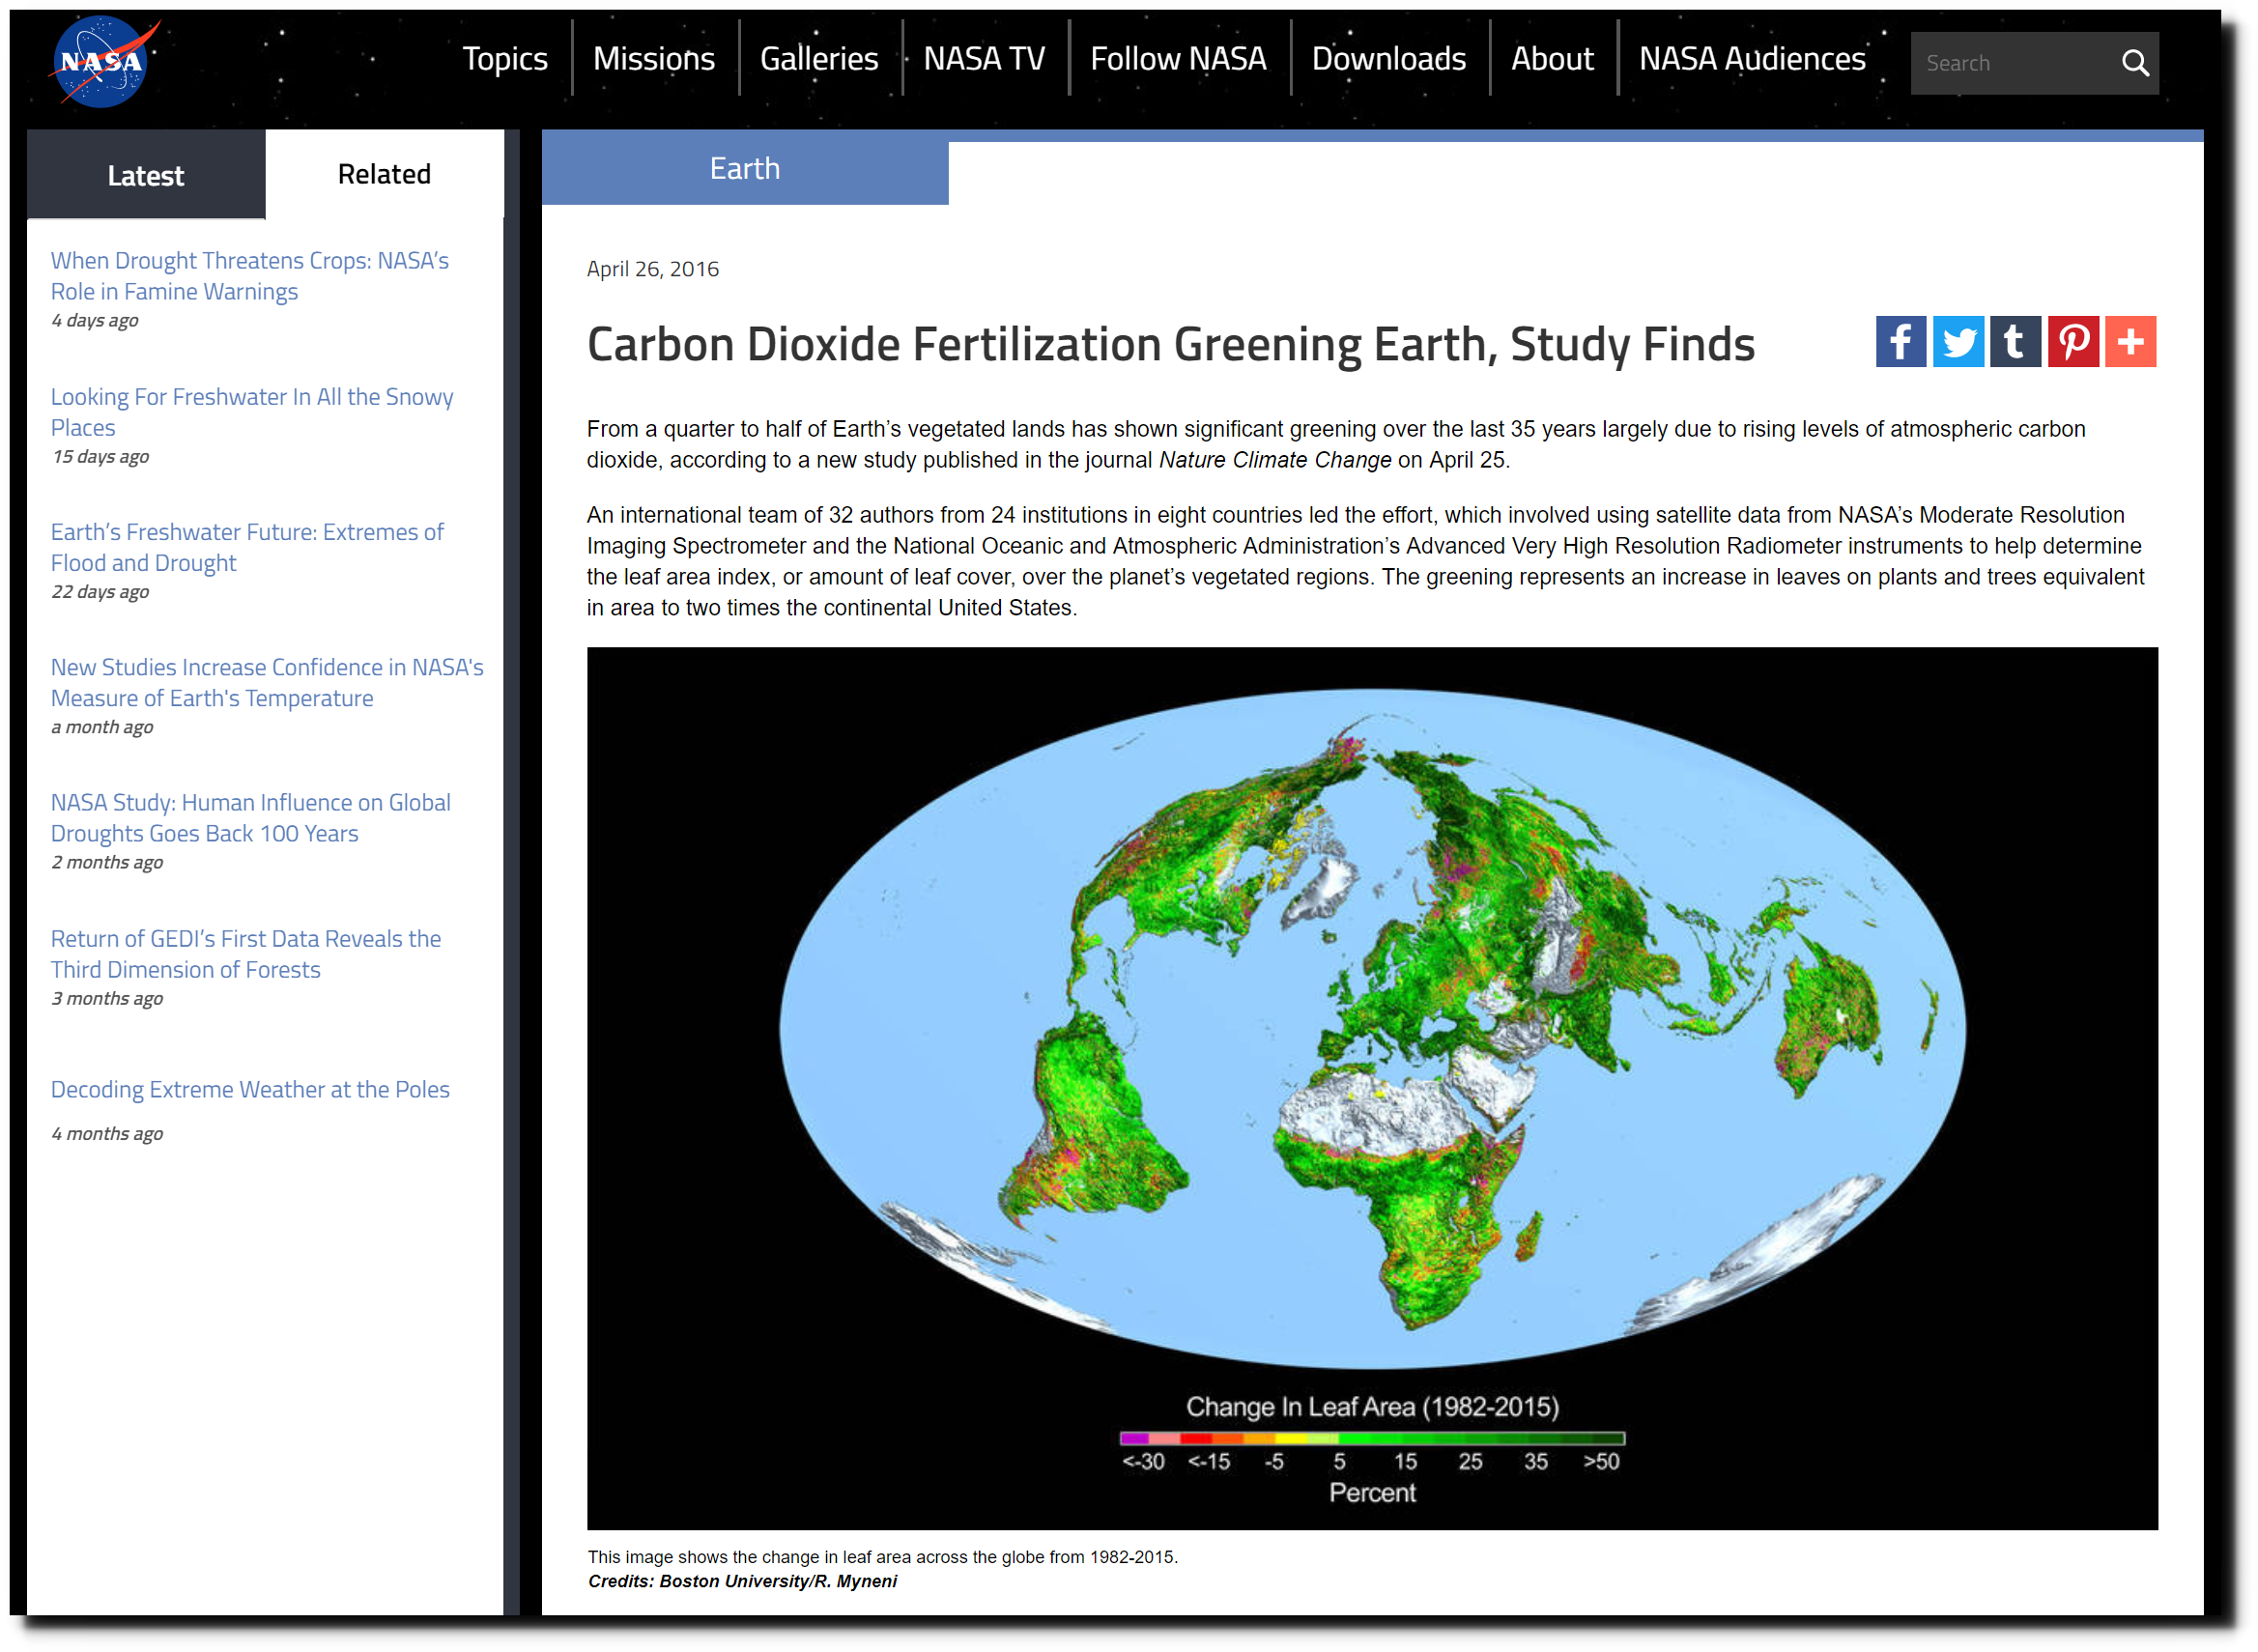
Carbon Dioxide Fertilization Greening Earth, Study Finds | NASA

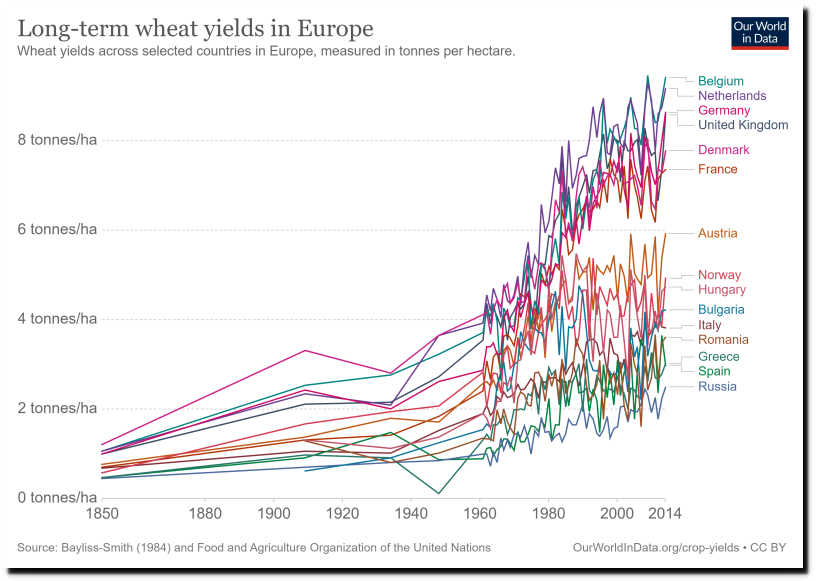
Crop Yields – Our World in Data
But now Scientific American no longer relies on evidence, and instead promotes baseless speculation by people whom they call “experts.”
Climate change’s negative effects on plants will likely outweigh any gains from elevated atmospheric carbon dioxide levels
many skeptics also fail to mention the potentially most harmful outcome of rising atmospheric CO2 on vegetation: climate change itself. Its negative consequences—such as drought and heat stress—would likely overwhelm any direct benefits that rising CO2 might offer plant life.
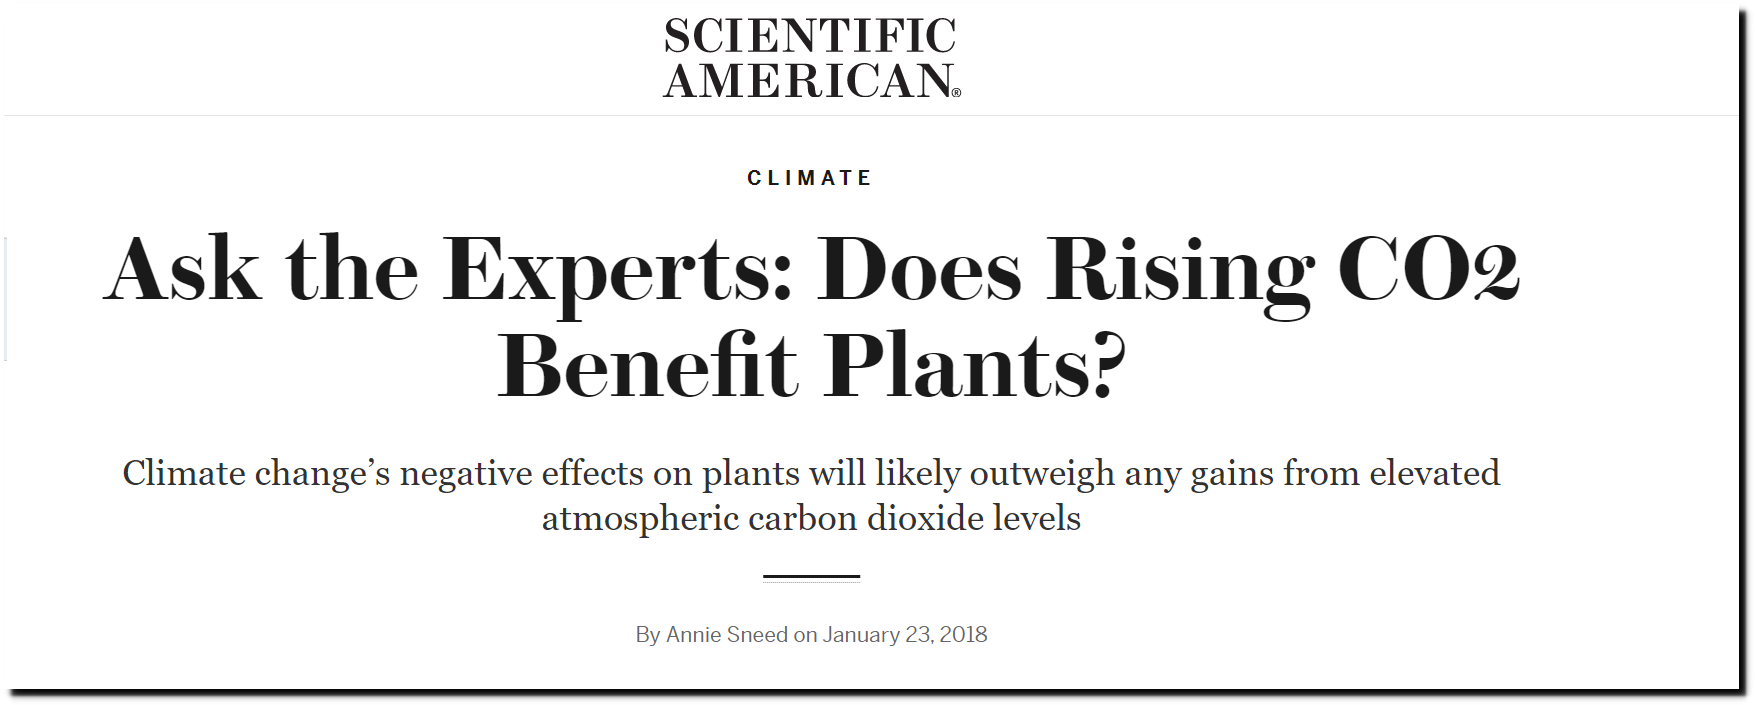
Ask the Experts: Does Rising CO2 Benefit Plants? – Scientific American
The greatest expansion of life on earth occurred when CO2 was at its peak 540 million years ago.
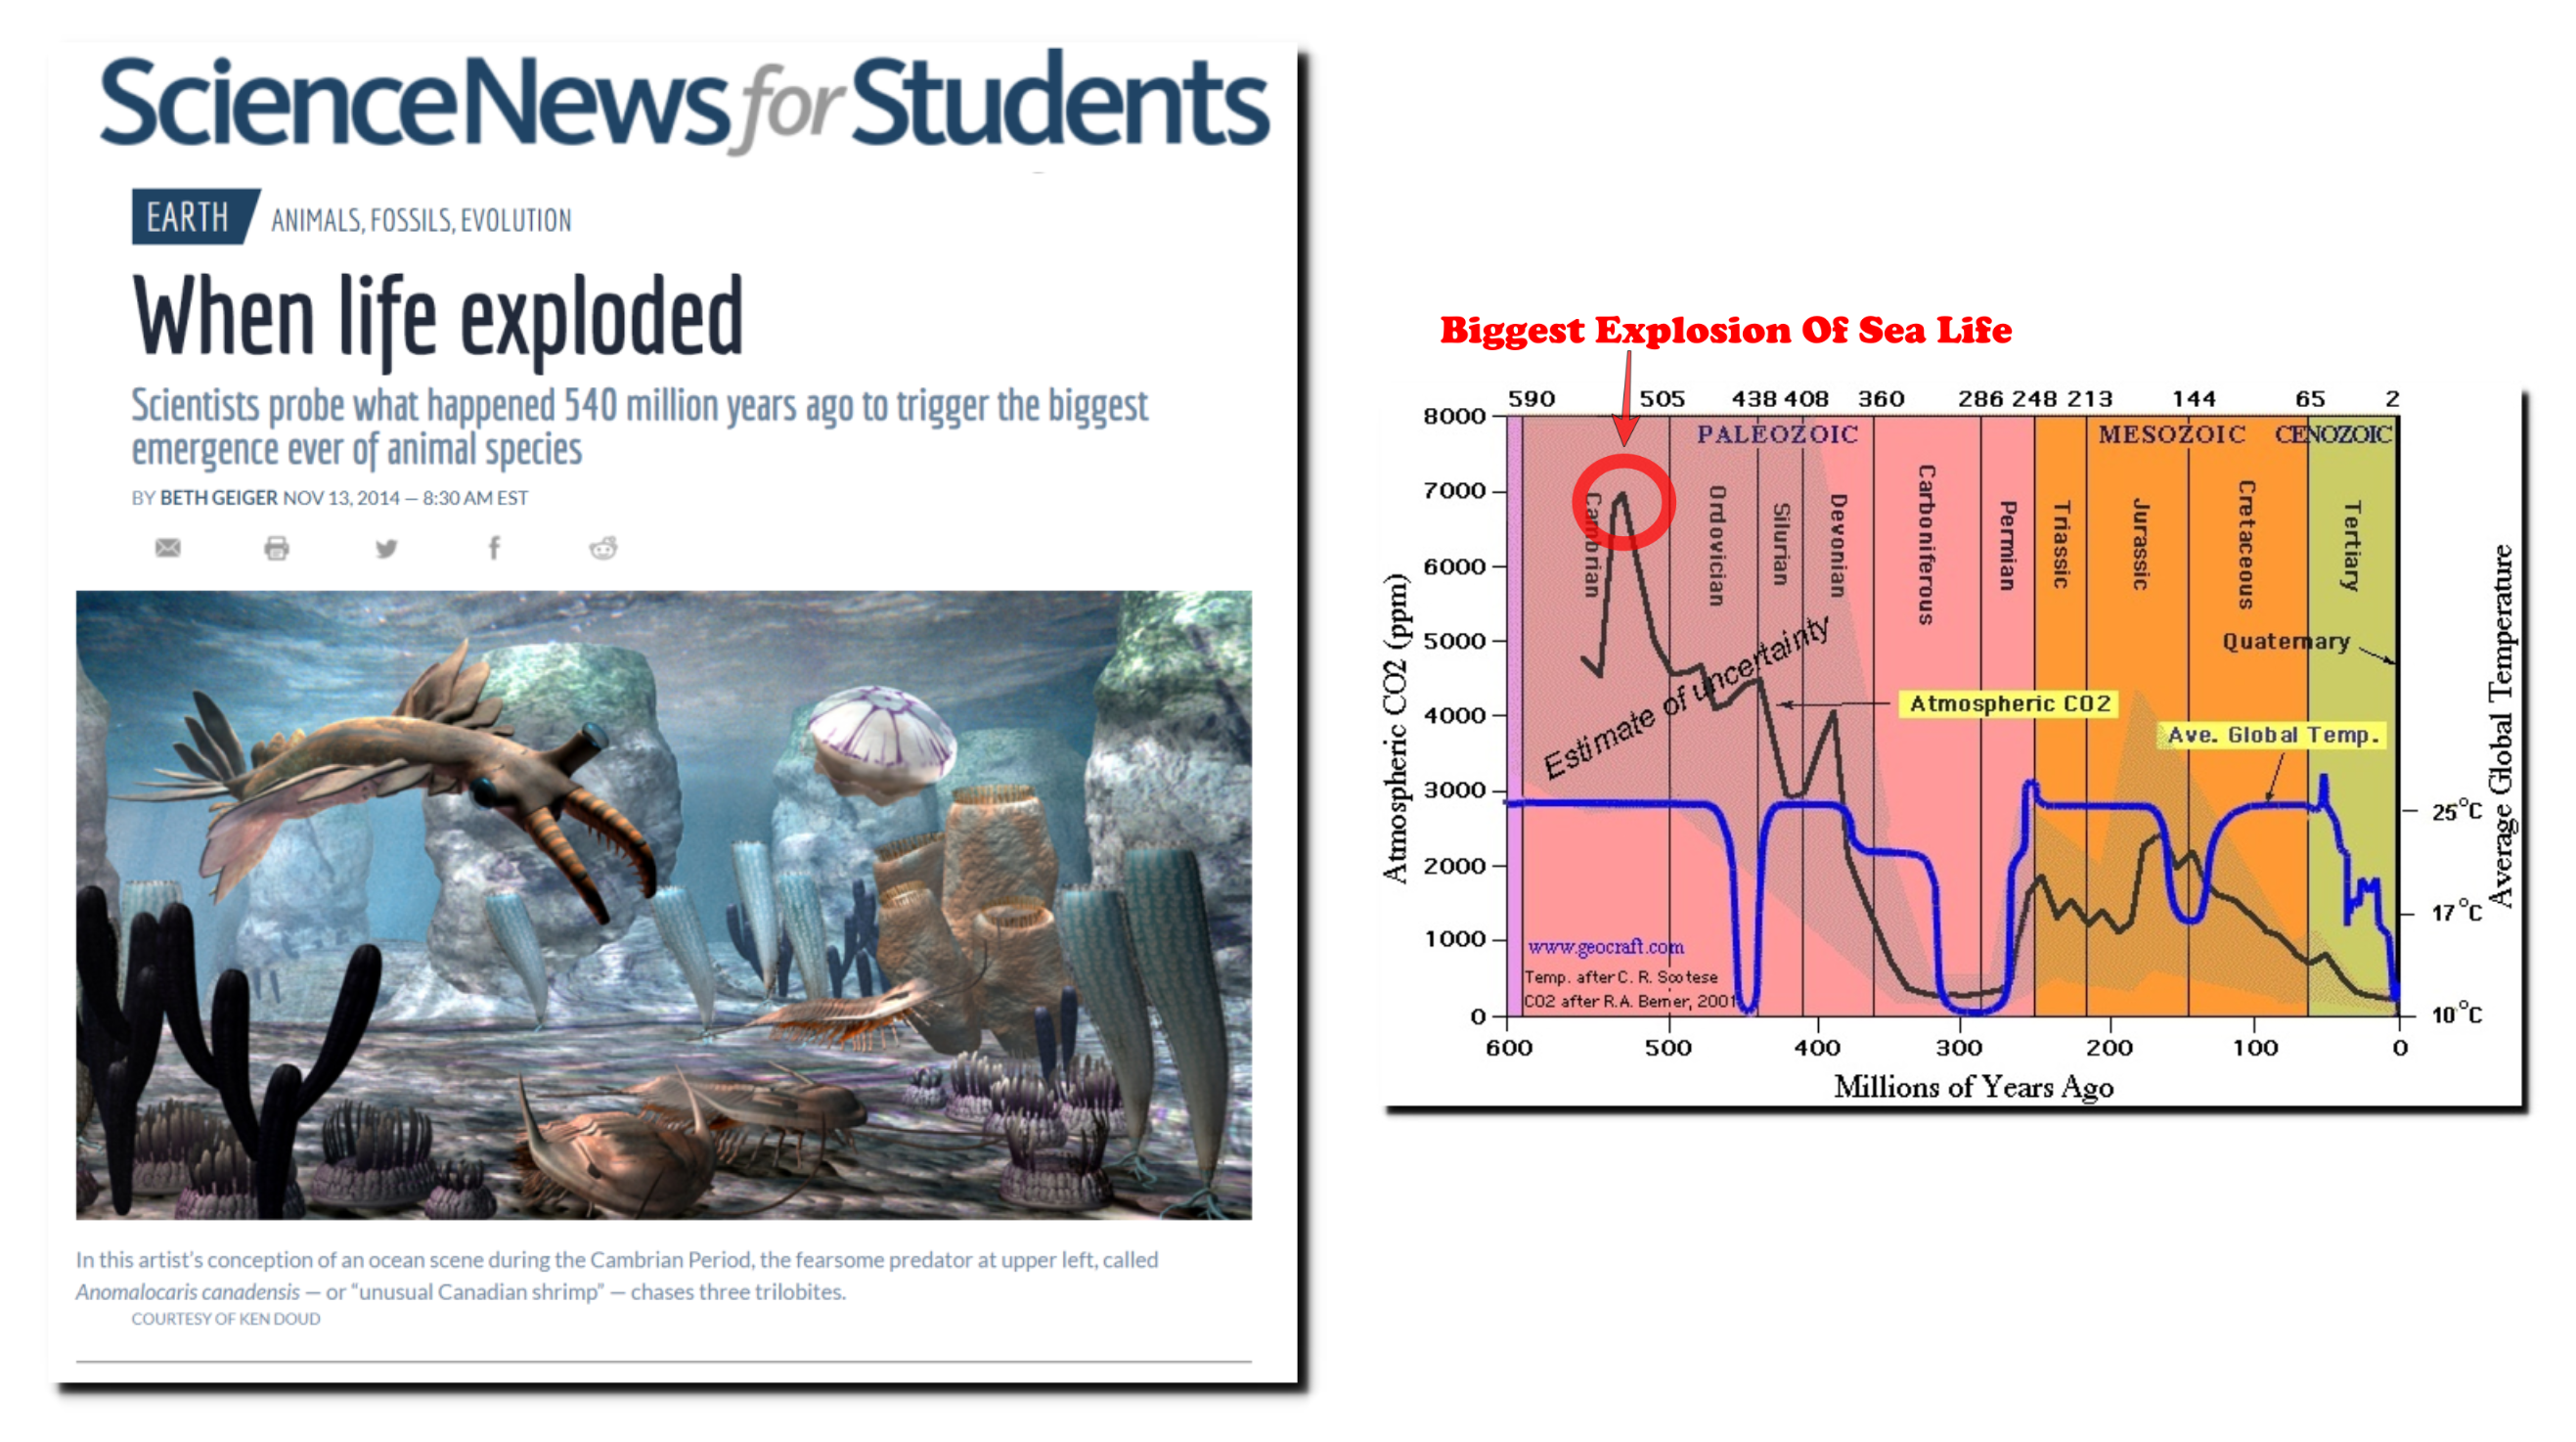
When life exploded | Science News for Students
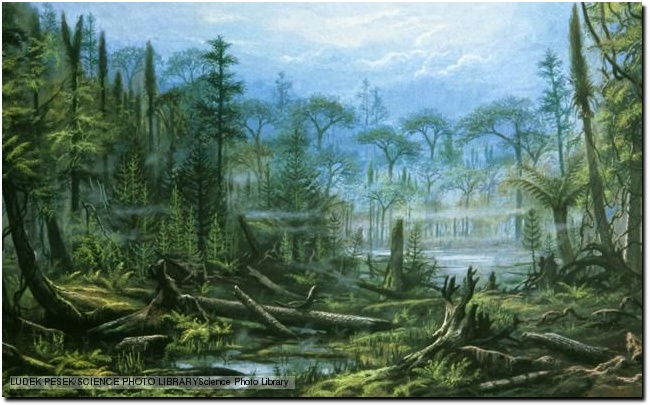
Plant life thrived when CO2 levels were much higher during the early Carboniferous Era. That is the reason we have our current coal beds, which are sequestered CO2.
Scientific American is rejecting basic science which has been known for centuries, and replacing it with mindless and inflammatory anti-science propaganda.
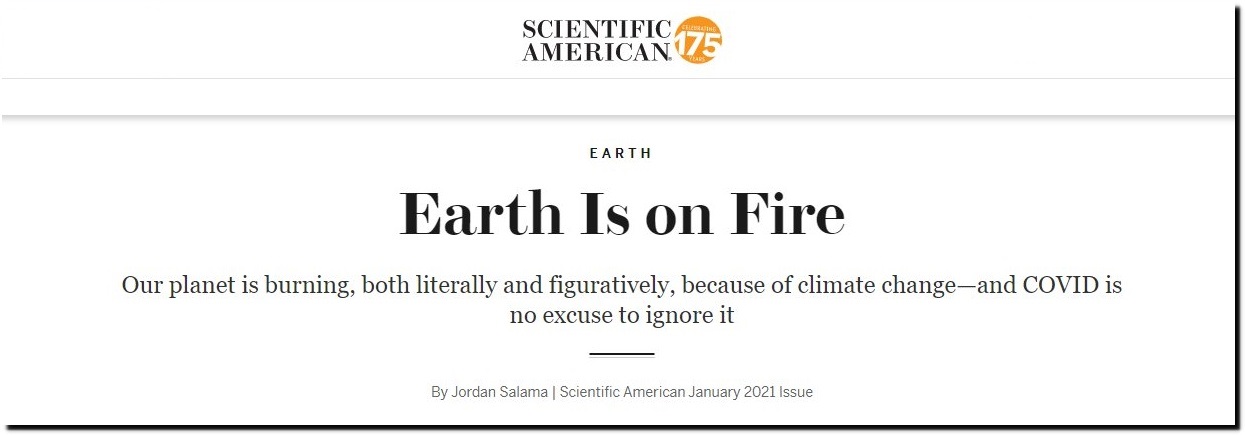
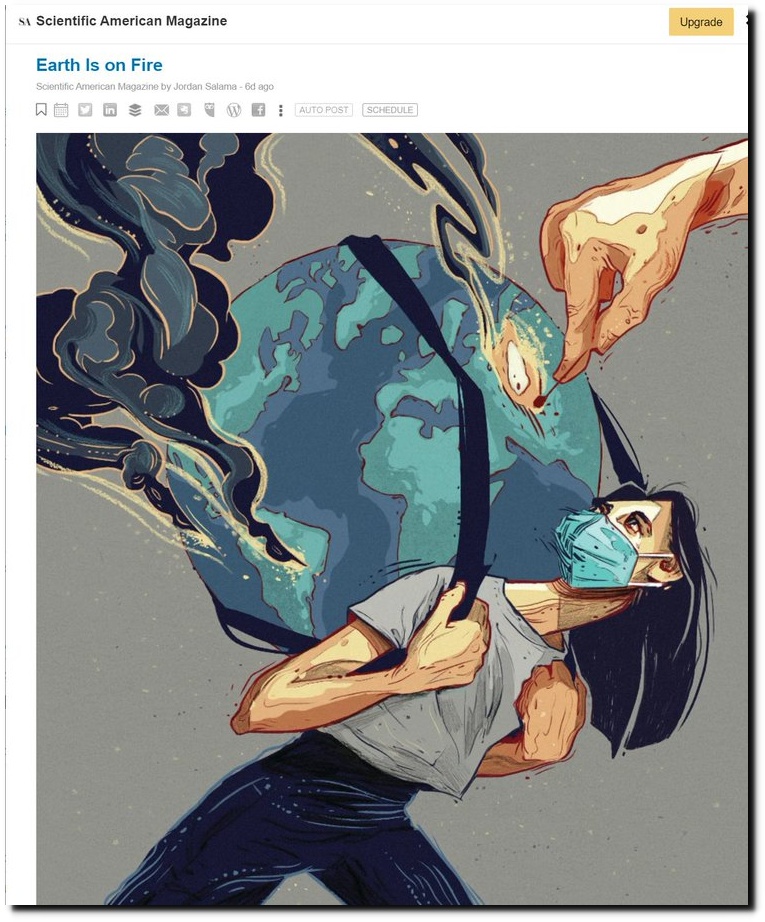 The Earth Is on Fire – Scientific American
We Broke the Atmosphere; Here’s a Way We Can Start to Fix It – Scientific American Blog Network
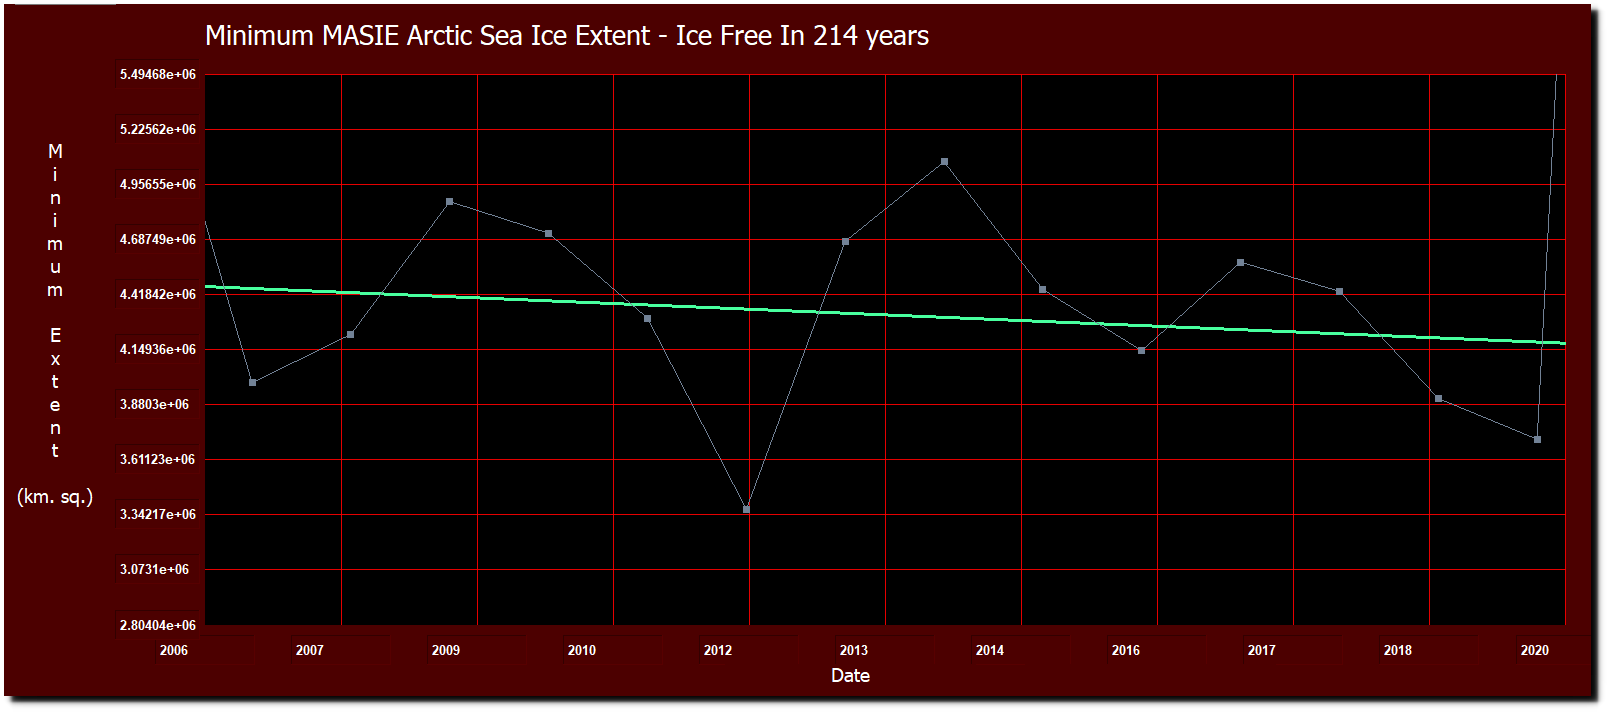
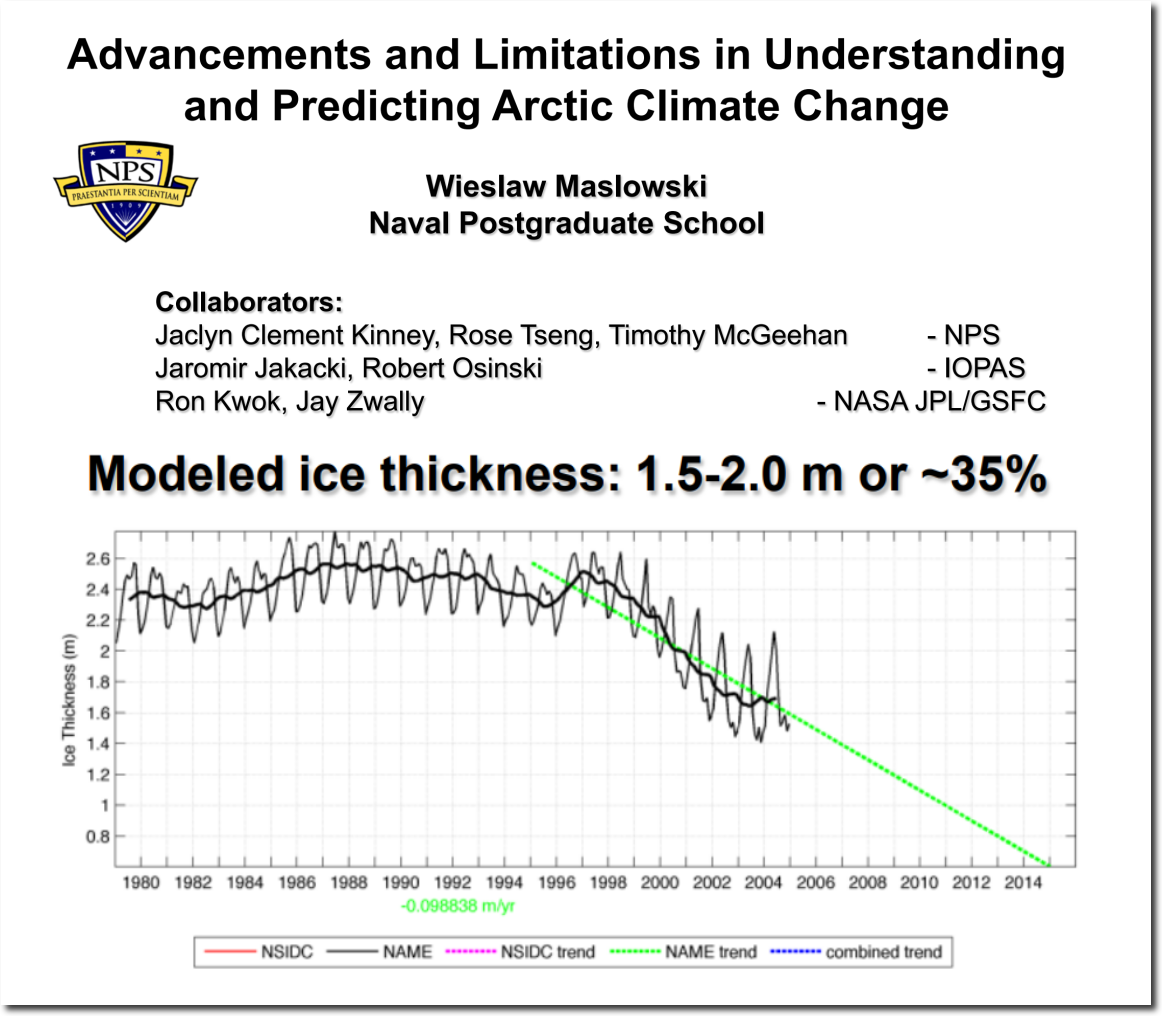
In 2012, Scientific American said that the scientific community had a range of opinions about when Arctic sea ice will be gone, ranging from before 2015 to “by 2030 or 2040.”
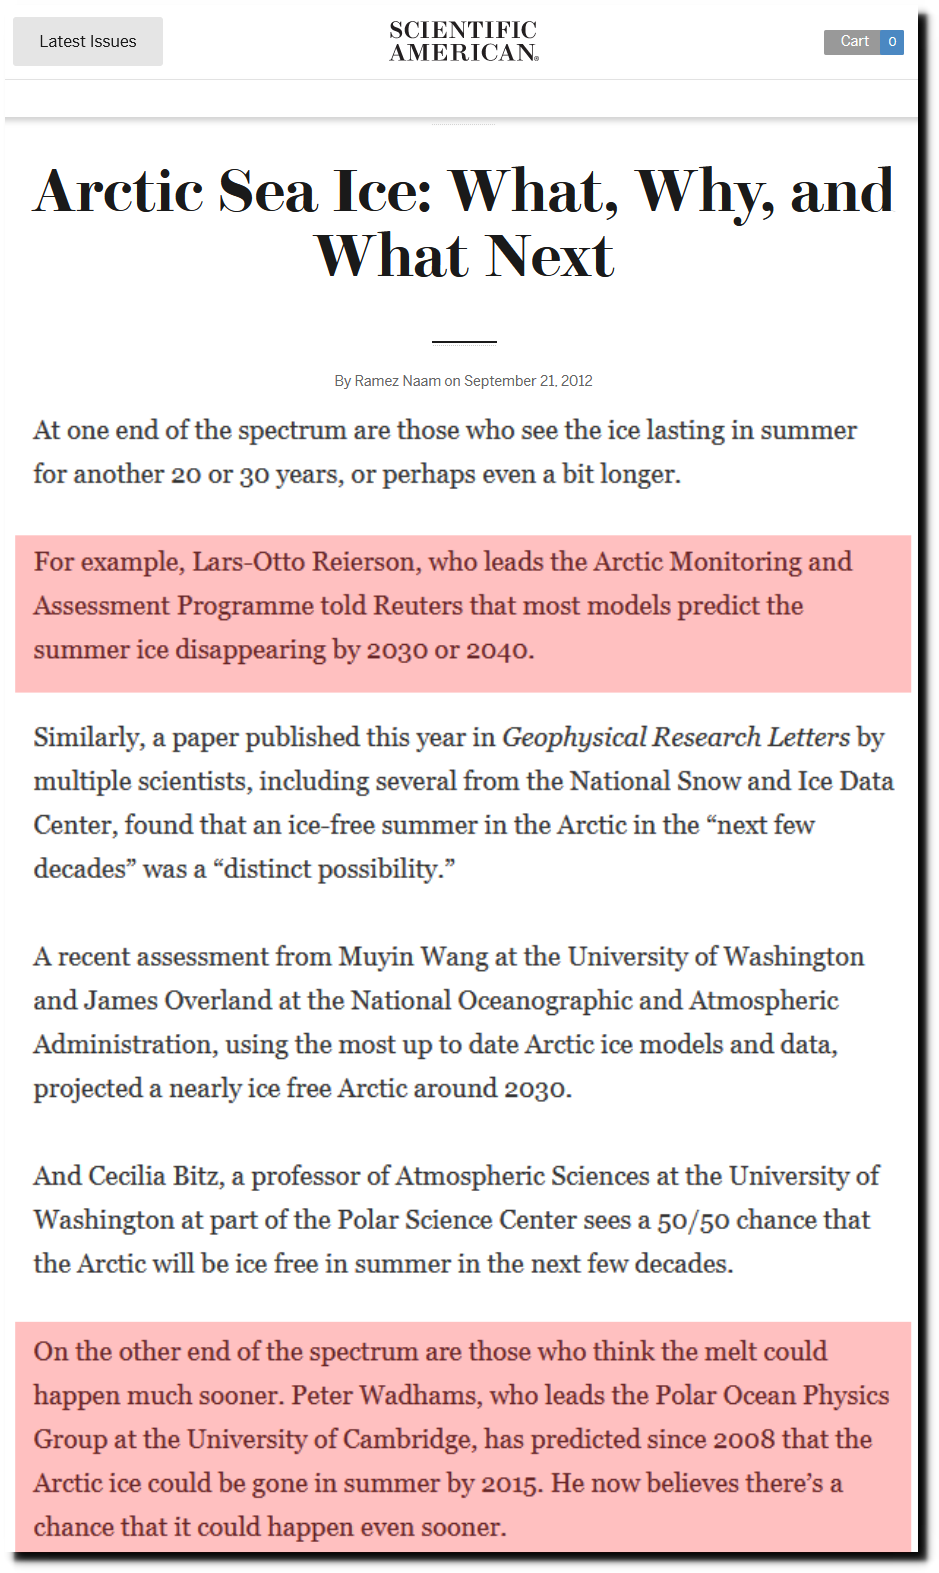
Arctic Sea Ice: What, Why, and What Next – Scientific American Blog Network
If we look at the actual trend in sea ice data since the start of MASIE records in 2006, the Arctic won’t be ice-free for 270 years.
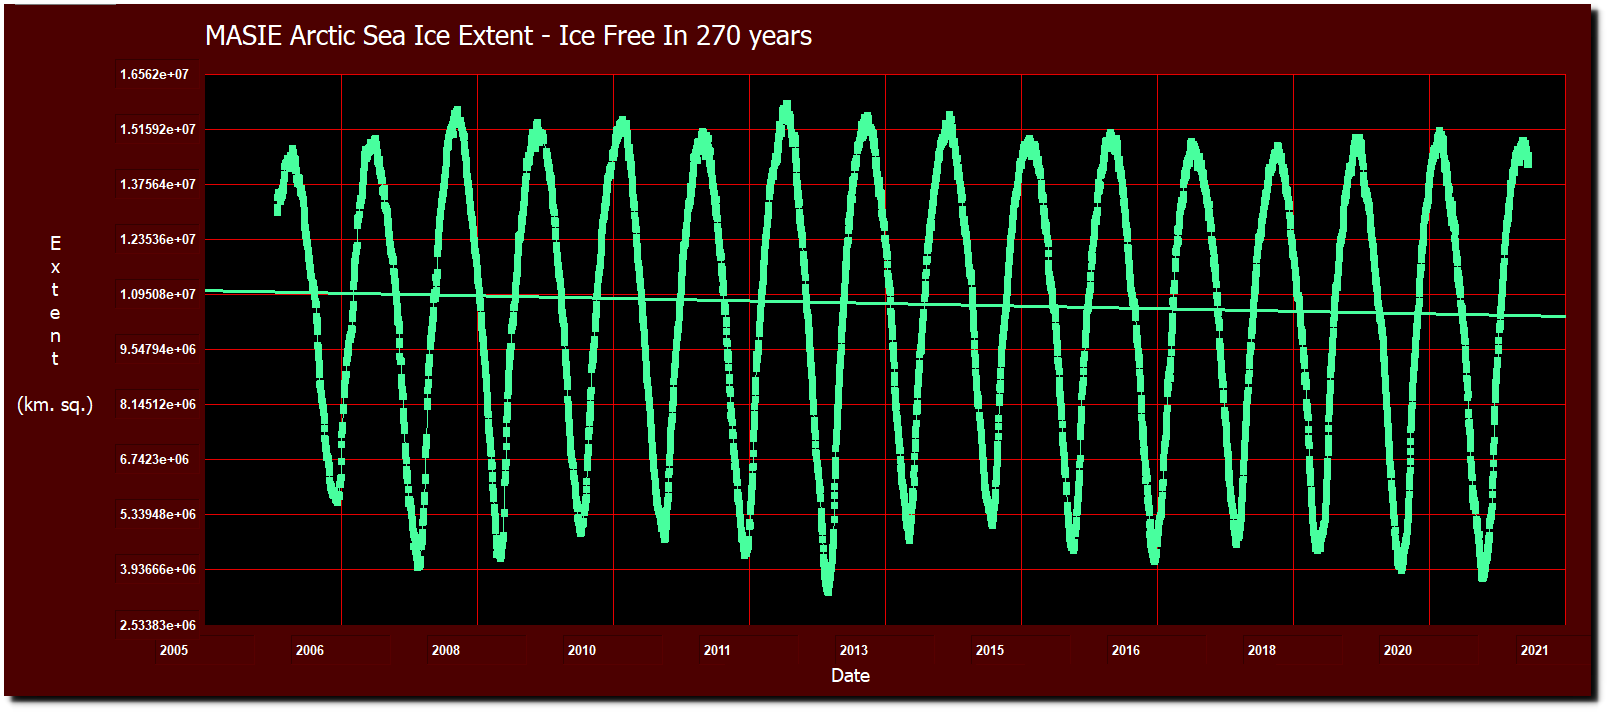
Based on the summer minimum extent over the past 14 years, the Arctic won’t be ice-free for 214 years. The “experts” being quoted by Scientific American are simply making numbers up.
Our top experts said the Arctic would be ice-free by 2008.
Expert: Arctic polar cap may disappear this summer_English_Xinhua
North Pole May Be Ice-Free for First Time This Summer
BBC NEWS | UK | Swimmer aims to kayak to N Pole
Star-News – Google News Archive Search
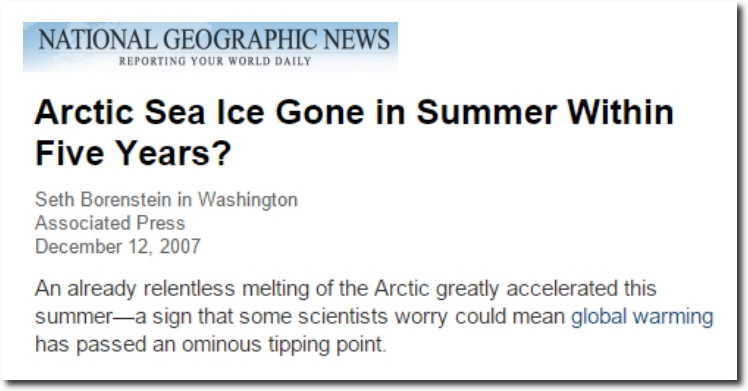
Arctic Sea Ice Gone in Summer Within Five Years?
BBC NEWS | Science/Nature | Arctic summers ice-free ‘by 2013’
Gore: Polar ice cap may disappear by summer 2014
The Argus-Press – Google News Archive Search
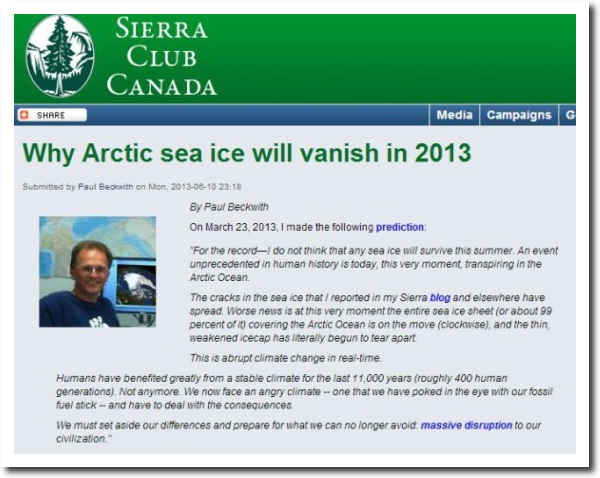
Why Arctic sea ice will vanish in 2013 | Sierra Club Canada
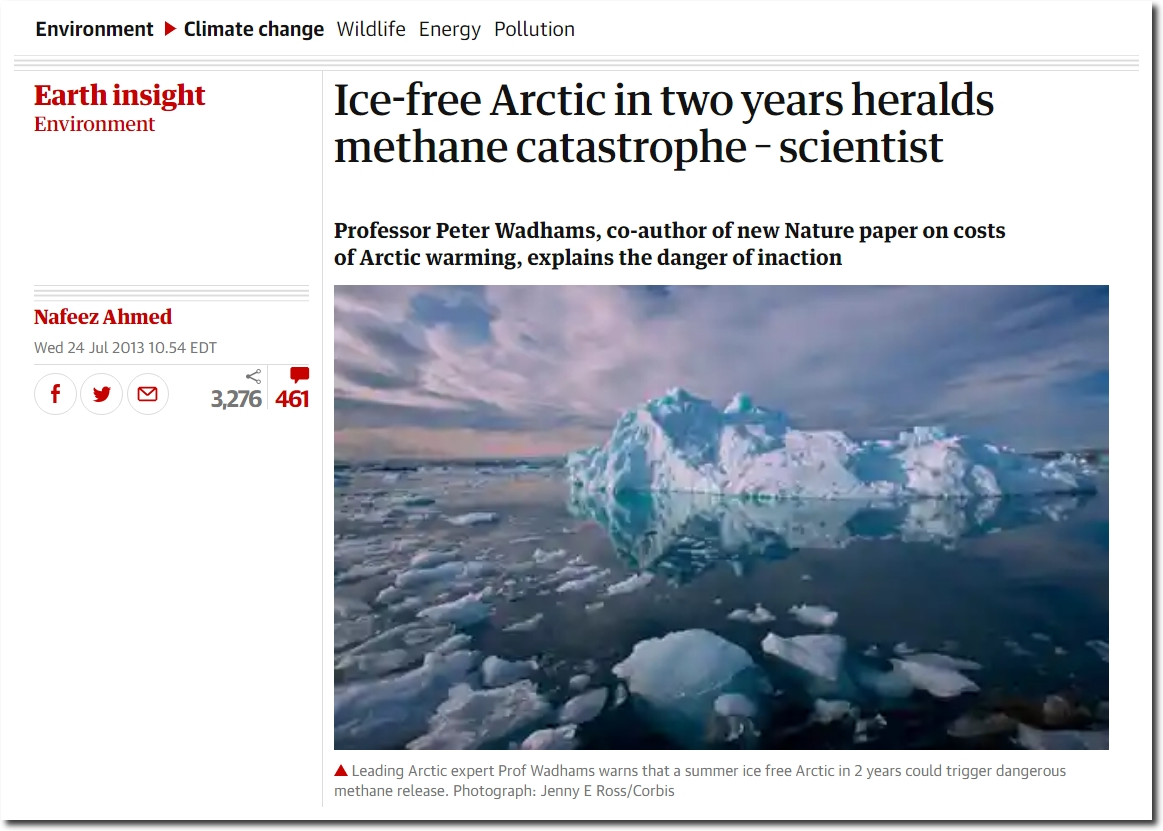
Ice-free Arctic in two years heralds methane catastrophe – scientist | Environment | The Guardian
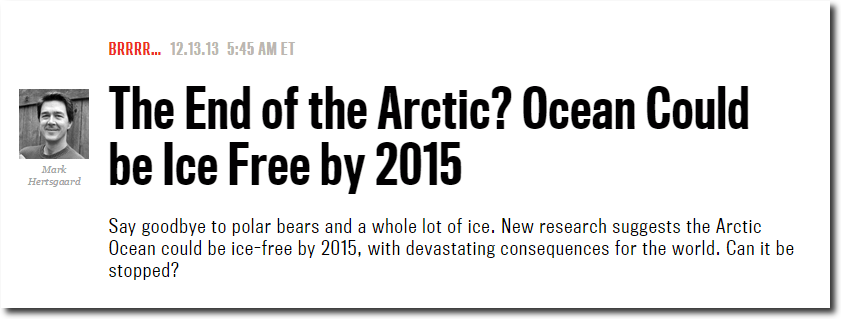
The End of the Arctic? Ocean Could be Ice Free by 2015 – The Daily Beast
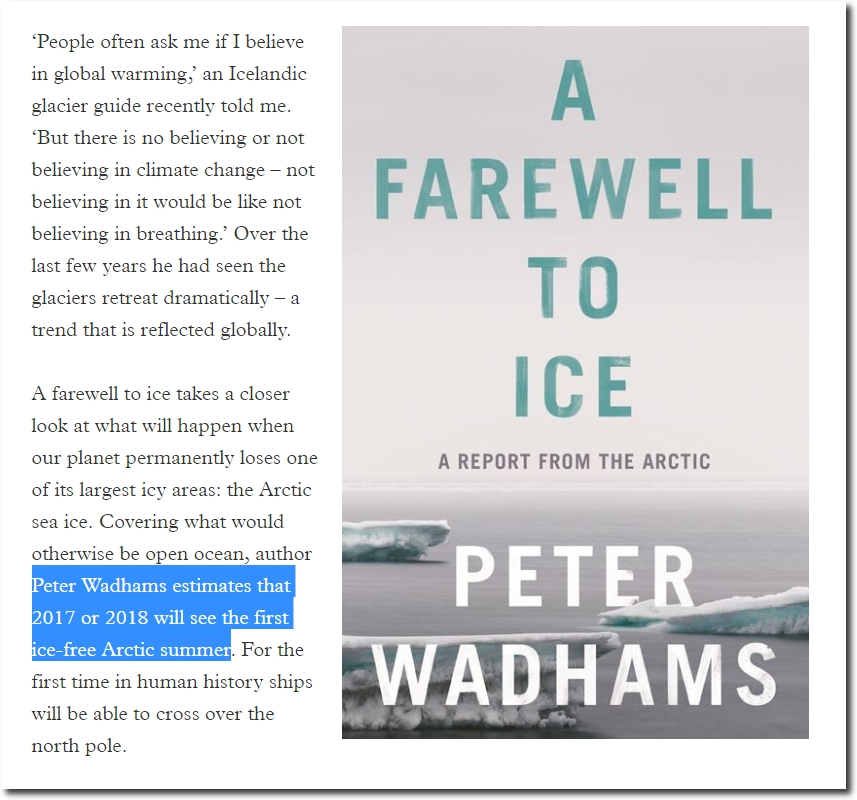
A farewell to ice | Review | Chemistry World
And President Obama’s science adviser predicted ice-free winters.
…if you lose the summer sea ice, there are phenomena that could lead you not so very long thereafter to lose the winter sea ice as well. And if you lose that sea ice year round, it’s going to mean drastic climatic change all over the hemisphere.
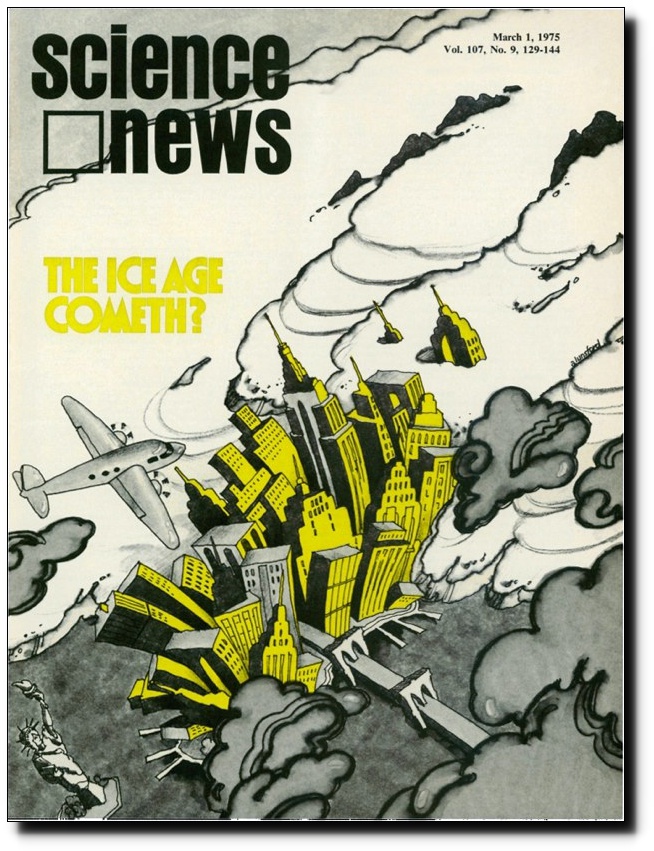
Scientific American has tried to erase the history of the 1970s global cooling scare, saying that it consisted of nine paragraphs in Newsweek.
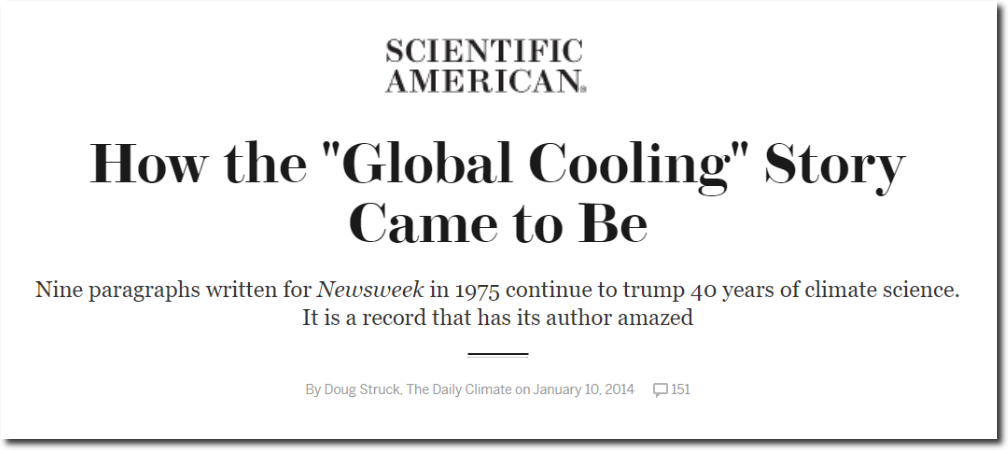
How the “Global Cooling” Story Came to Be – Scientific American
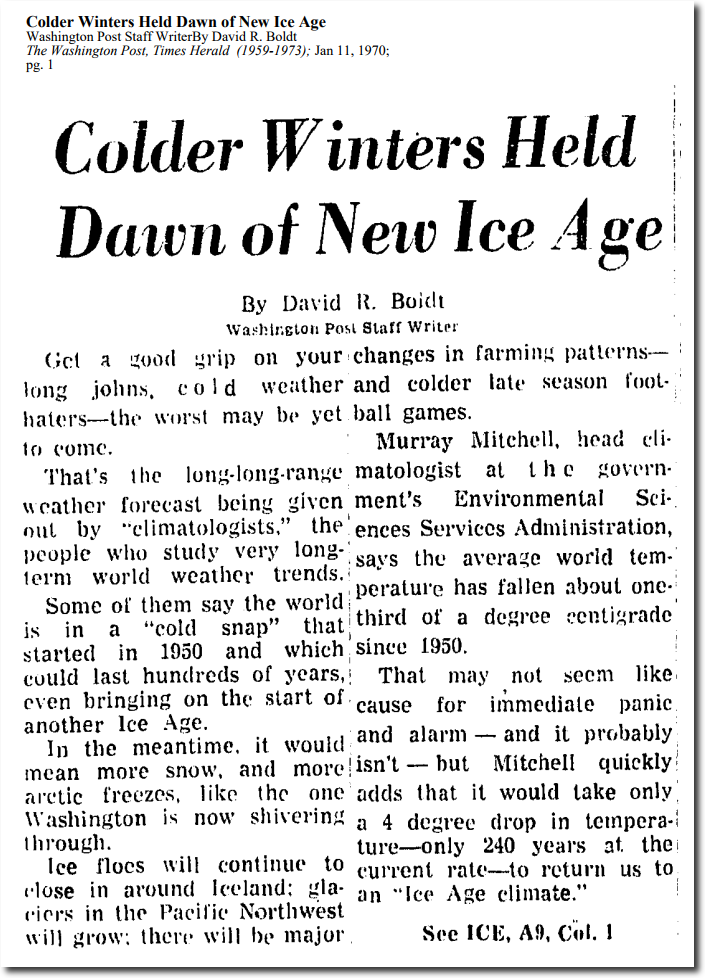
There are tens of thousands of newspaper articles and other publications from the time which discussed this – here are a few of the them.
washingtonpost.com – search nation, world, technology and Washington area news archives.
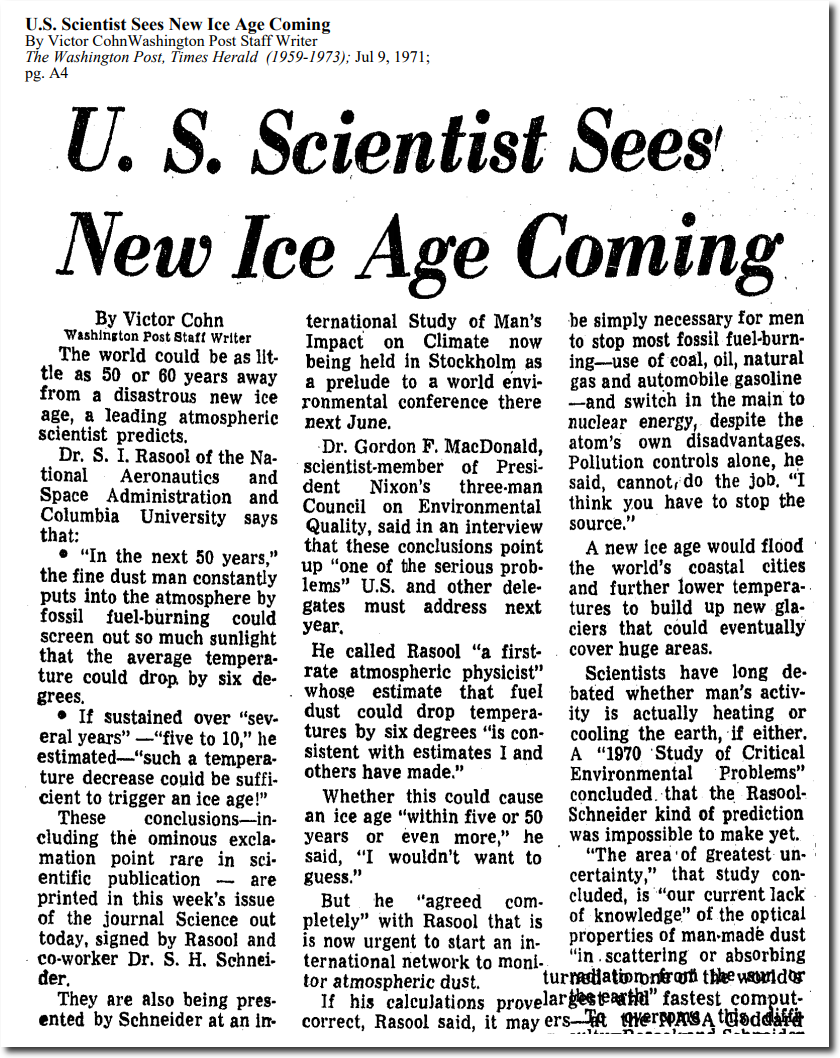
U.S. Scientist Sees New Ice Age Coming
Front Page of the New York Times, July 18, 1970. US and Soviet scientists were worried about Arctic cooling and expanding Arctic ice, and wanted to melt the Arctic by spreading coal dust on it.
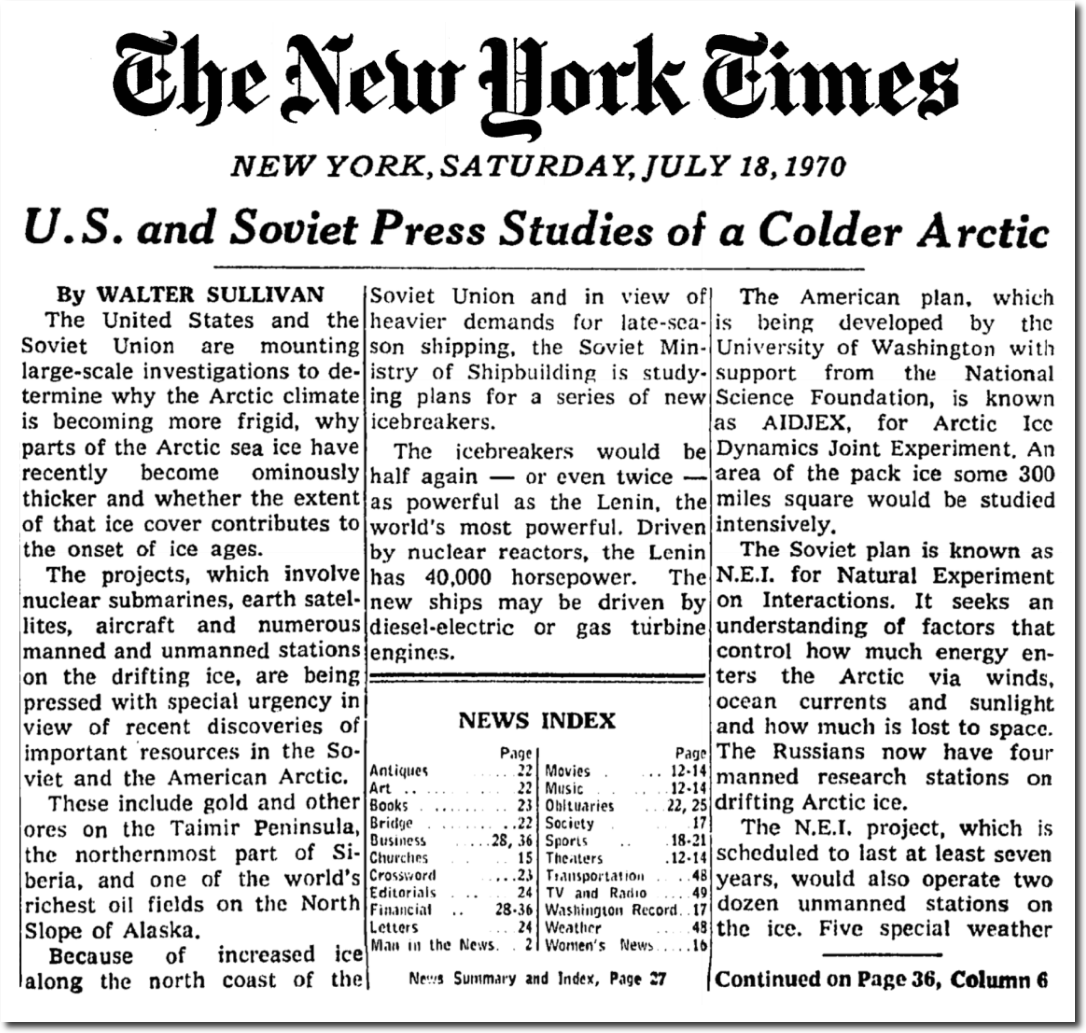
U.S. and Soviet Press Studies of a Colder Arctic – The New York Times
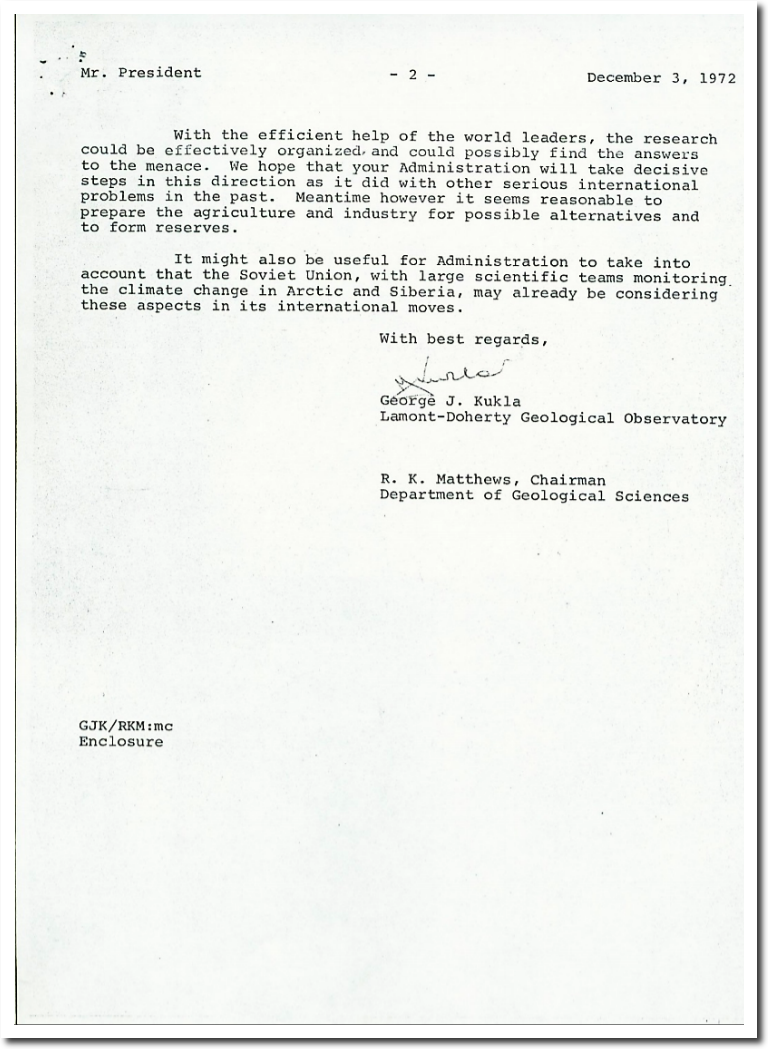
THE ROLE OF NOAA’S CLIMATE PREDICTION CENTER IN THE DEVELOPMENT OF CLIMATE SERVICES
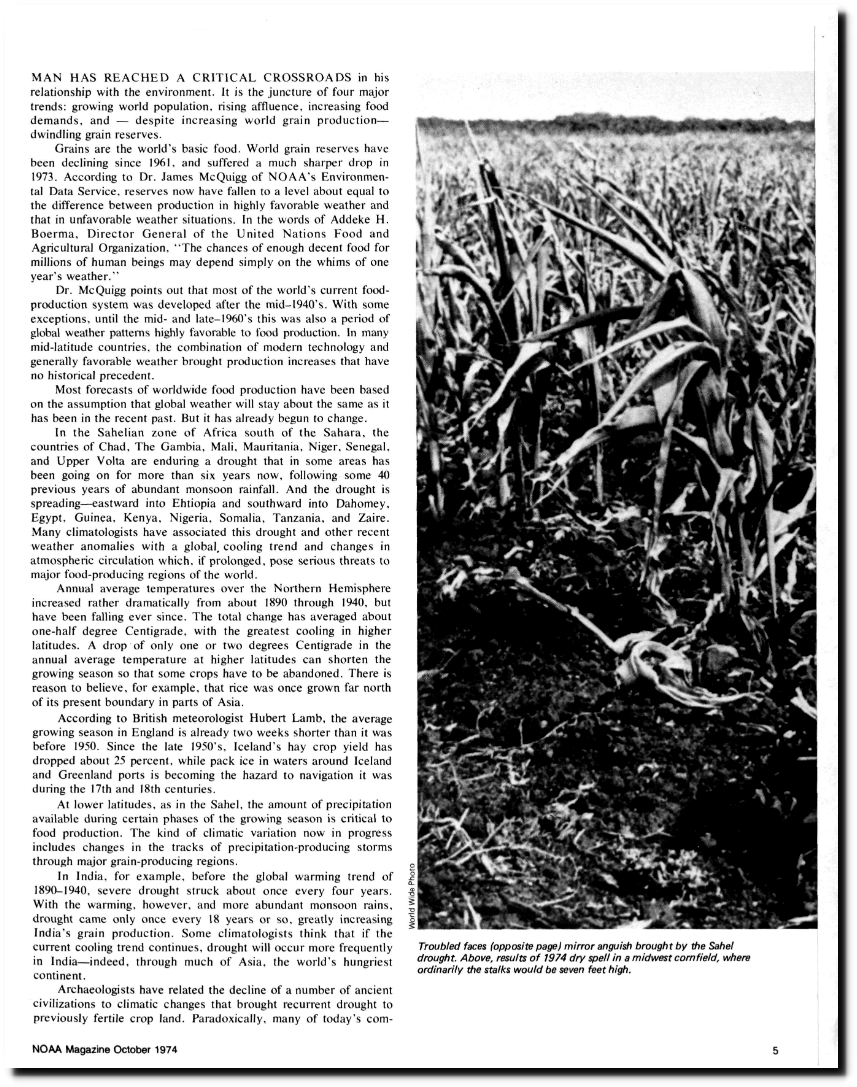
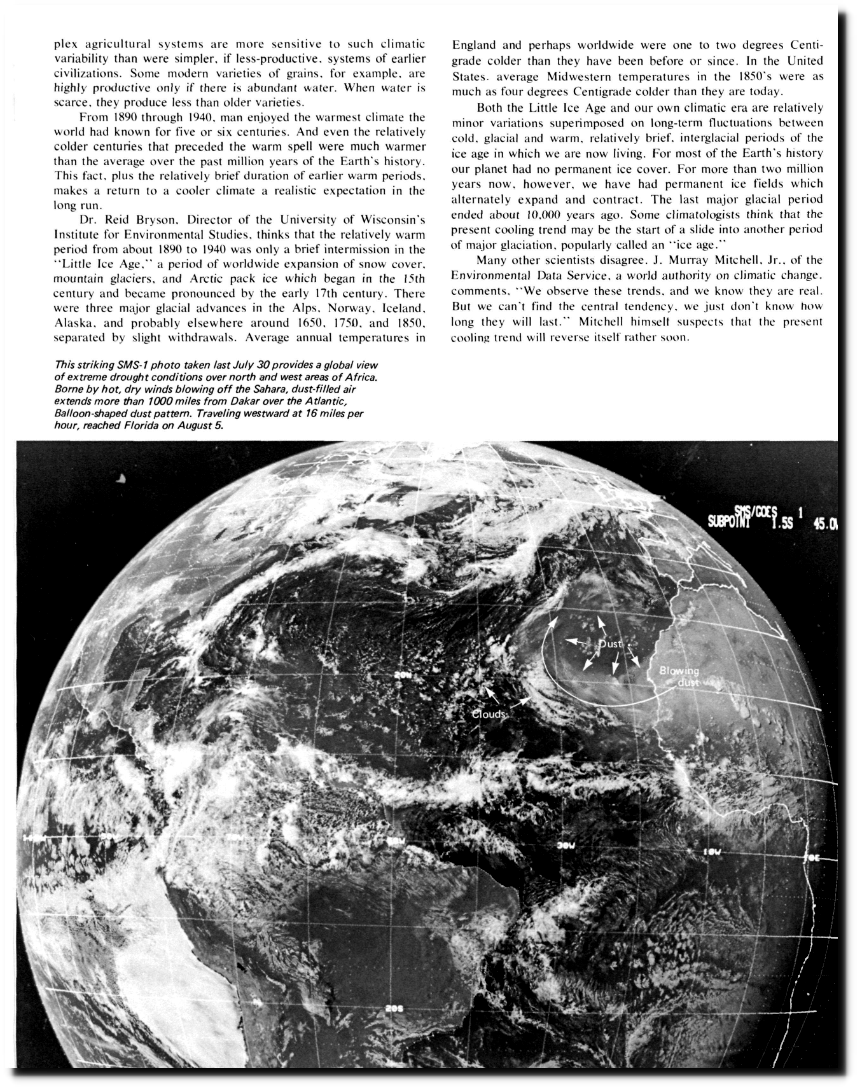
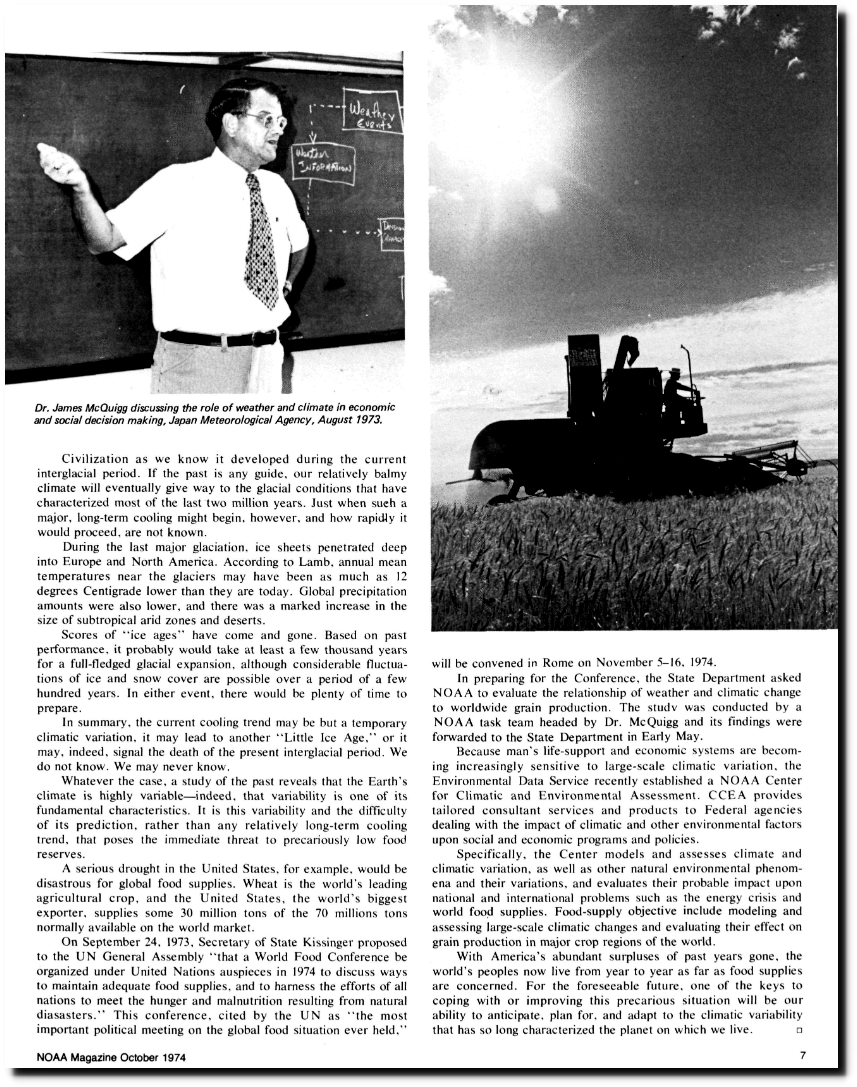
ftp://ftp.library.noaa.gov/docs.lib/htdocs/rescue/journals/noaa/QC851U461974oct.pdf
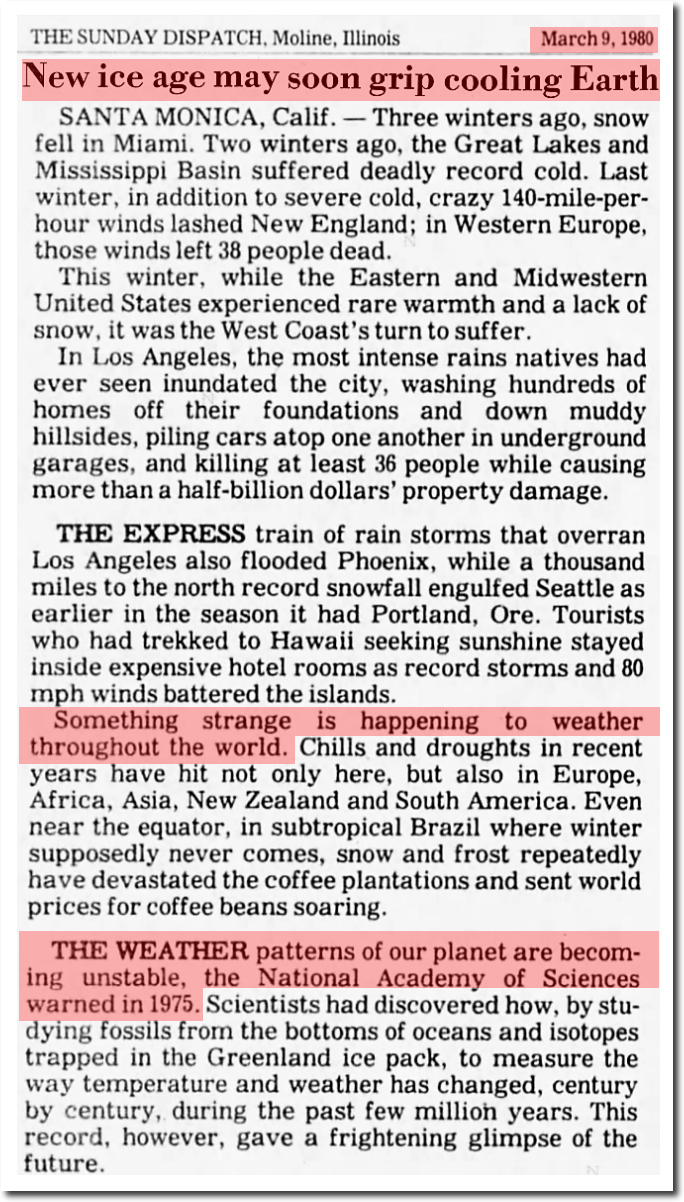
09 Mar 1980, 4 – The Dispatch at Newspapers.com
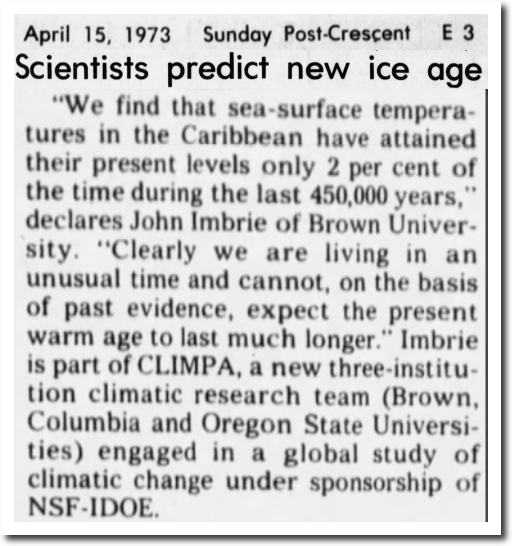
15 Apr 1973, 59 – The Post-Crescent at Newspapers.com
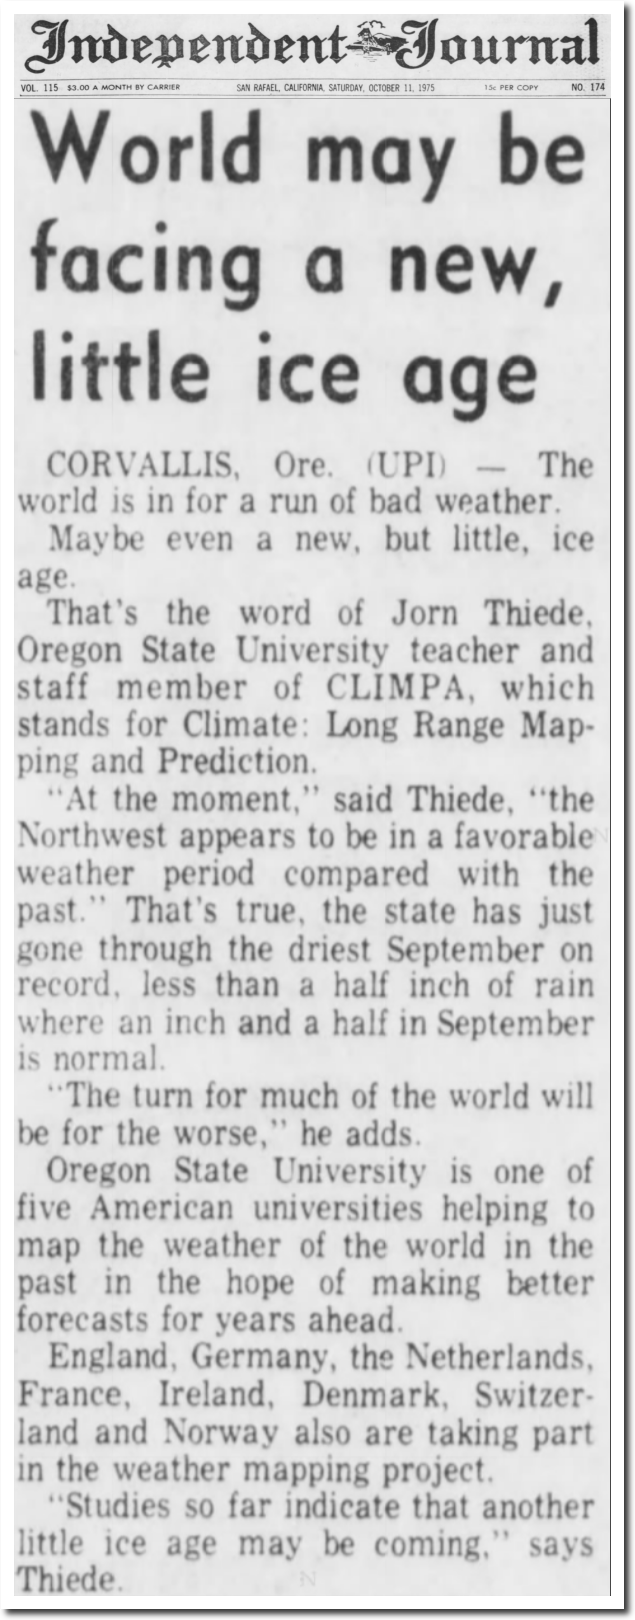
11 Oct 1975, Page 41 – Daily Independent Journal at Newspapers.com

14 Apr 1973, Page 8 – Iowa City Press-Citizen
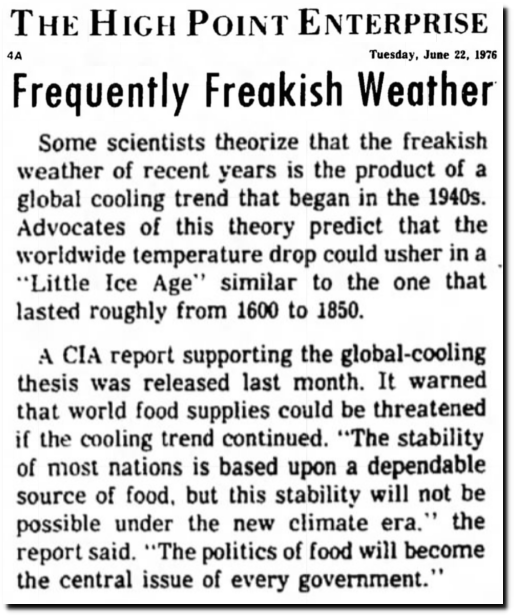
22 Jun 1976, Page 5 – The High Point Enterprise at Newspapers.com
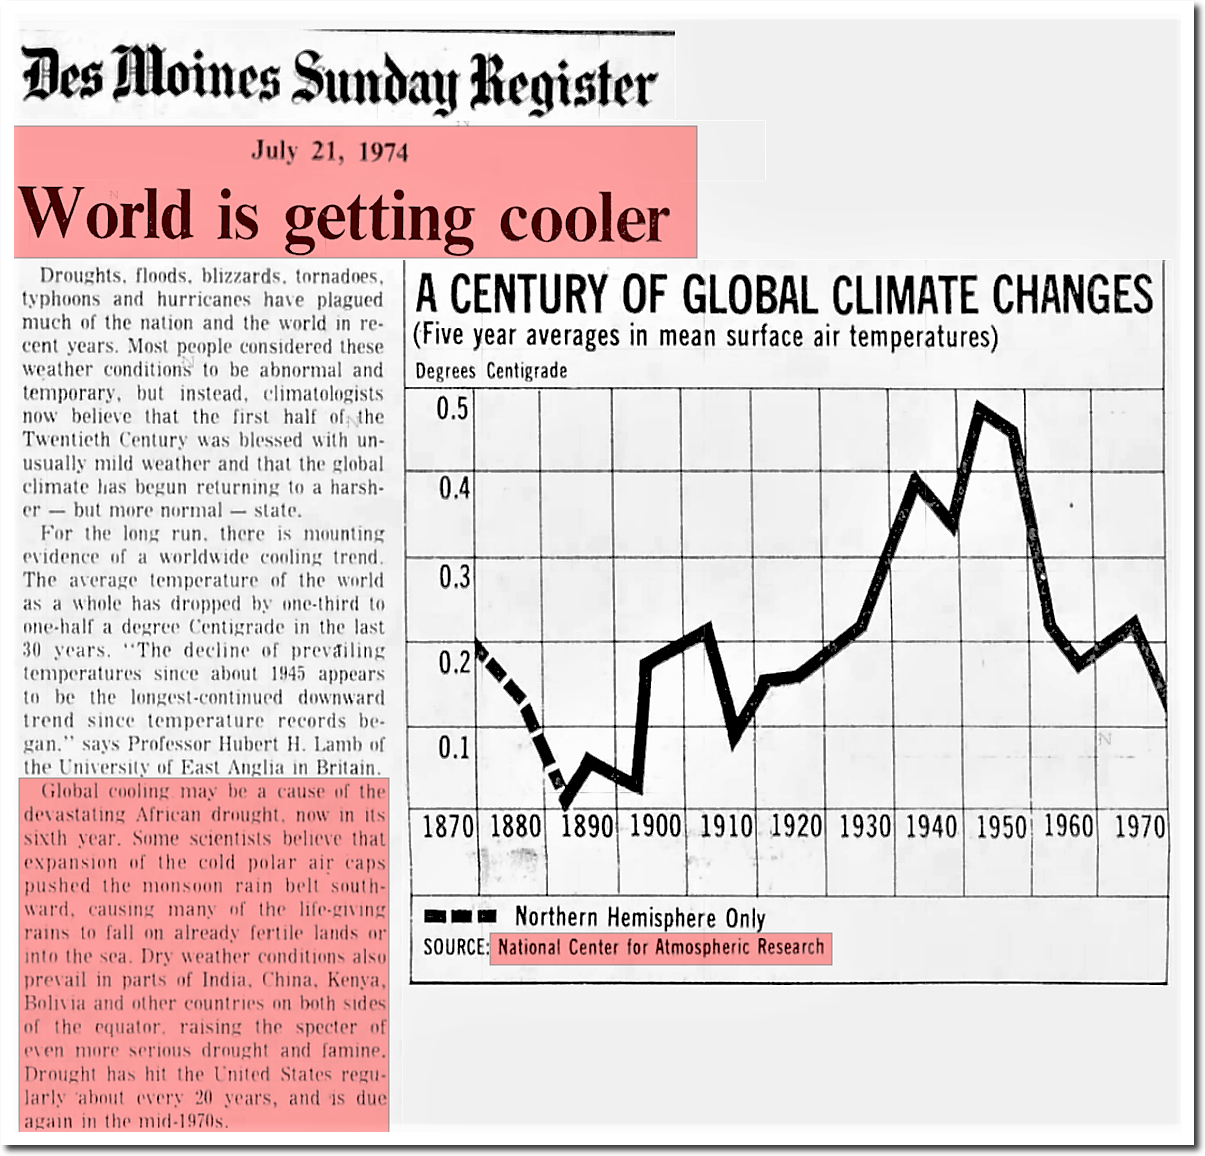
21 Jul 1974, 13 – The Des Moines Register at Newspapers.com
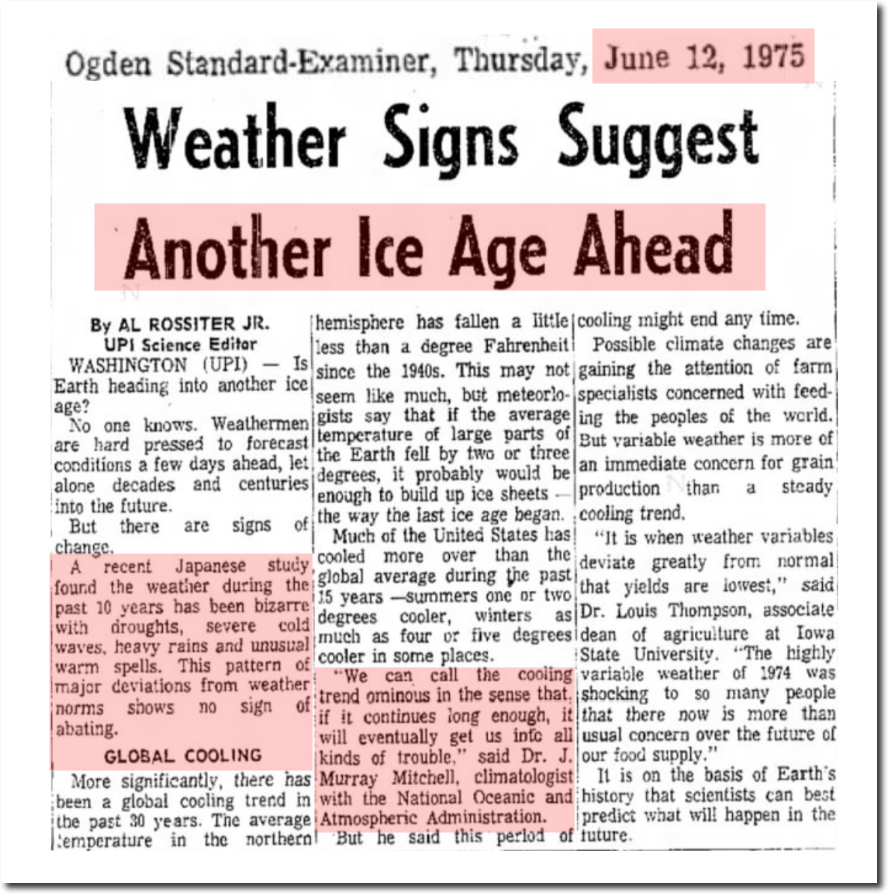
12 Jun 1975, Page 10 – The Ogden Standard-Examiner at Newspapers.com

https://www.sciencenews.org/sites/default/files/8983
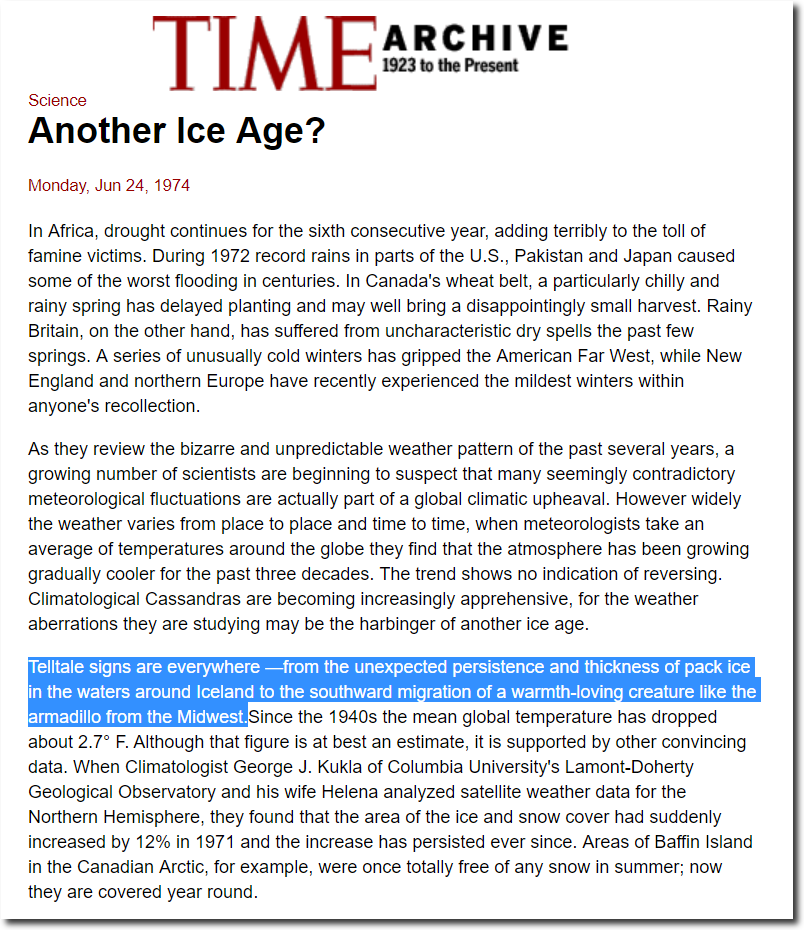
TIME Magazine Archive Article — Another Ice Age? — Jun. 24, 1974
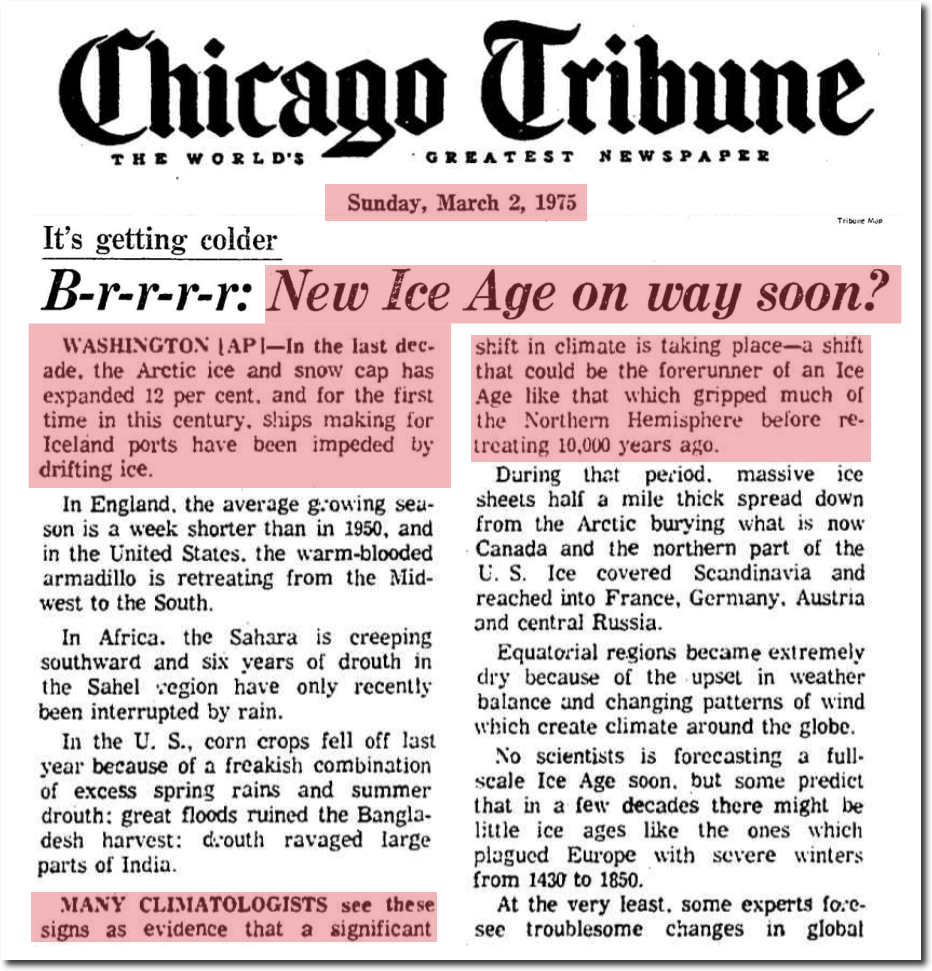
March 2, 1975 – B-r-r-r-r: New Ice Age on way soon? | Chicago Tribune Archive
U.S. and Soviet Press Studies of a Colder Arctic – The New York Times
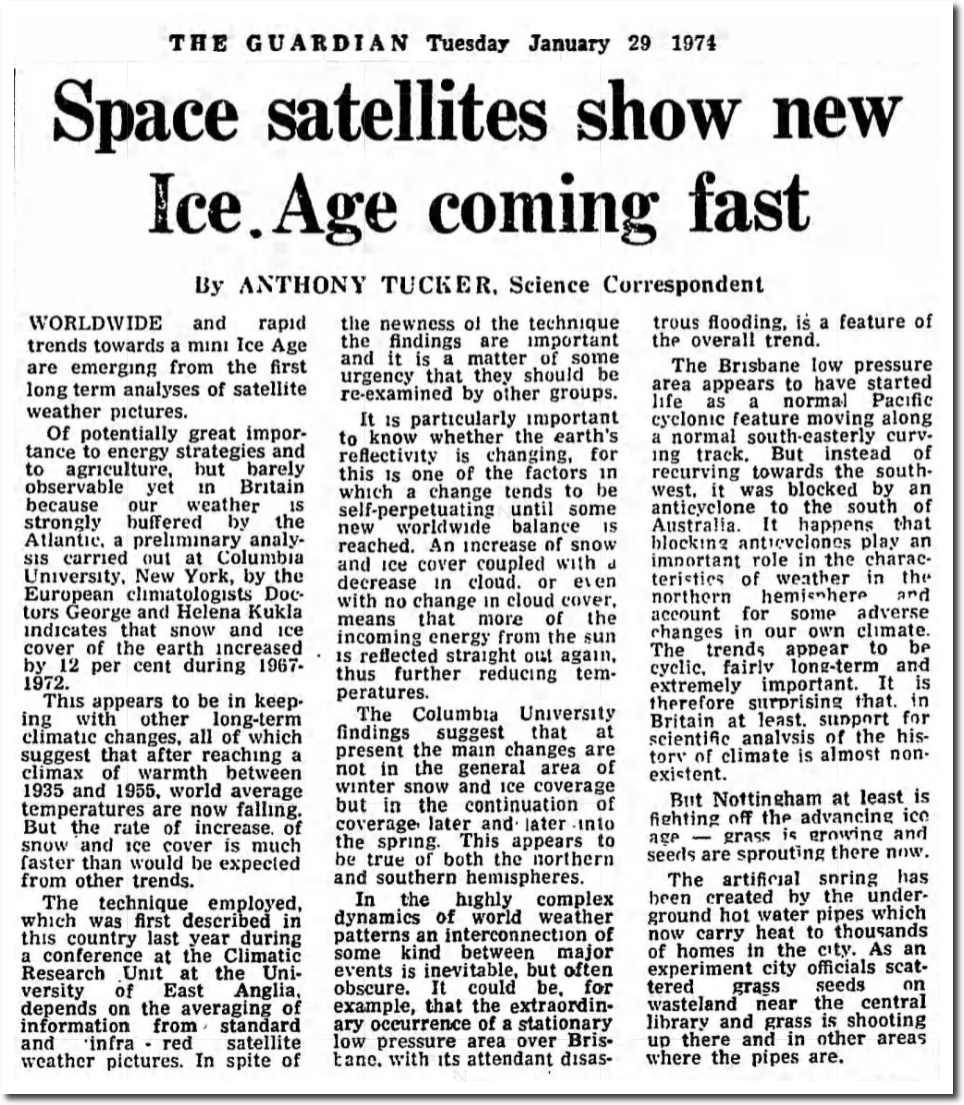
29 Jan 1974, 5 – The Guardian at Newspapers.com
The Director at the National Center for Atmospheric Research and his leading scientist were pushing global cooling.
12 Jun 1974, Page 20 – at Newspapers.com
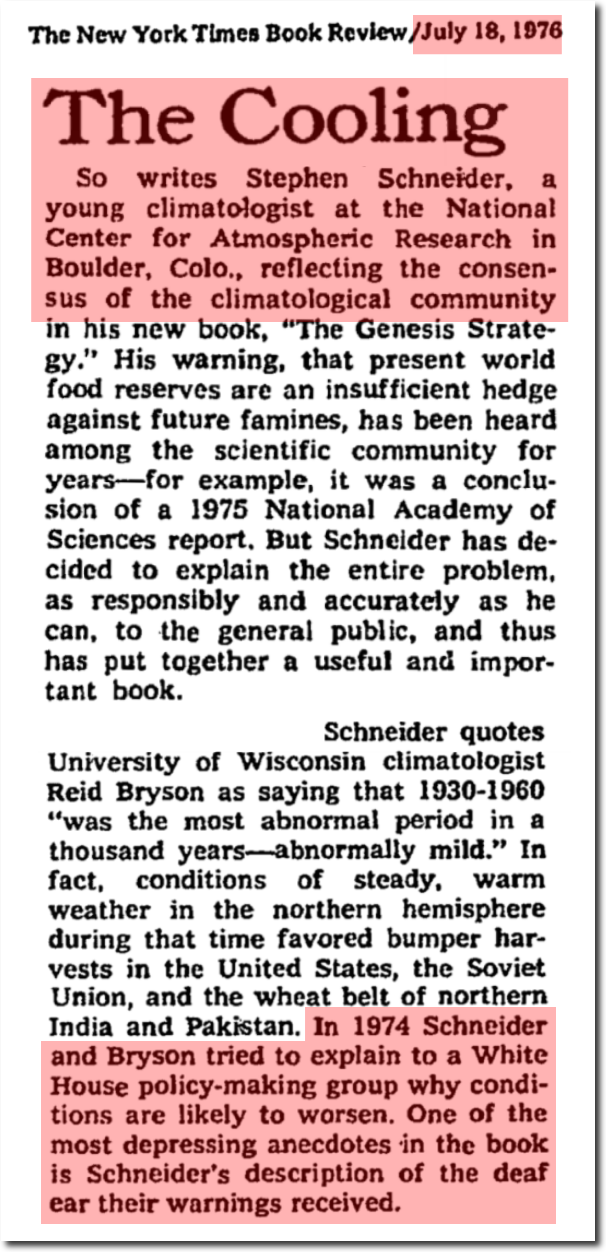
The Genesis Strategy – The New York Times
The National Geographic Archive | November 1976 | page 1
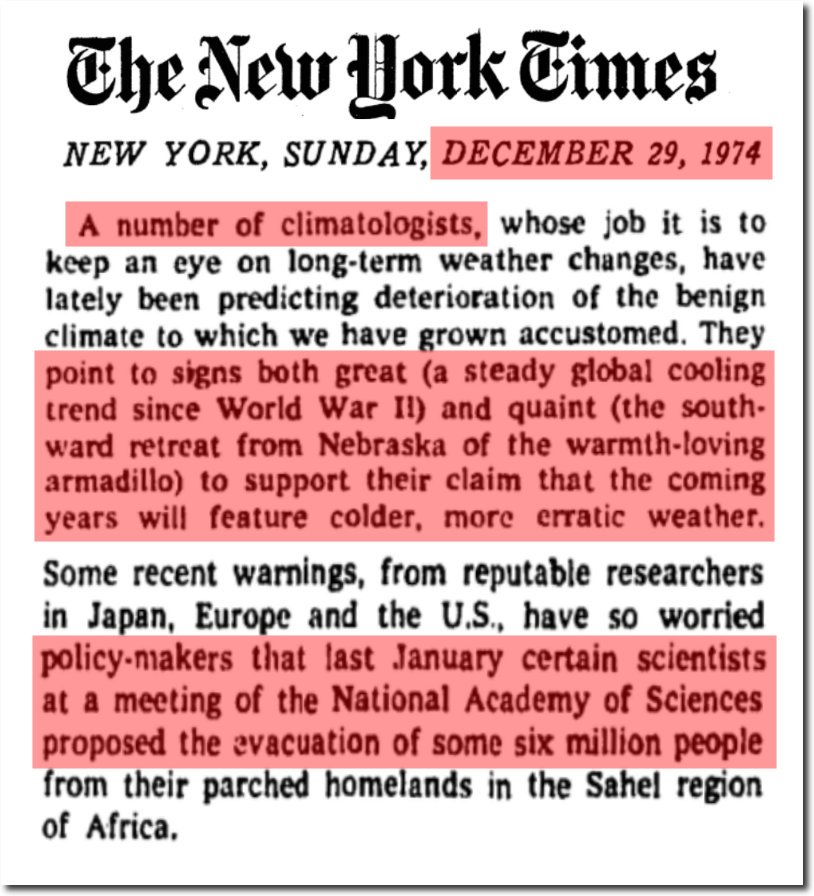
TimesMachine: December 29, 1974 – NYTimes.com
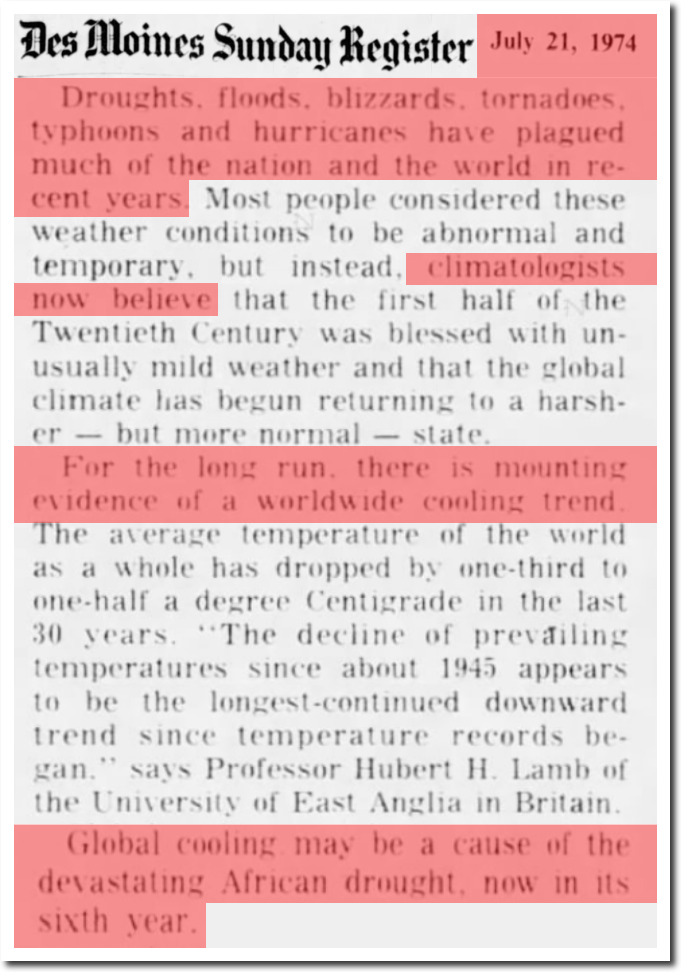
21 Jul 1974, 13 – The Des Moines Register at Newspapers.com
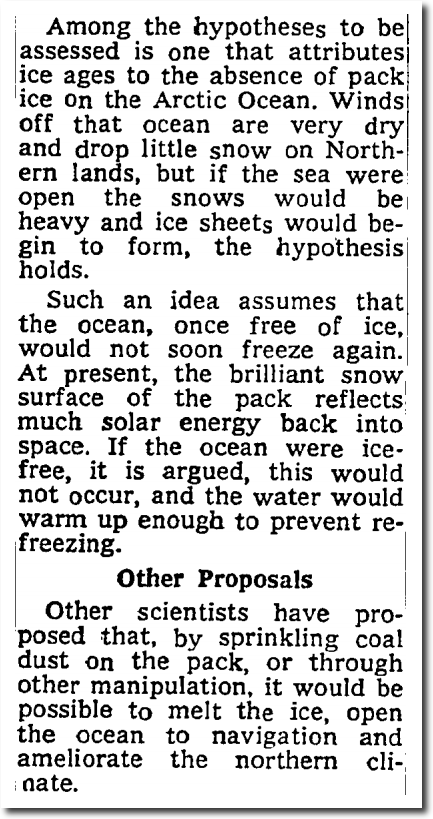
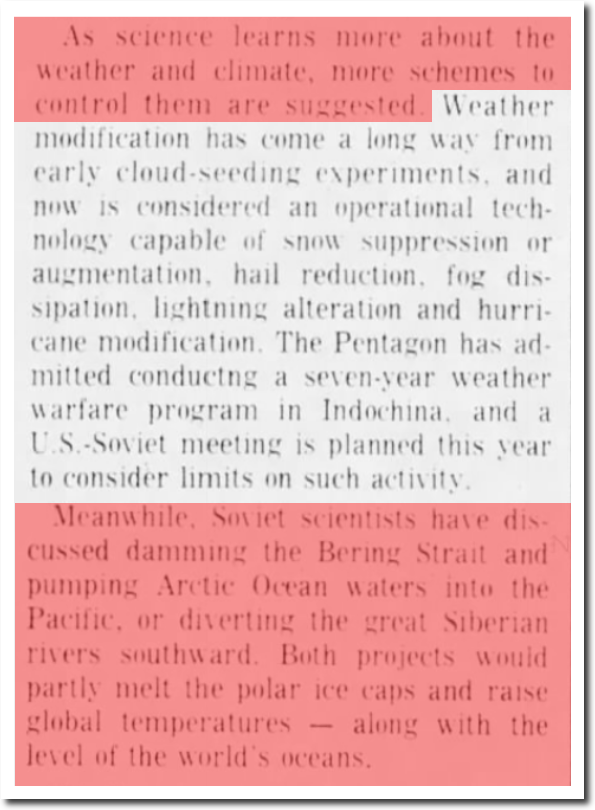
Climate experts wanted to melt the Arctic to stop global cooling.
?www.denisdutton.com/newsweek_coolingworld.pdf

10 May 1979, 7 – Calgary Herald at Newspapers.com
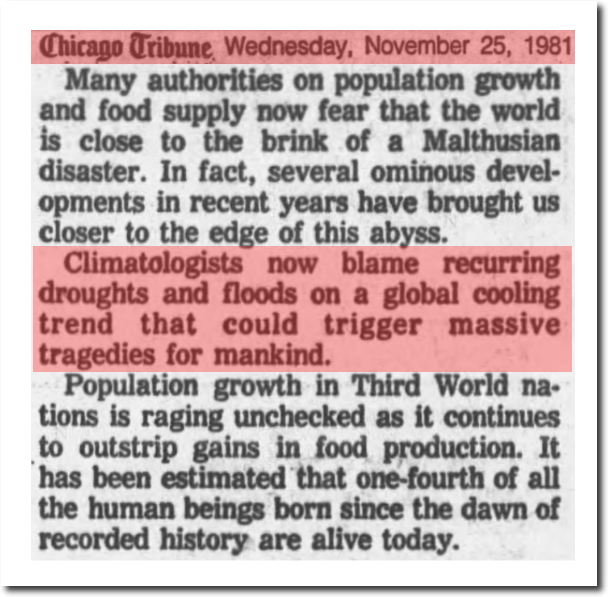
25 Nov 1981, 13 – Chicago Tribune at Newspapers.com
In this 2015 article they claim the Little Ice Age was started in 1492 by Christopher Columbus killing native Americans and enslaving Africans. Impressive how many politically correct themes they packed into a single piece of politically motivated junk science.

Mass Deaths in Americas Start New CO2 Epoch – Scientific American
According to the 1990 IPCC report, the Little Ice Age cooling began around the year 1200.
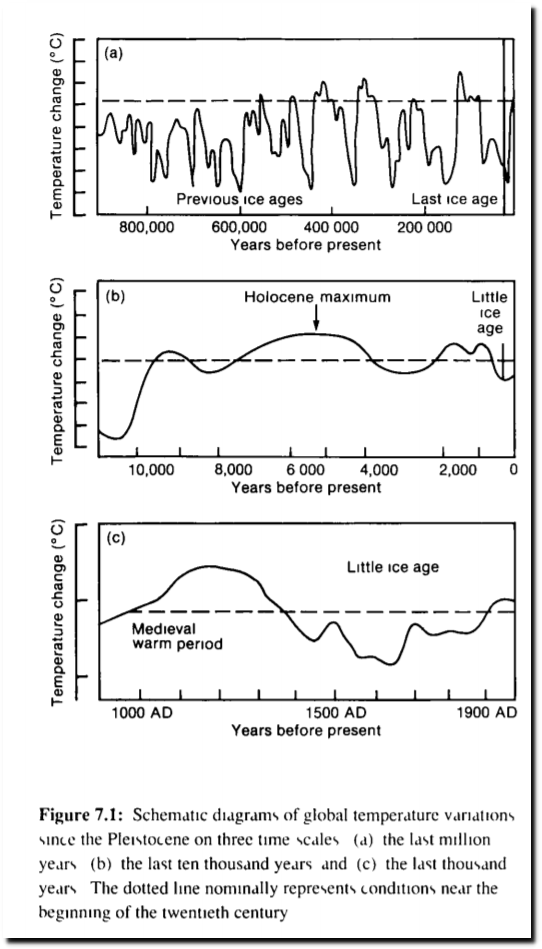
And according to the New York Times, the Little Ice Age began around the year 1450.
Scientific American claims that a 1C drop in temperature was caused by a 7 ppm decline in CO2. That would imply a climate sensitivity of 0.14C/ppm. During the Cambrian explosion of life 540 million years ago, CO2 levels were 7,000 ppm, which means earth’s temperature would have been about 1,000C.
Moving to a different topic, on September 15, 2020 Scientific American published this article praising the “science based” approach of New Mexico Governor Wuhan Lujan – i.e. lockdowns, masks, deprivation of freedom, work and income, etc.
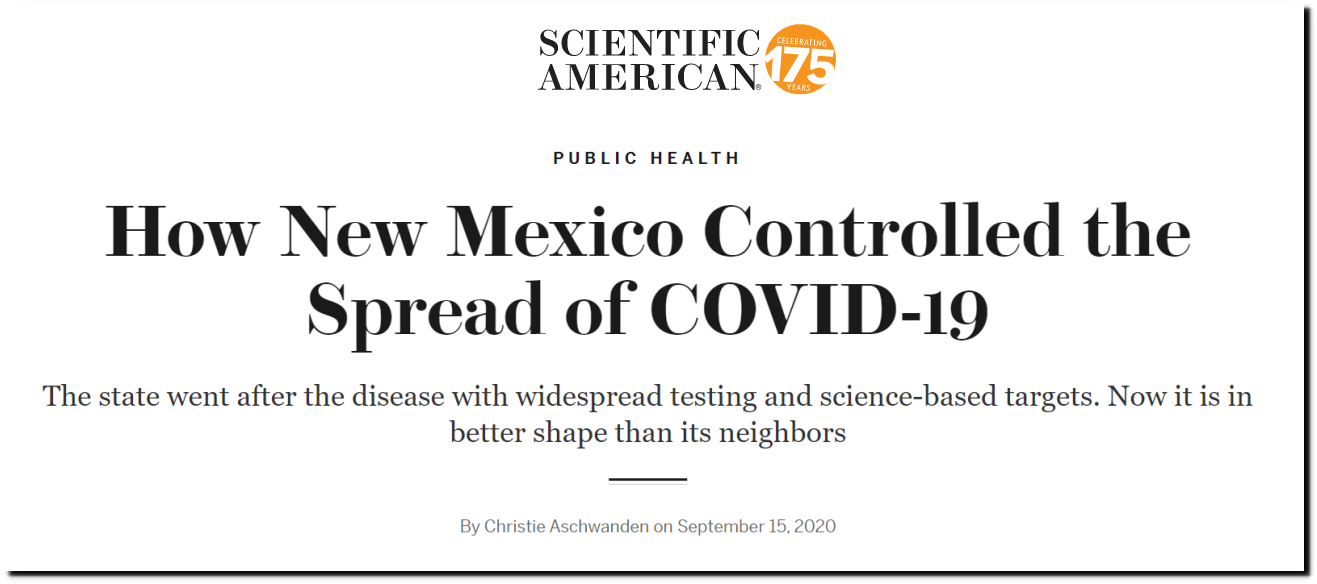
How New Mexico Controlled the Spread of COVID-19 – Scientific American
Cases immediately skyrocketed after article was written.
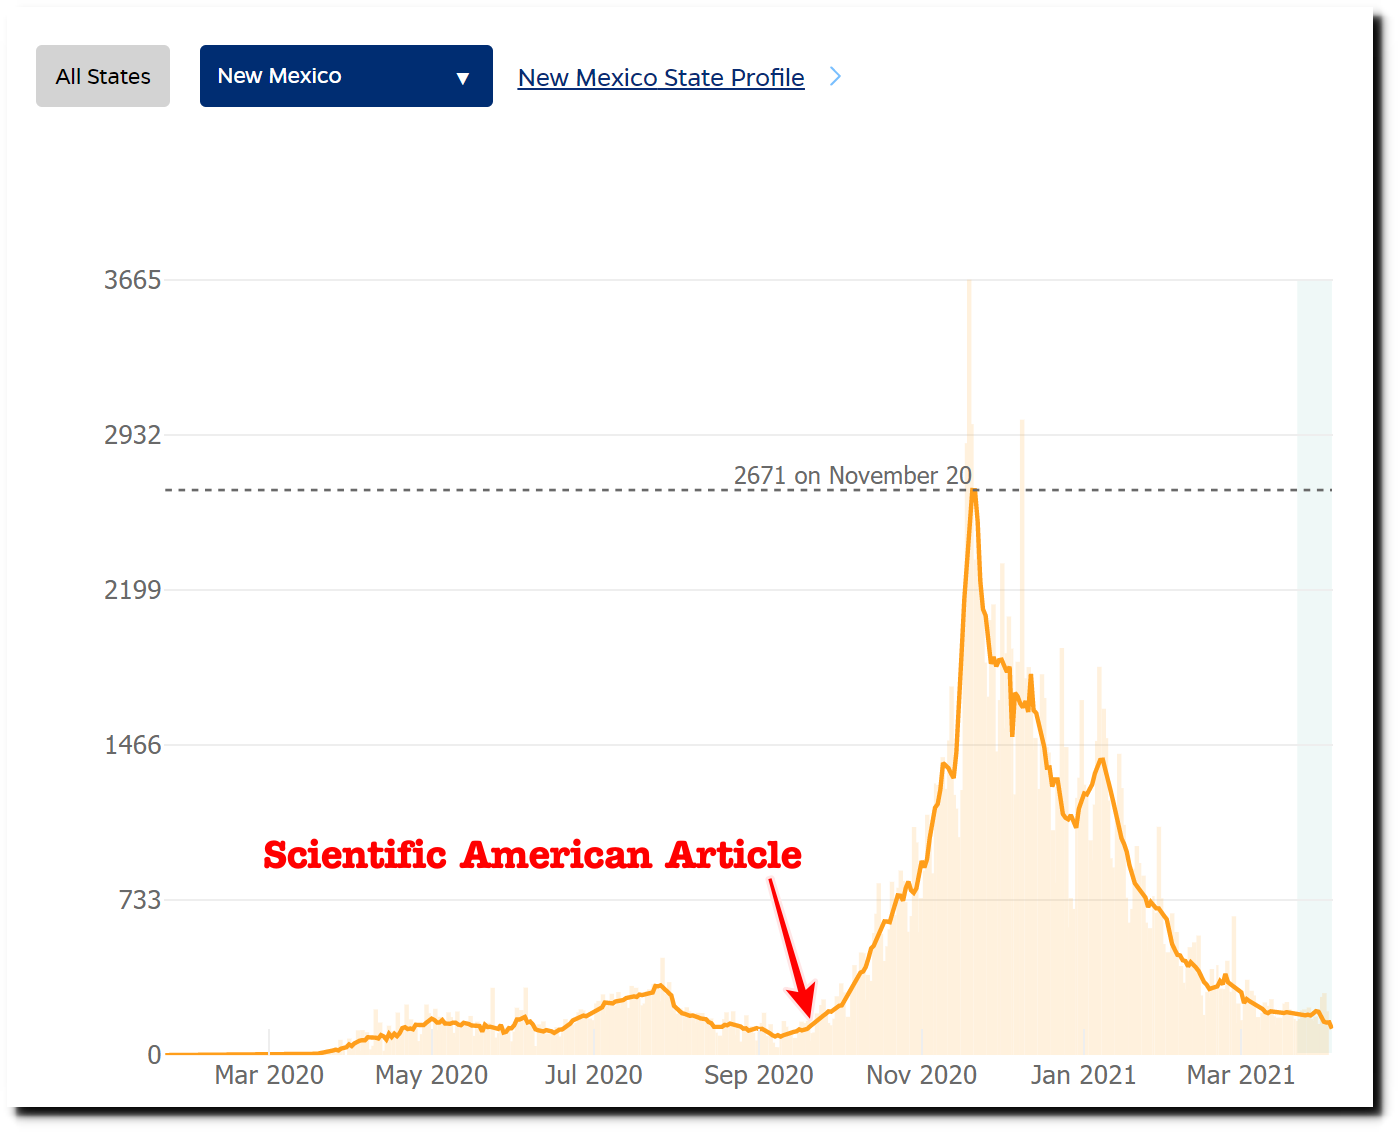
Have we flattened the curve in New Mexico? – Johns Hopkins
The reality is that Scientific American is no longer a scientific magazine, and has been taken over by propagandists pushing a political agenda intended to destroy America.

Scientific American Endorses Joe Biden – Scientific American
Posted in Uncategorized
Leave a comment