Disrupting the Borg is expensive and time consuming!
Google Search
-
Recent Posts
- New Video : Analyzing Oil And Gas
- Is Antarctica Melting?
- High Speed Analysis And Visualization
- El Nino To The Rescue?
- Fake News Update
- Growth Of Antarctic Sea Ice
- 65 Years Of Progress!
- El Nino To The Rescue?
- Worst March Drought On Record
- ChartGL Process Control Demo
- The Biggest Money Laundering Scam
- Drought In The Headwaters Of Lake Powell
- Unrealistic Expectations Of Water Availability
- Did Bill Gates Do This?
- Worst March Drought On Record In The US
- The Real Hockey Stick Graph
- Analyzing The Western Water Crisis
- Gaslighting 1924
- “Why Do You Resist?”
- Climate Attribution Model
- Fact Checking NASA
- Fact Checking Grok
- Fact Checking The New York Times
- New Visitech Features
- Ice-Free Arctic By 2014
Recent Comments
- conrad ziefle on New Video : Analyzing Oil And Gas
- Bob G on Is Antarctica Melting?
- arn on Is Antarctica Melting?
- Bob G on Is Antarctica Melting?
- Bob G on New Video : Analyzing Oil And Gas
- John McLachlan on Is Antarctica Melting?
- Bob G on Is Antarctica Melting?
- arn on 65 Years Of Progress!
- Allan Shelton on Is Antarctica Melting?
Australia Always In Drought Or Flood
Australia is almost always experiencing drought or flood. Many years they experienced both.
Posted in Uncategorized
Leave a comment
Droughts And Floods In Australia
“Although New South Wales is not subject to the periodical showers of the tropics, a large quantity of rain falls throughout the year; hitherto the colony has been visited by a drought about every twelve years; the last one continuing from 1826 to 1829, during which period, little or no rain fell”
p6 – 26 Oct 1837 – The Colonist (Sydney, NSW : 1835 – 1840) – Trove
08 May 1869 – AUSTRALIAN METEOROLOGY. – Trove
“1850 was all but rainless. Victoria and Tasmania were dried up, and on Black Thursday, 6th February,. 1851, the Barrabool Hills and great part of Victoria were swept by a fierce northern hurricane that “boxed” the scattered bush fires into one awful whole.”
Posted in Uncategorized
Leave a comment
World Wide Drought Of 1826
04 Jul 1826, 2 – The Morning Chronicle at Newspapers.com
07 Sep 1827, 3 – The Village Messenger at Newspapers.com
10 Aug 1827, 4 – New England Farmer at Newspapers.com
“Although New South Wales is not subject to the periodical showers of the tropics, a large quantity of rain falls throughout the year; hitherto the colony has been visited by a drought about every twelve years; the last one continuing from 1826 to 1829, during which period, little or no rain fell”
p6 – 26 Oct 1837 – The Colonist (Sydney, NSW : 1835 – 1840) – Trove
“From 1826 to 1829 wail the very worst and the longest of all Australian droughts.”
Posted in Uncategorized
Leave a comment
Rewriting The Climate At NASA
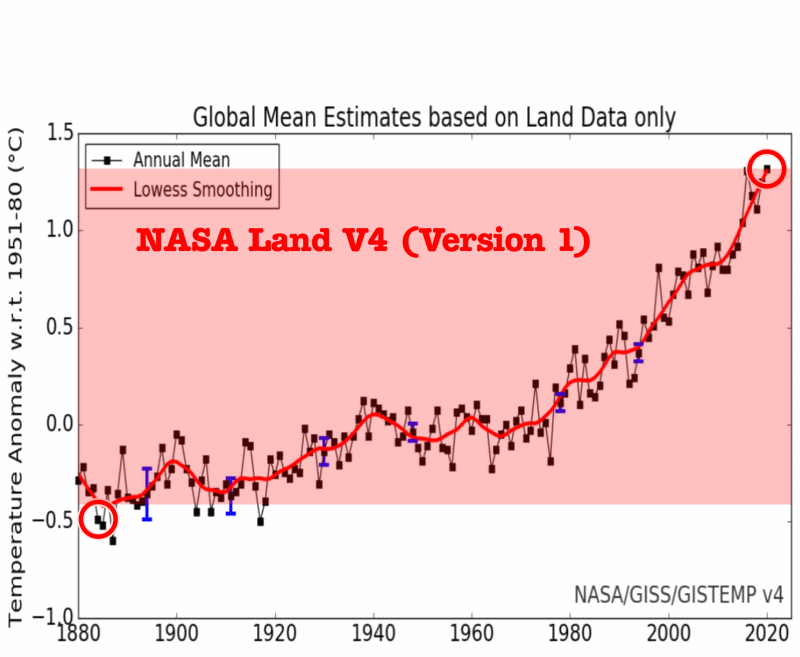
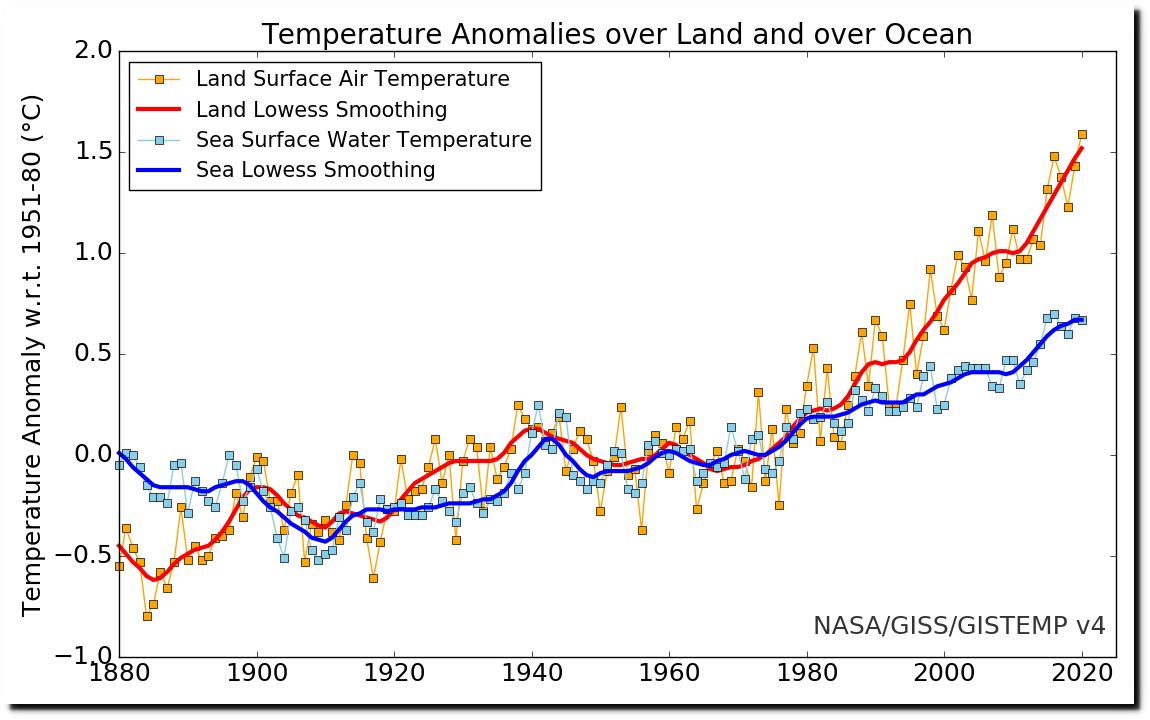
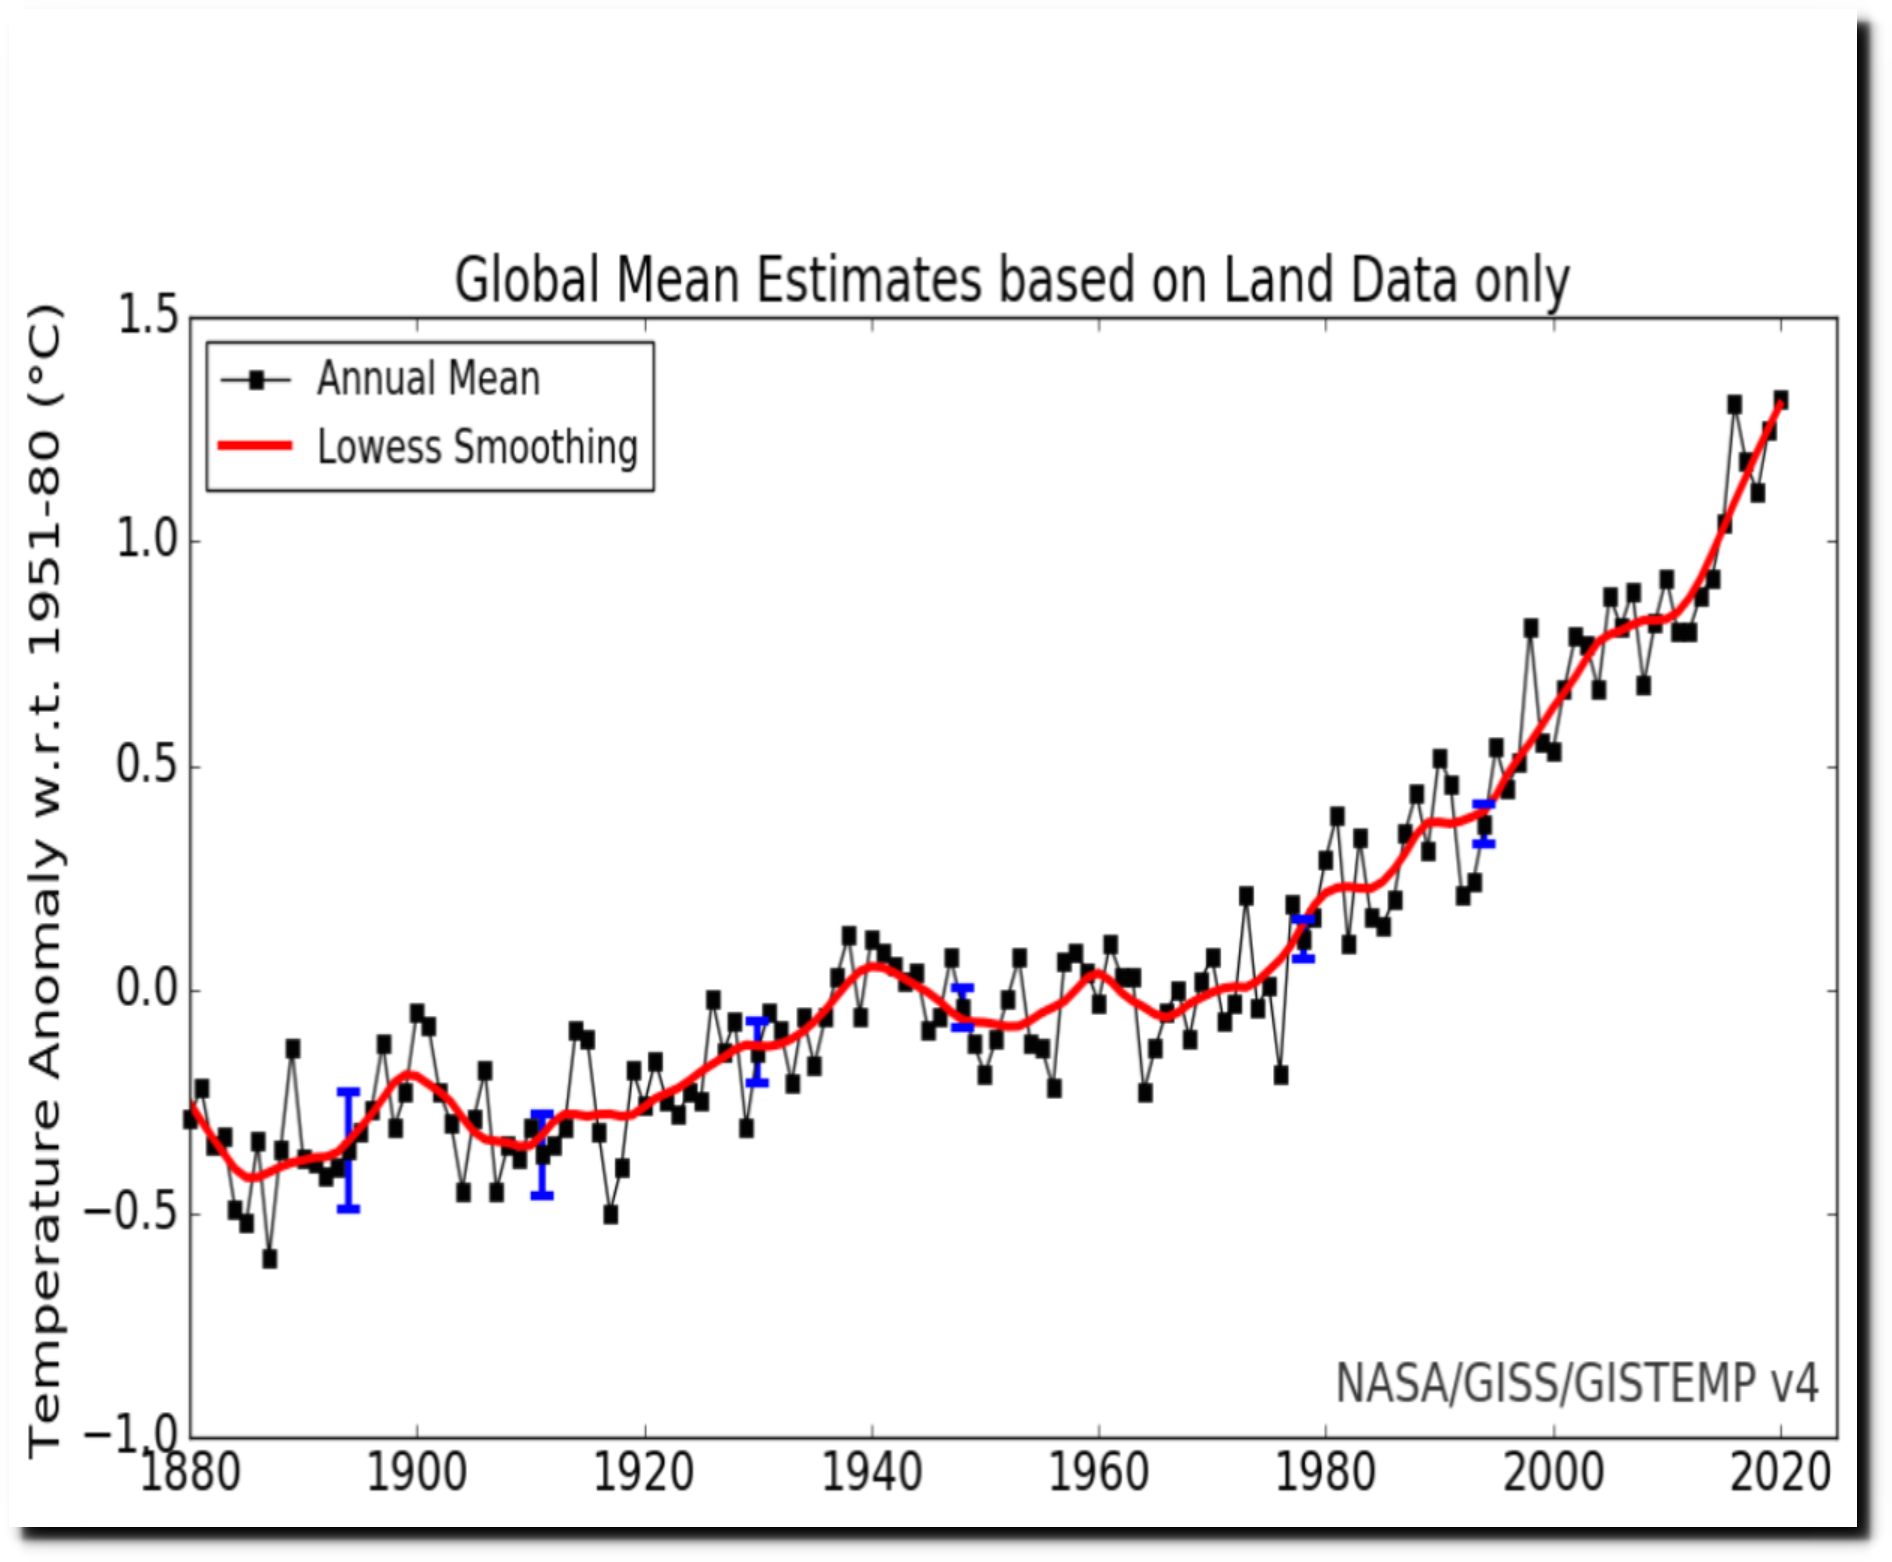
NASA GISS v4 shows more than 2C warming over land since 1880.
A different version of the same V4 graph also shows about 1.6C warming over land since 1880. This graph used to be linked to from their website, but I can no longer find any links. However the graph is still present on their website.
The red lines in both of the graphs above should be identical, but they aren’t. Here is an animation showing how they are altering the land data in the new graph vs. the old graph. They have increased recent temperatures by about 0.3C and cooled past temperatures by about the same amount.
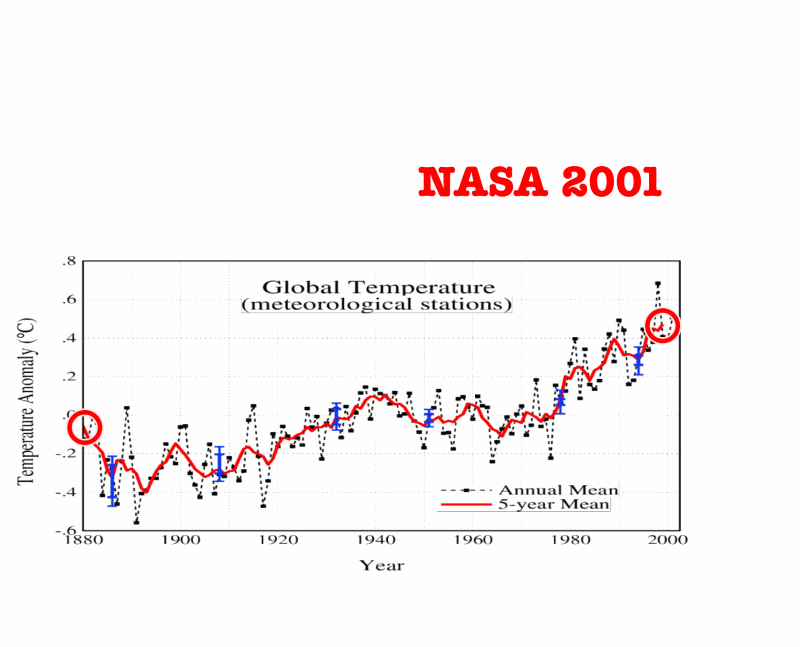
2001: Fig.A.ps
The person in charge at NASA (Gavin Schmidt) has me blocked on Twitter, but Tom Nelson questioned him about this change. This is how he responded.
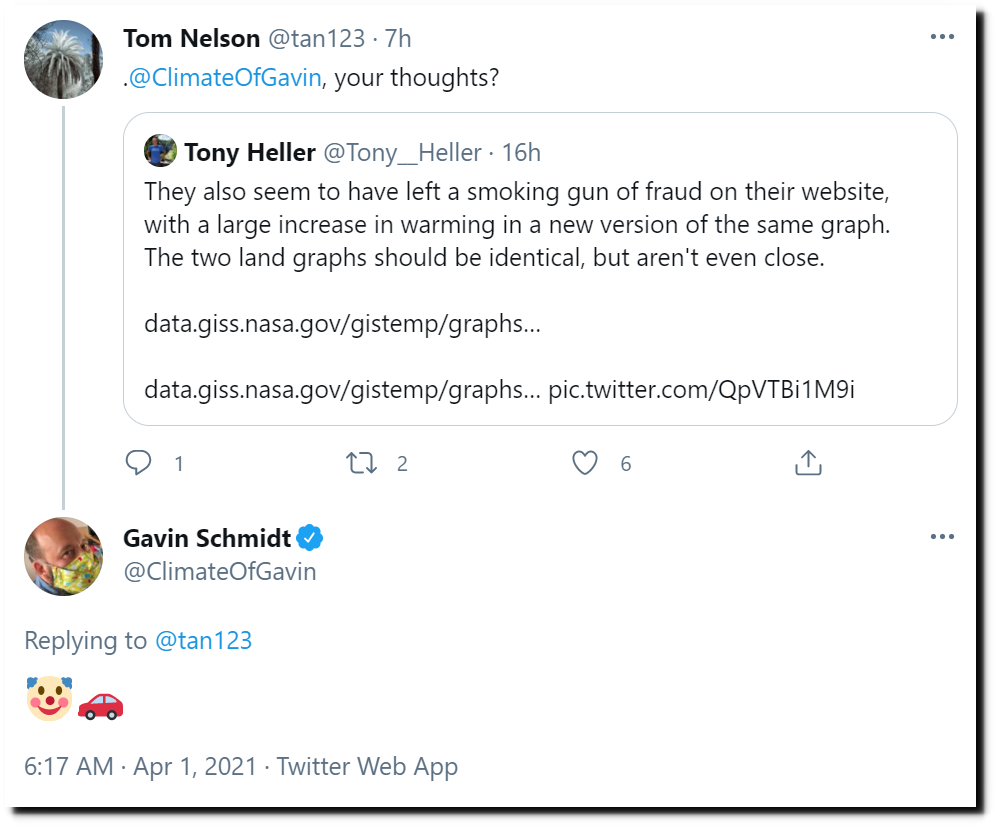
He does tweet in a colorful mask however.
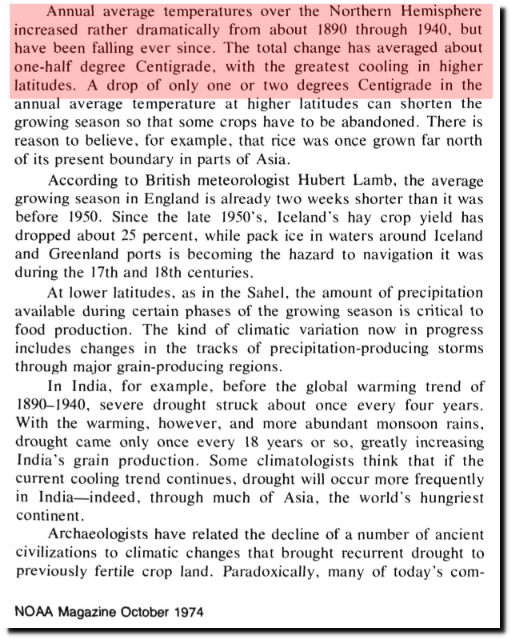
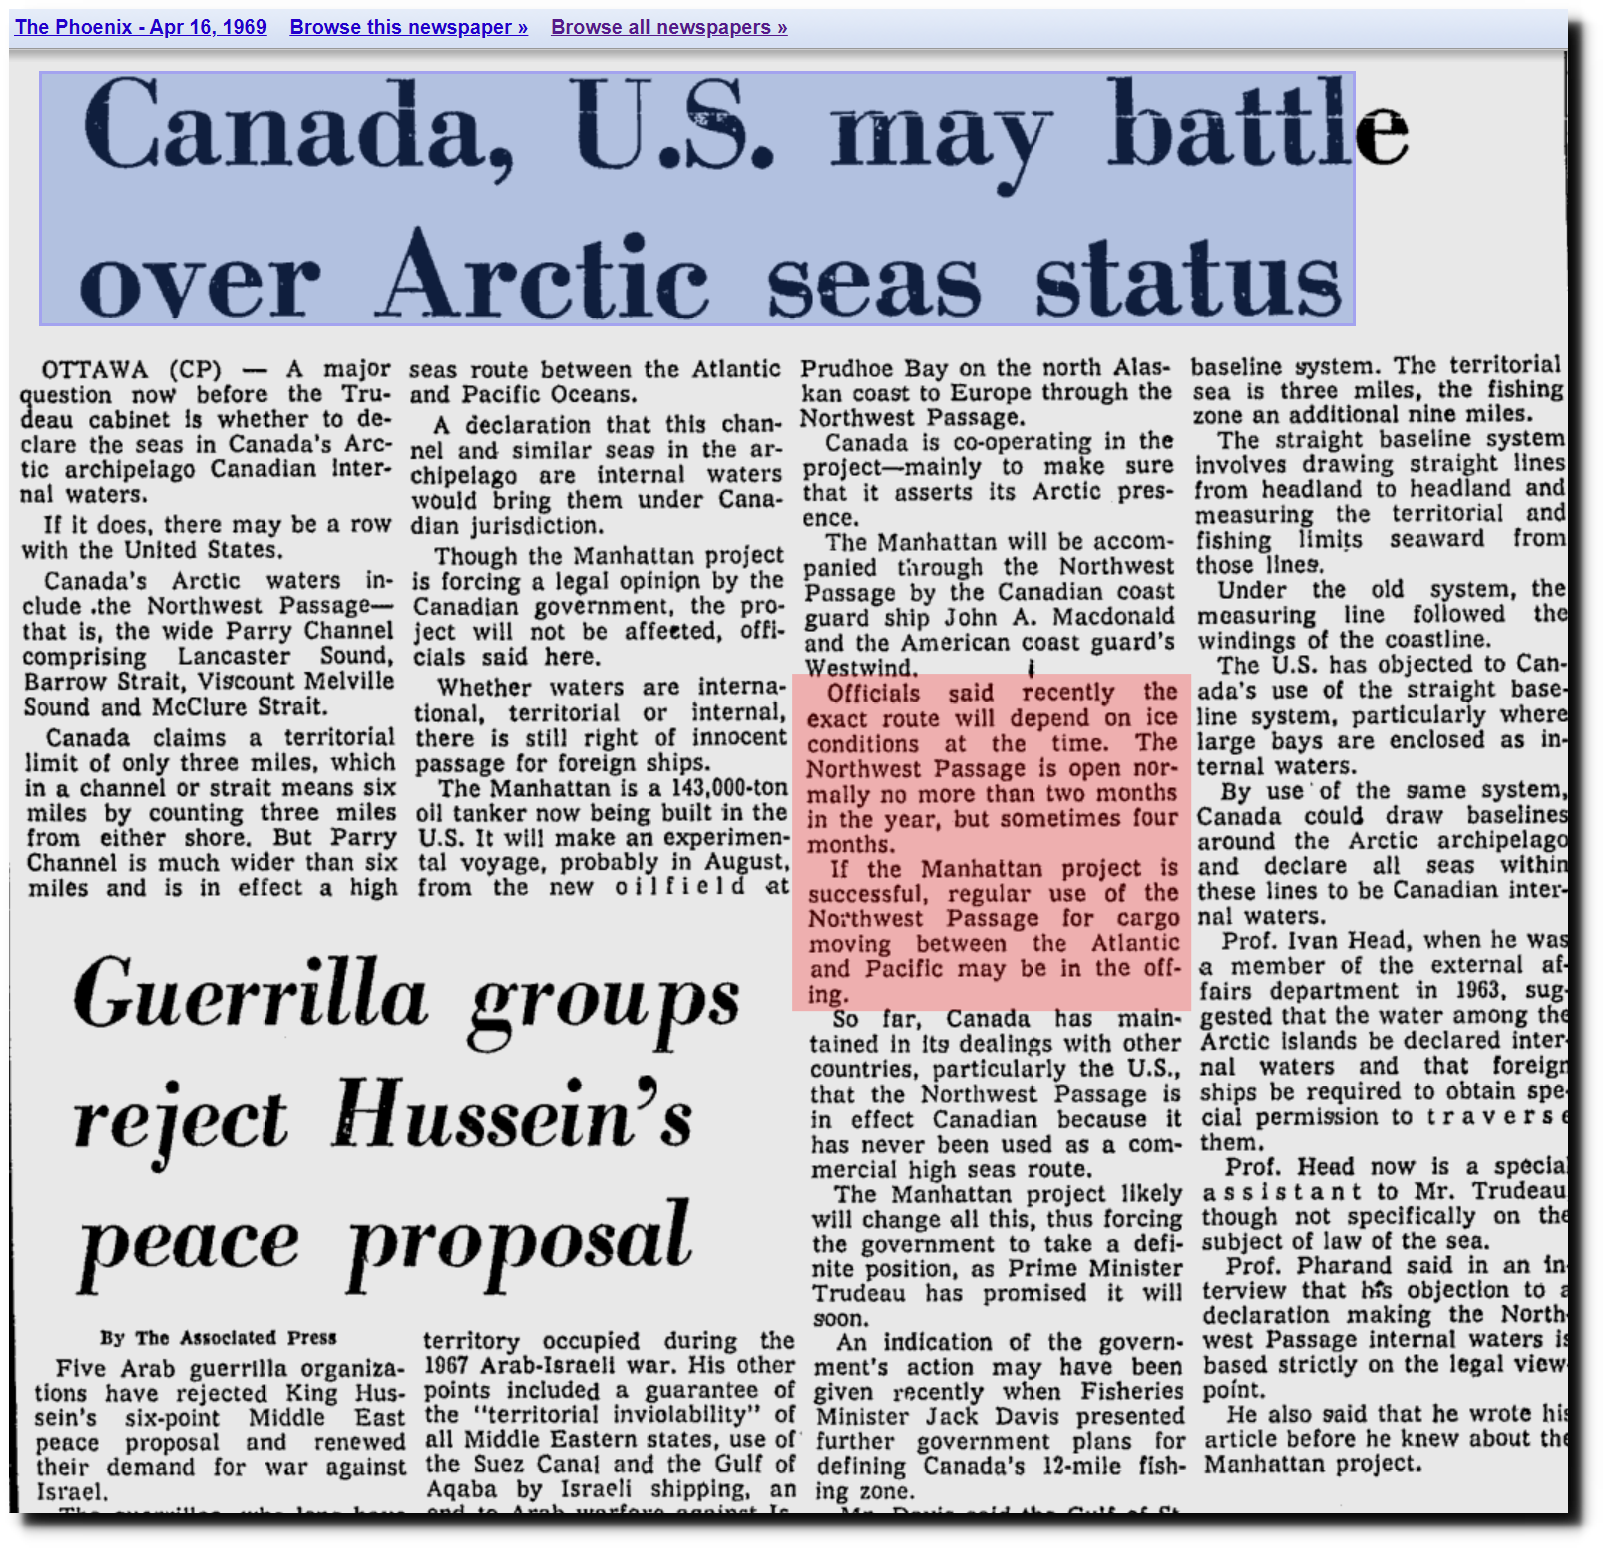
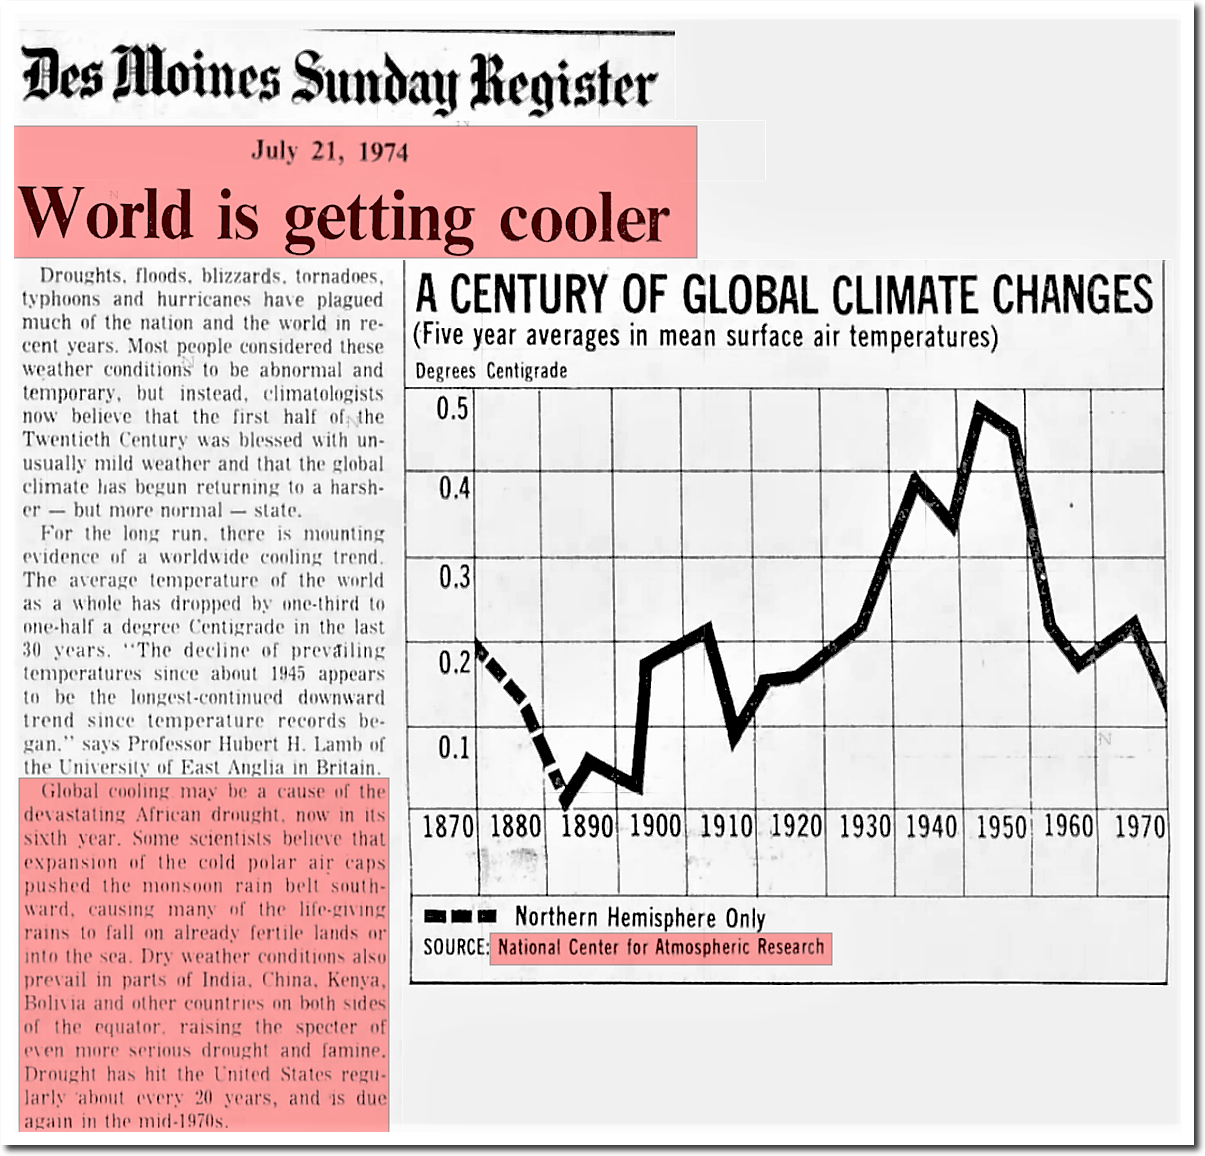
But the data tampering story gets much worse. In 1974, the National Center for Atmospheric Research showed no net warming from 1870 to 1970, with the warmest decade being the 1940s, followed by a sharp cooling.
21 Jul 1974, 13 – The Des Moines Register at Newspapers.com
This cooling was confirmed in NOAA Magazine October, 1974
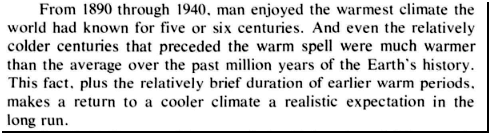
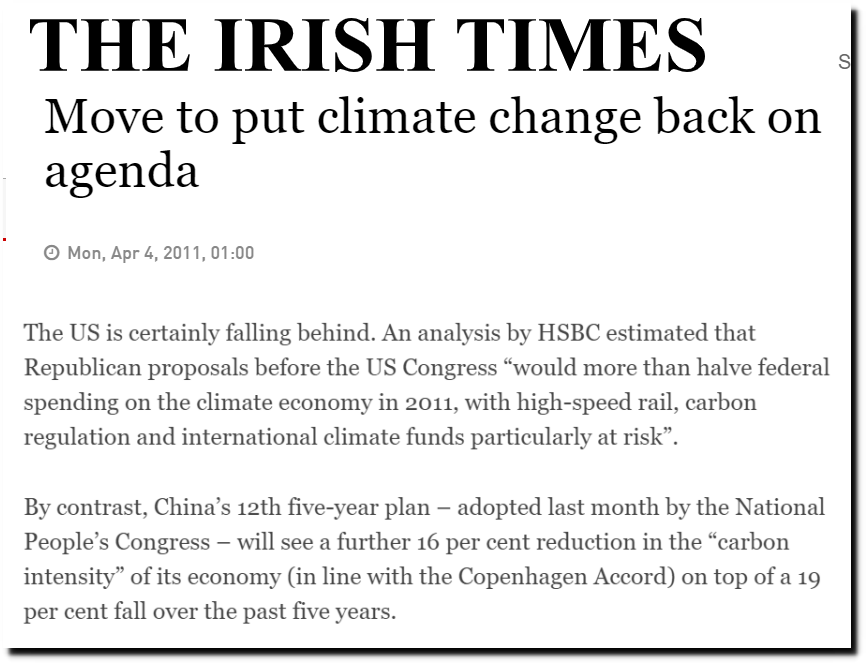
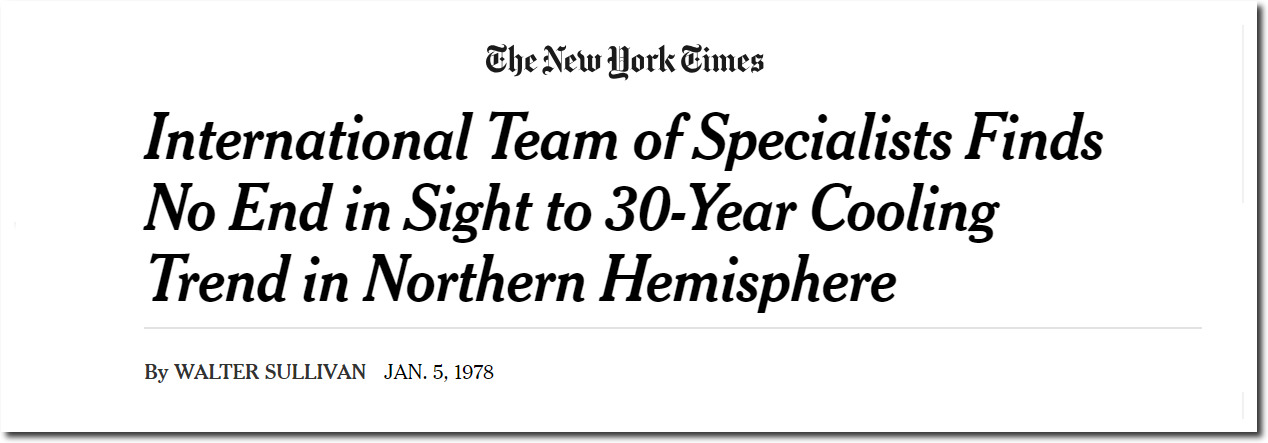
In 1978, the New York Times confirmed the cooling trend was continuing.
But NASA has since erased the post-1940 cooling.
In this Climategate email, climate scientists from different agencies discussed their desire to remove the 1940s warmth.
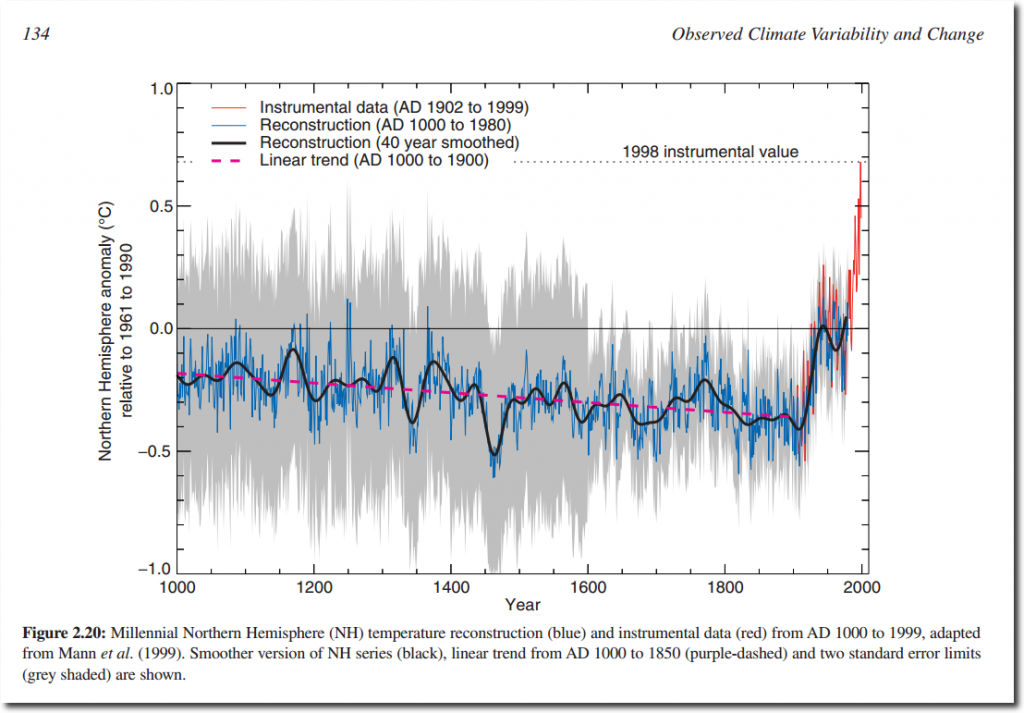
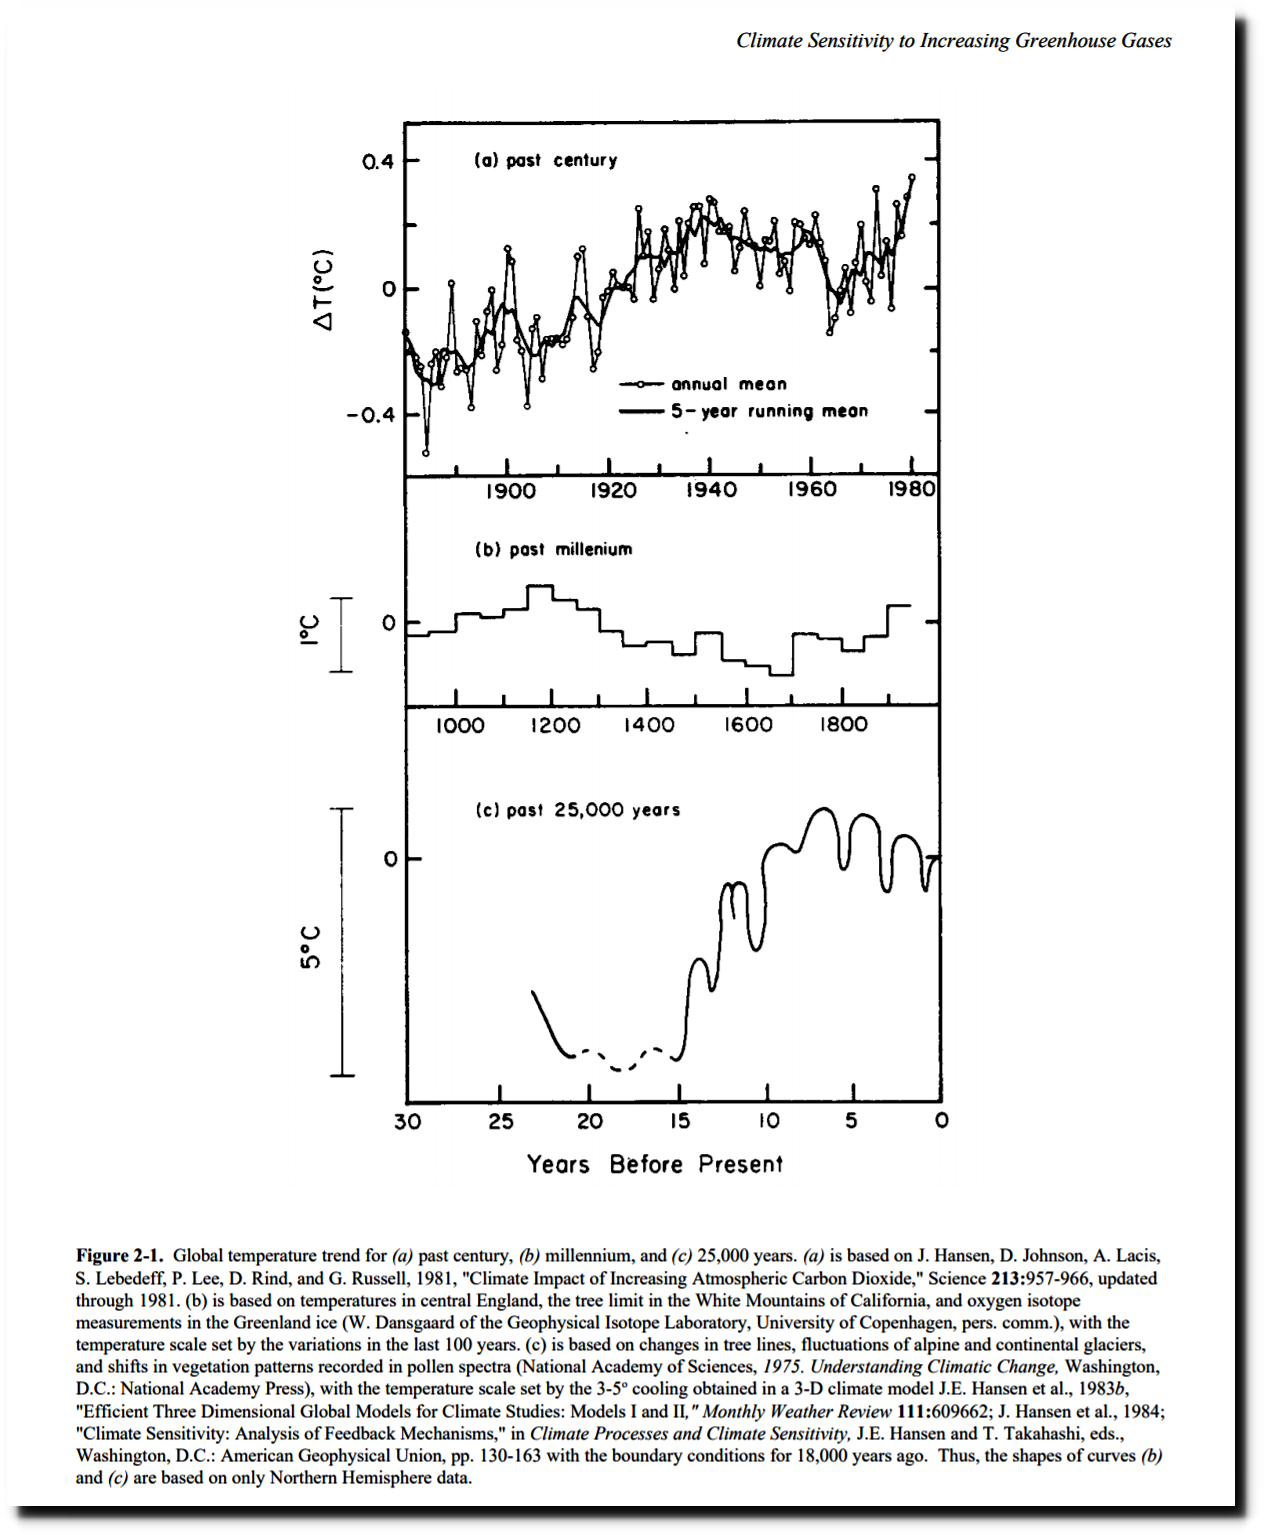
In 1981, NASA did show a 1940s blip followed by 0.3C cooling. They also showed a Medieval Warm Period and a Holocene Optimum.
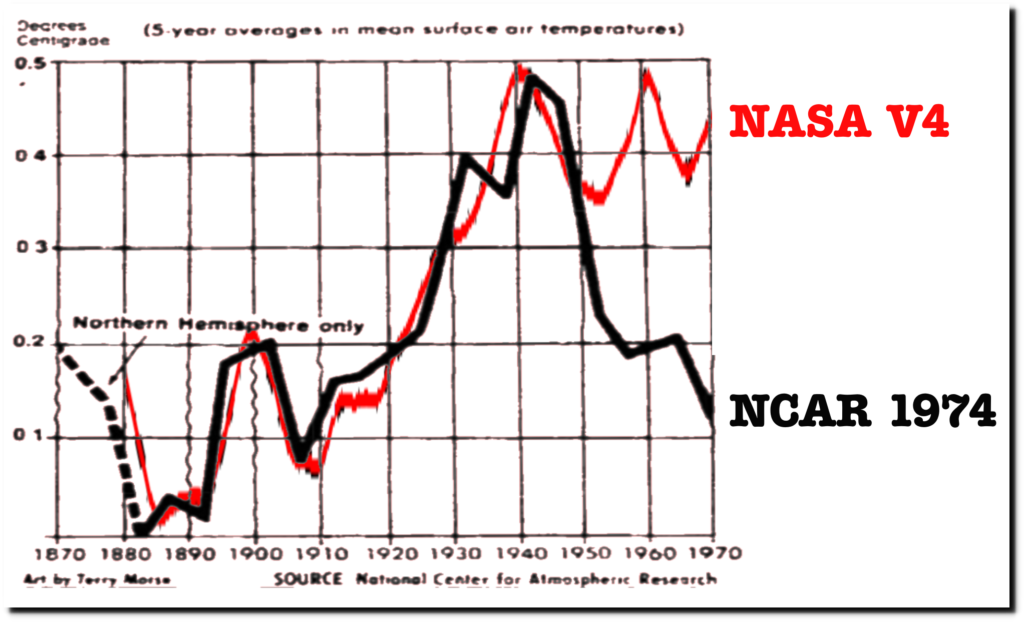
Michael Mann later erased the Medieval Warm Period.
And the post 1940s cooling has since been erased by NASA.
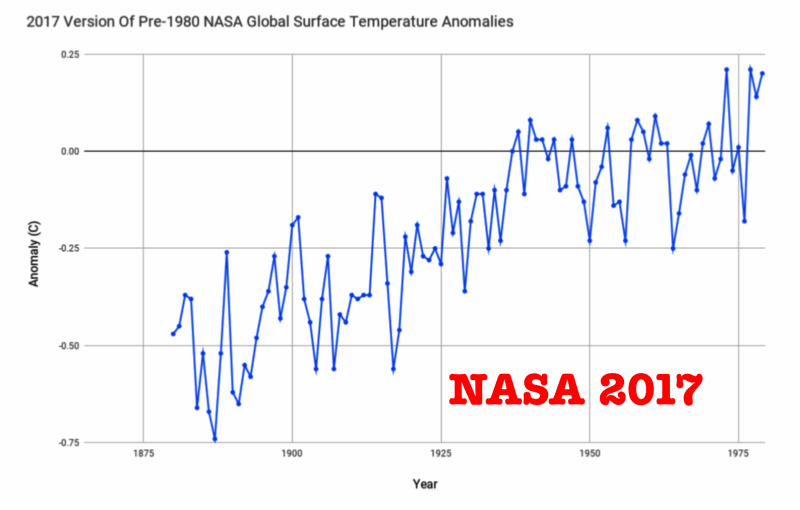
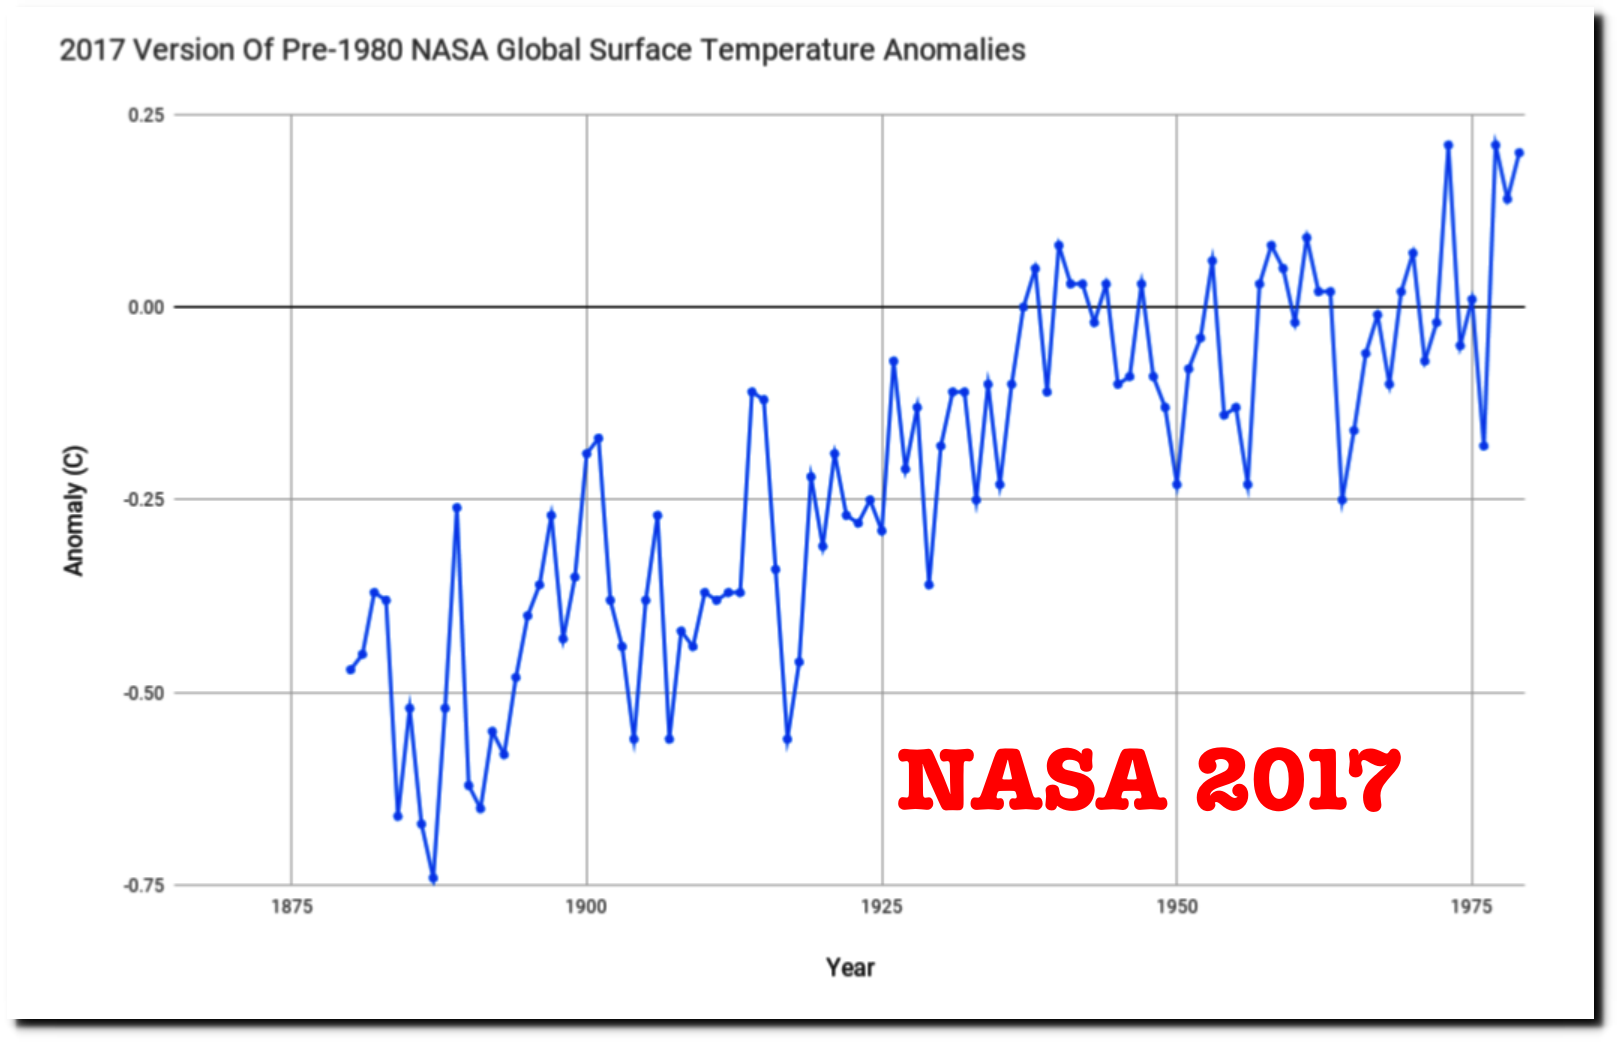
As of the year 2000, NASA showed no net warming from 1870 to 1979, with 1878 being the warmest year.
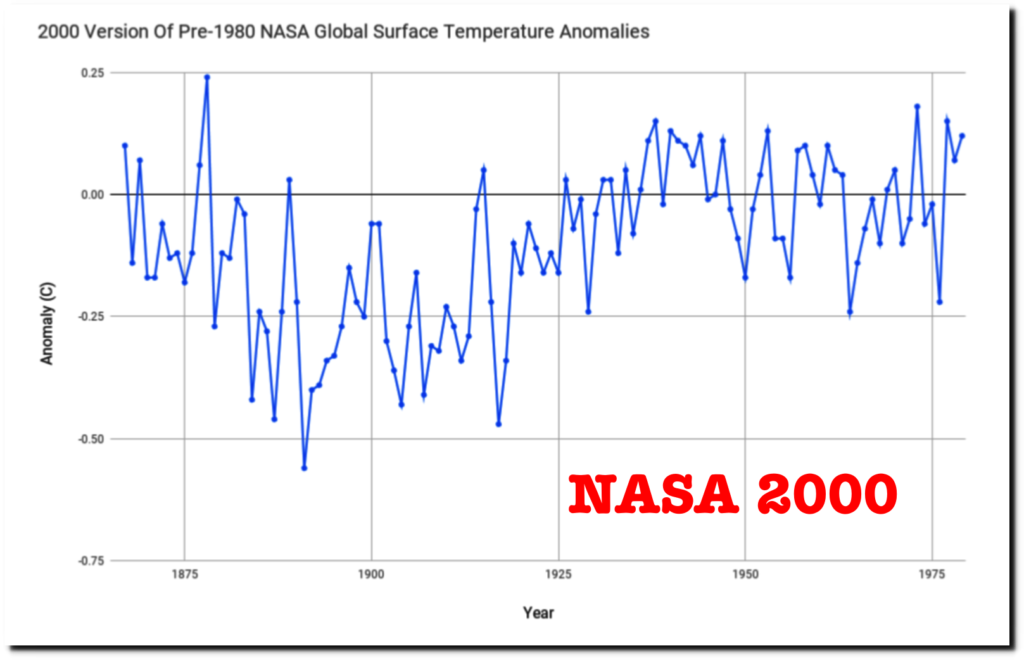
But they now hide data before 1880, and show about 0.7C warming prior to 1980
https://data.giss.nasa.gov/gistemp/history/output/met_used.zip
This animation shows how they have altered the data
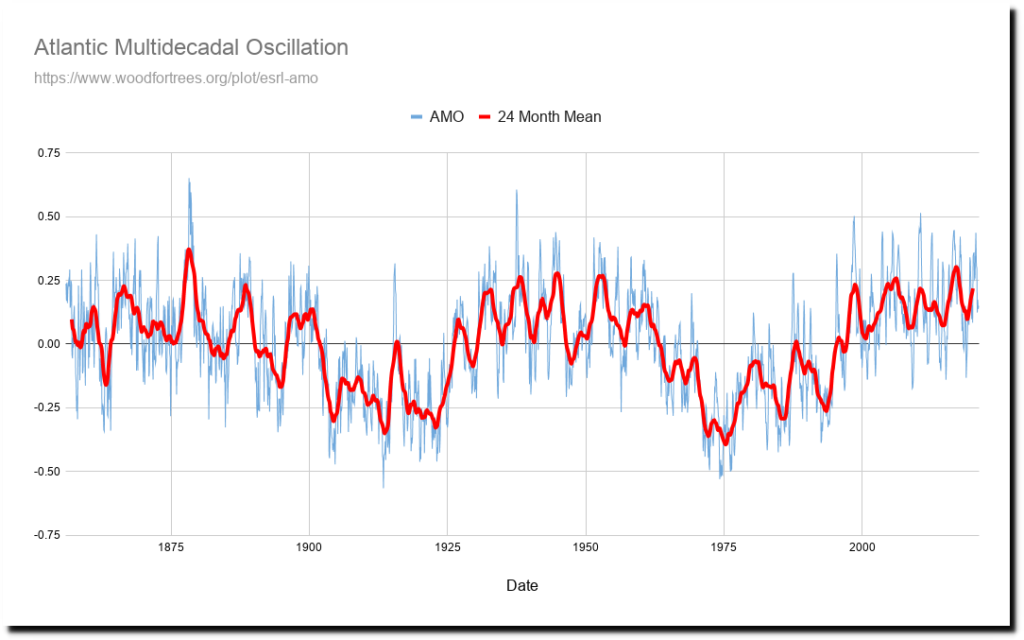
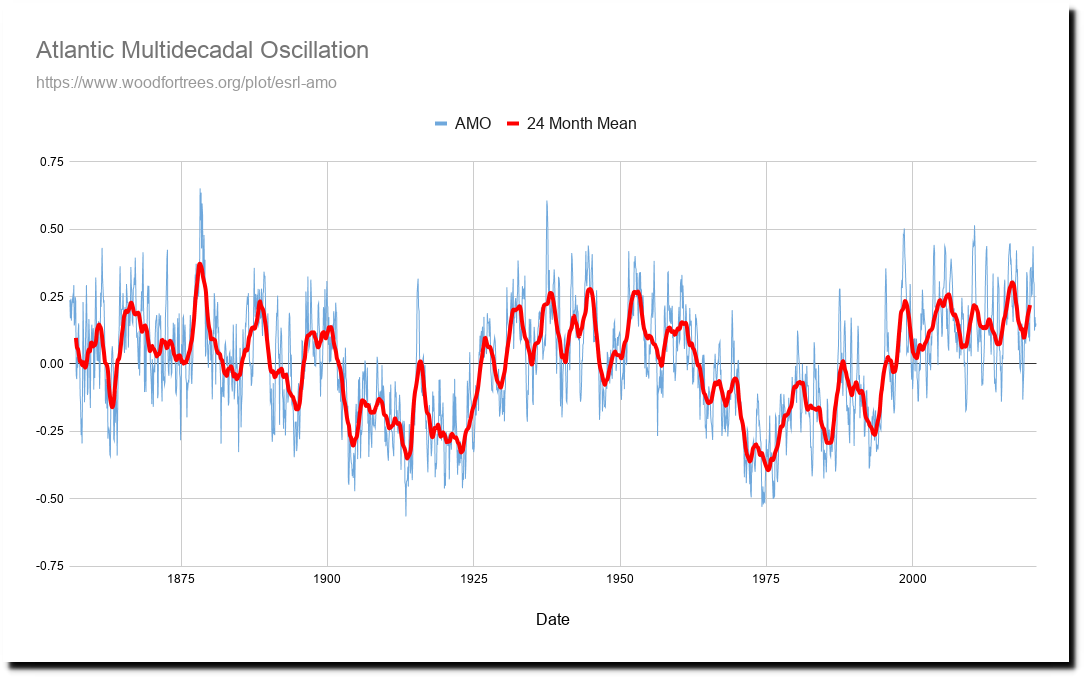
The 1878 warmth is important because the Atlantic Multidecadal Oscillation peaked in 1878, and produced record warmth and global drought.
Wood for Trees: Interactive Graphs
There was no winter in Minnesota that year.
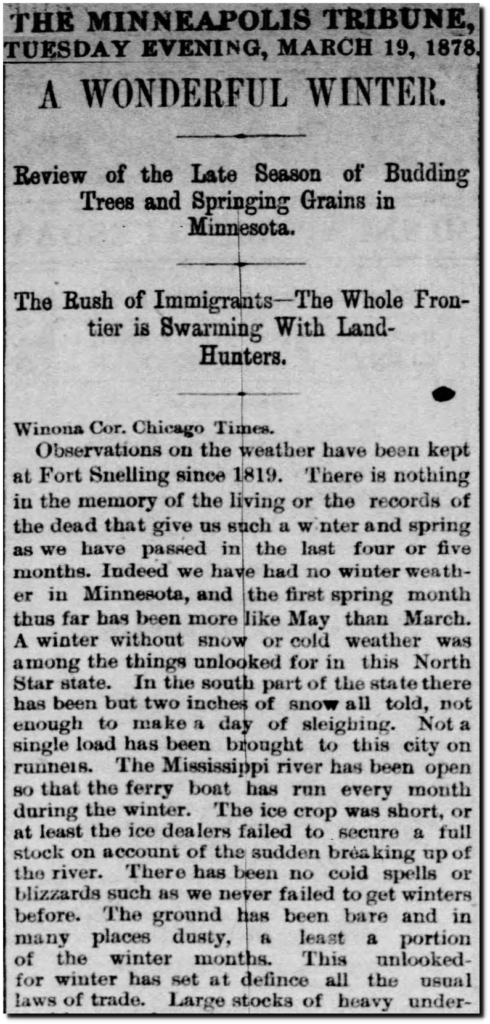
19 Mar 1878, Page 2 – Star Tribune at Newspapers.com
Australia had record heat.
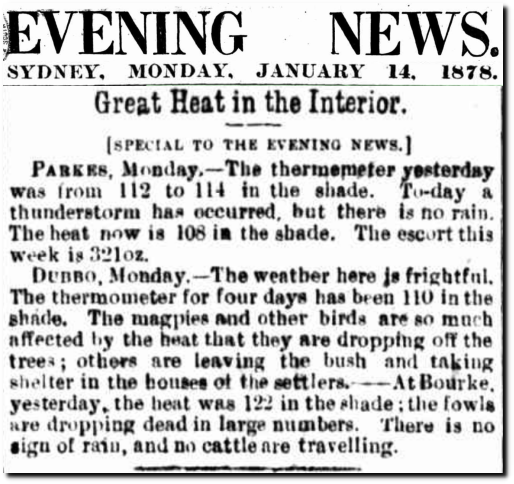
14 Jan 1878 – Great Heat in the Interior. – Trove
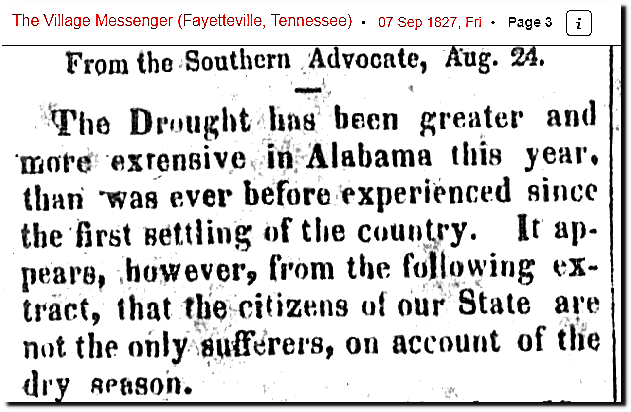
China had a famine which killed nearly ten million people.
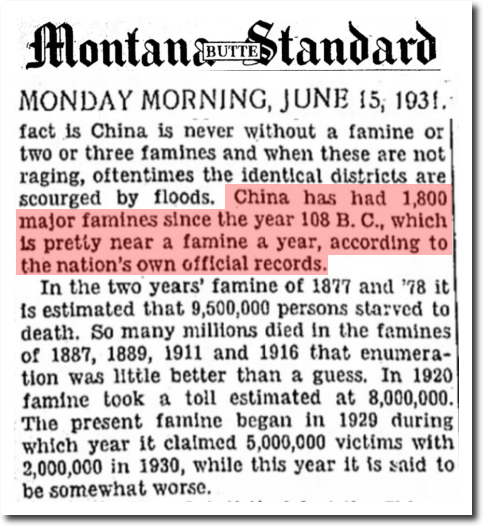
15 Jun 1931, Page 6 – Montana Butte Standard at Newspapers.com
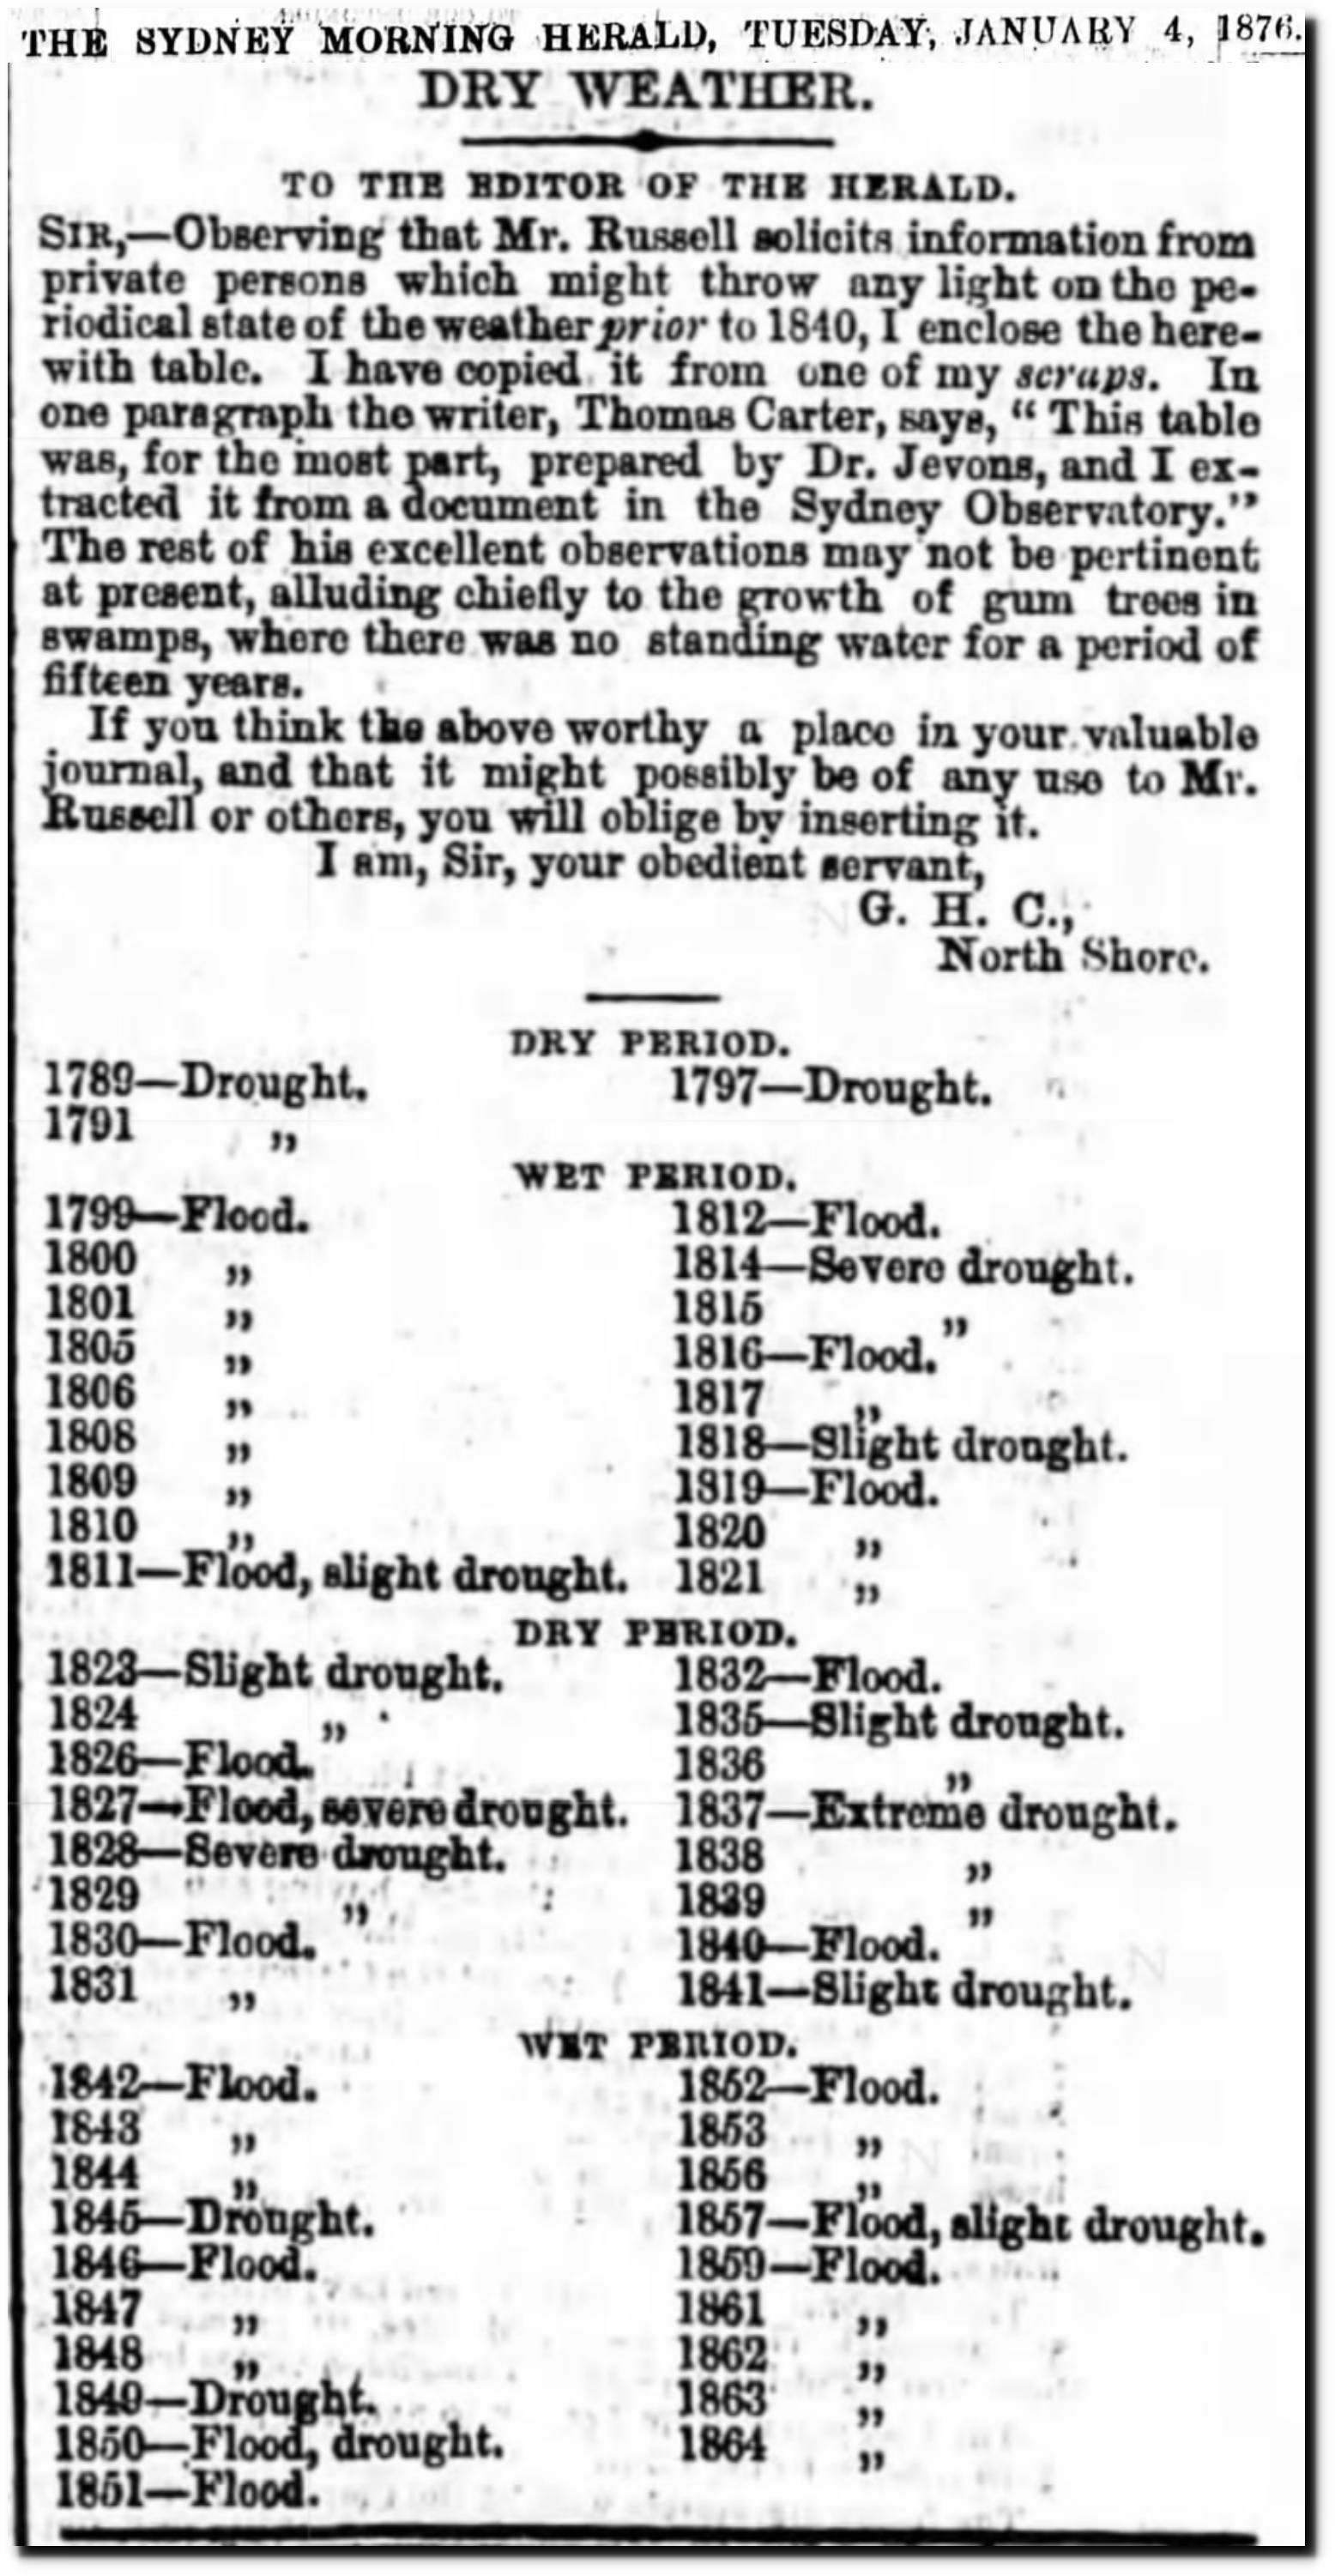
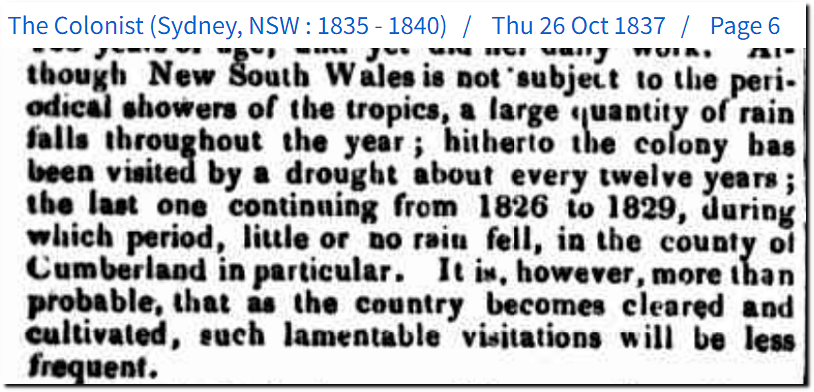
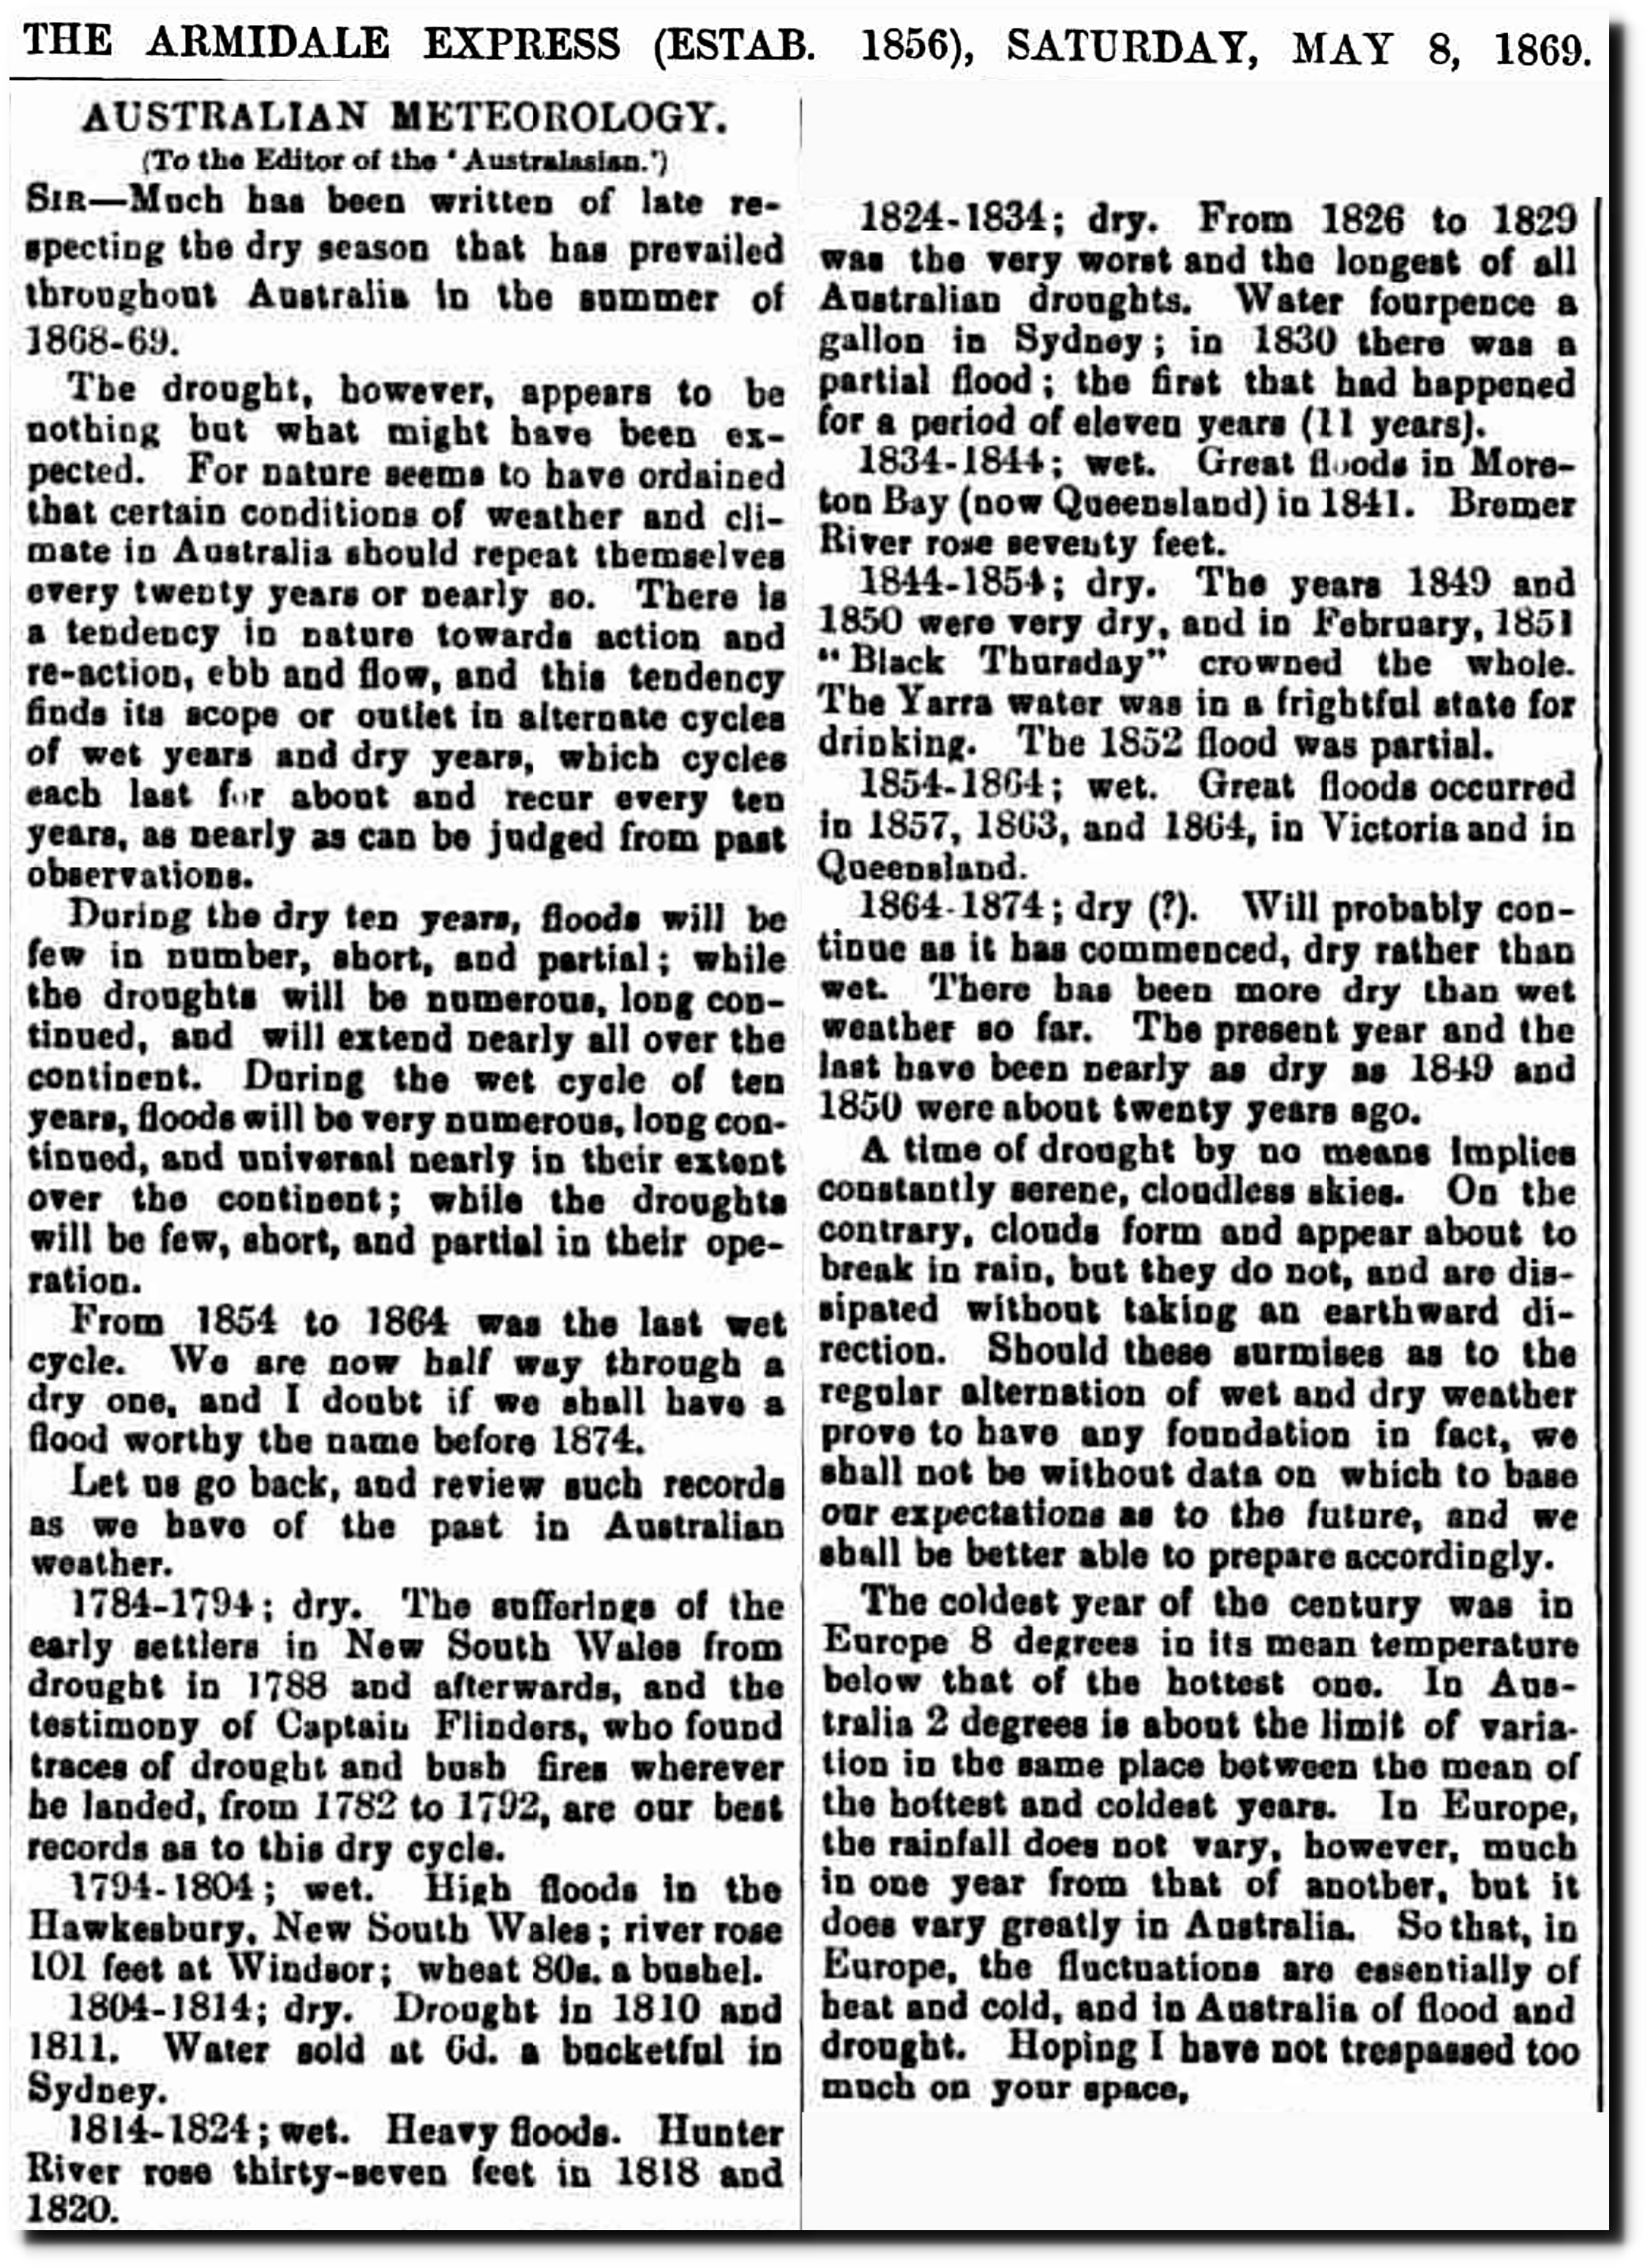
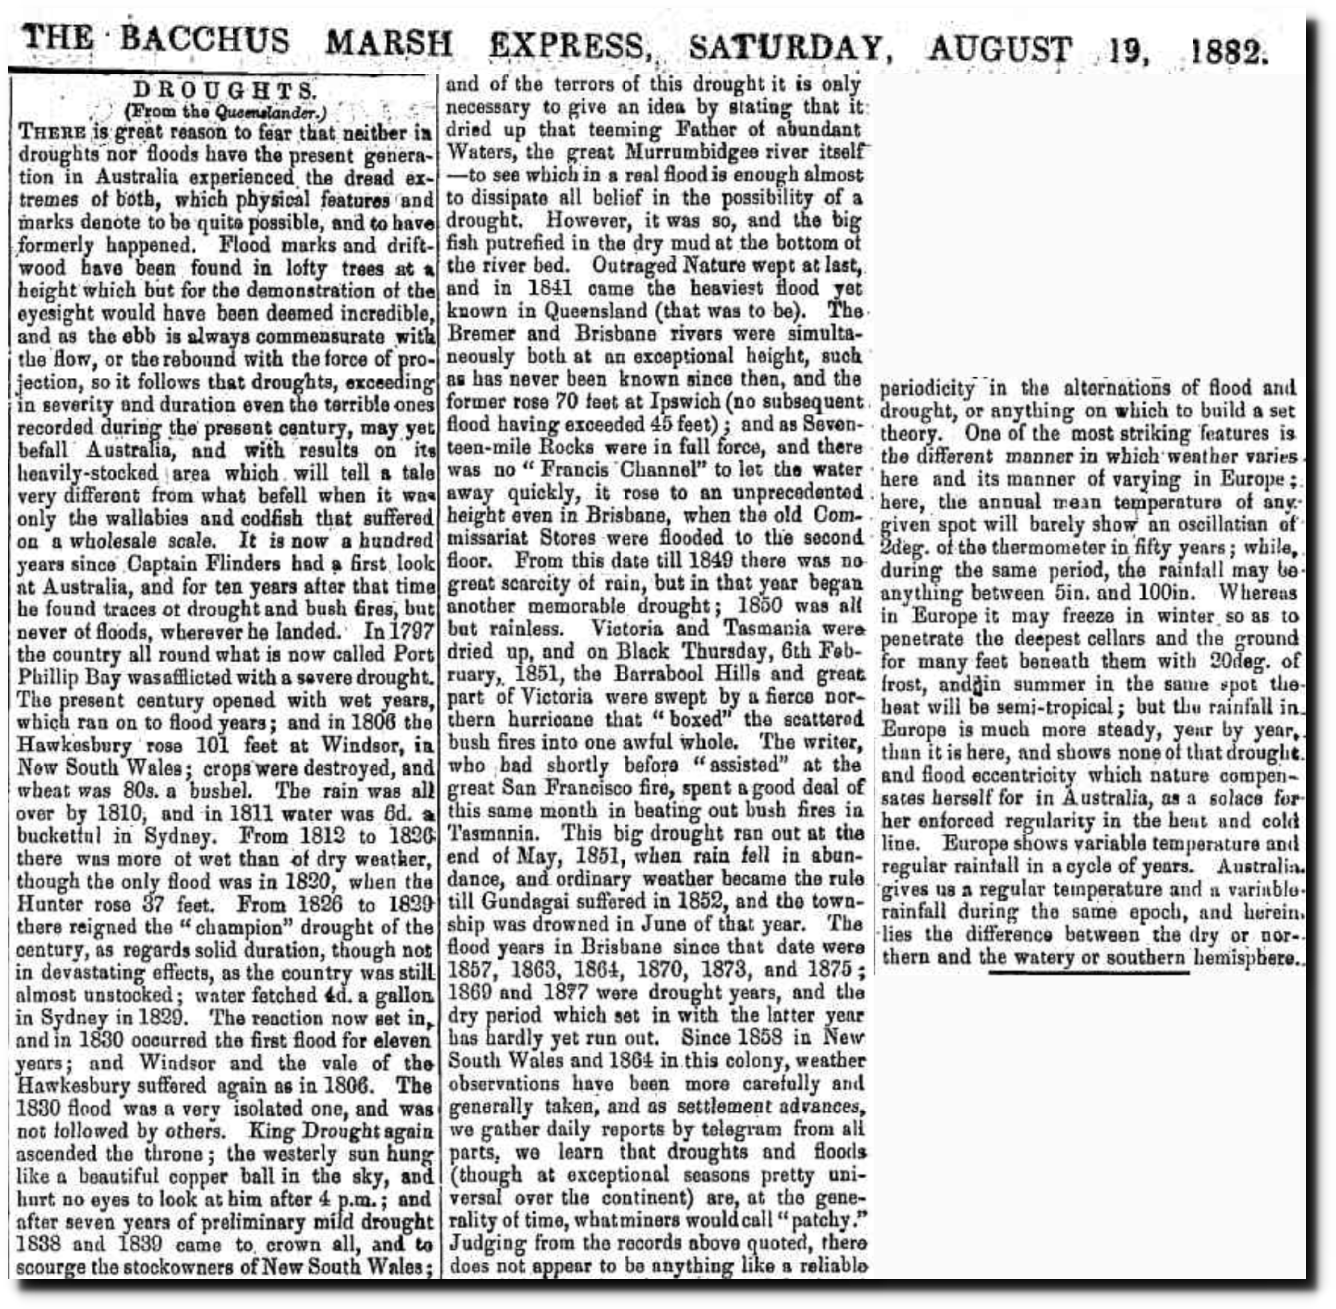
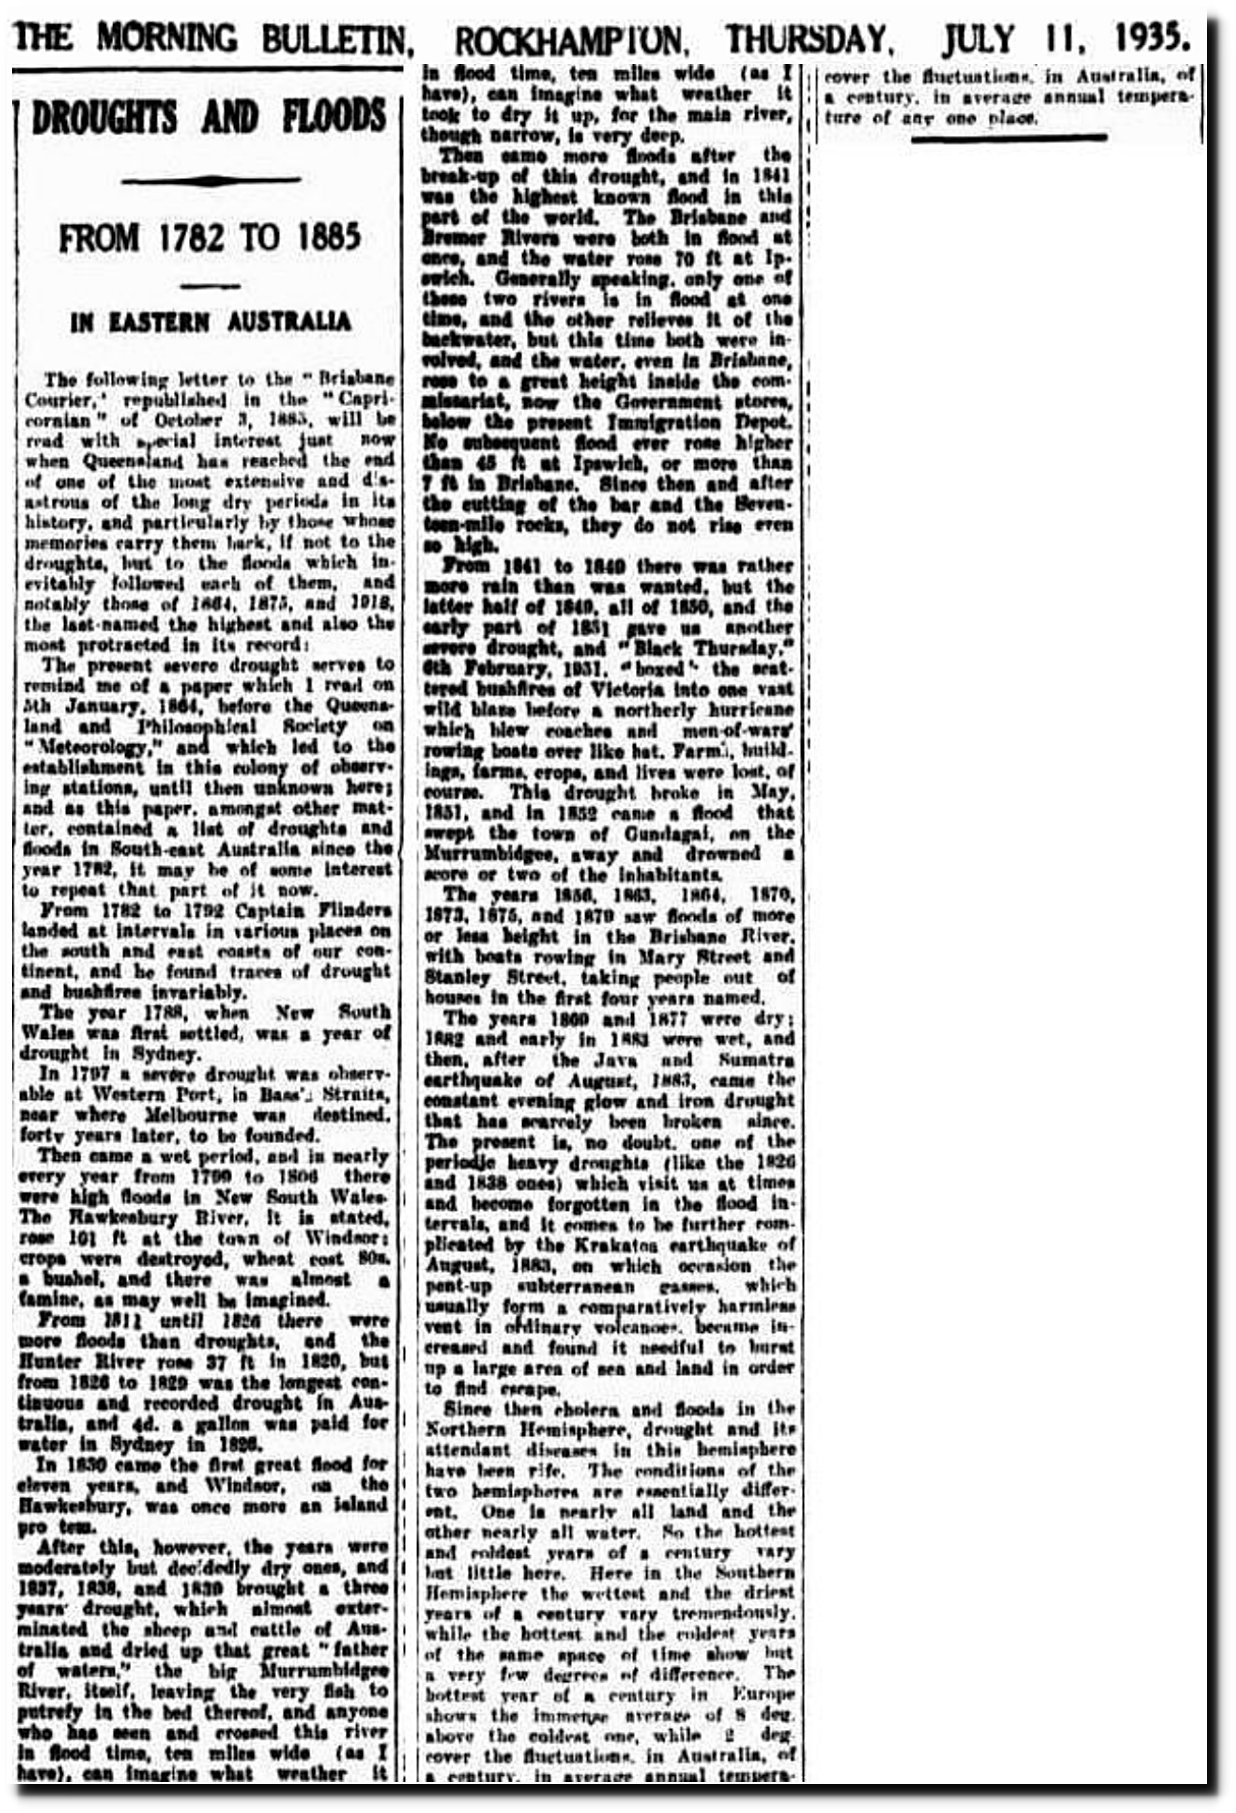
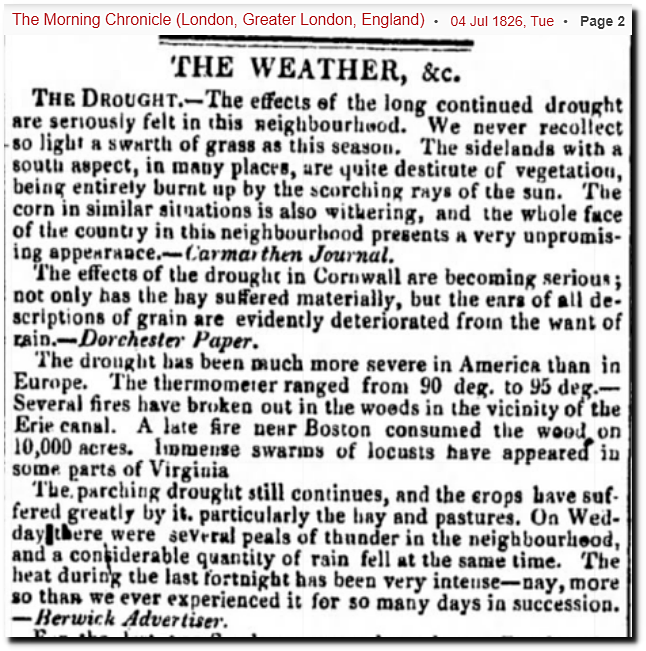
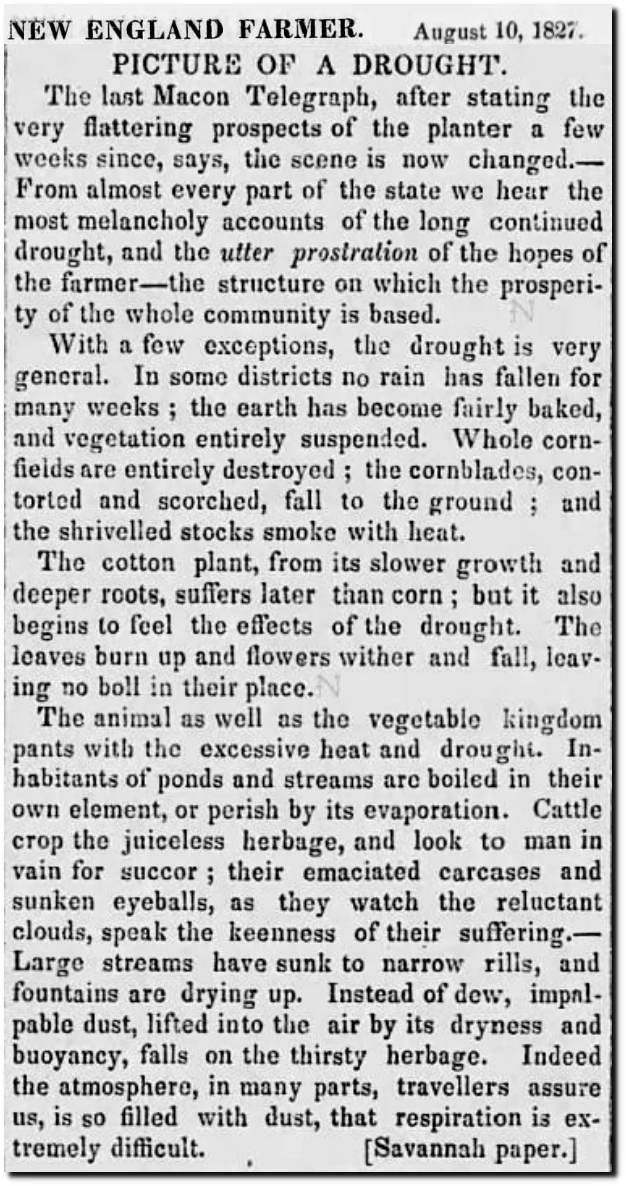
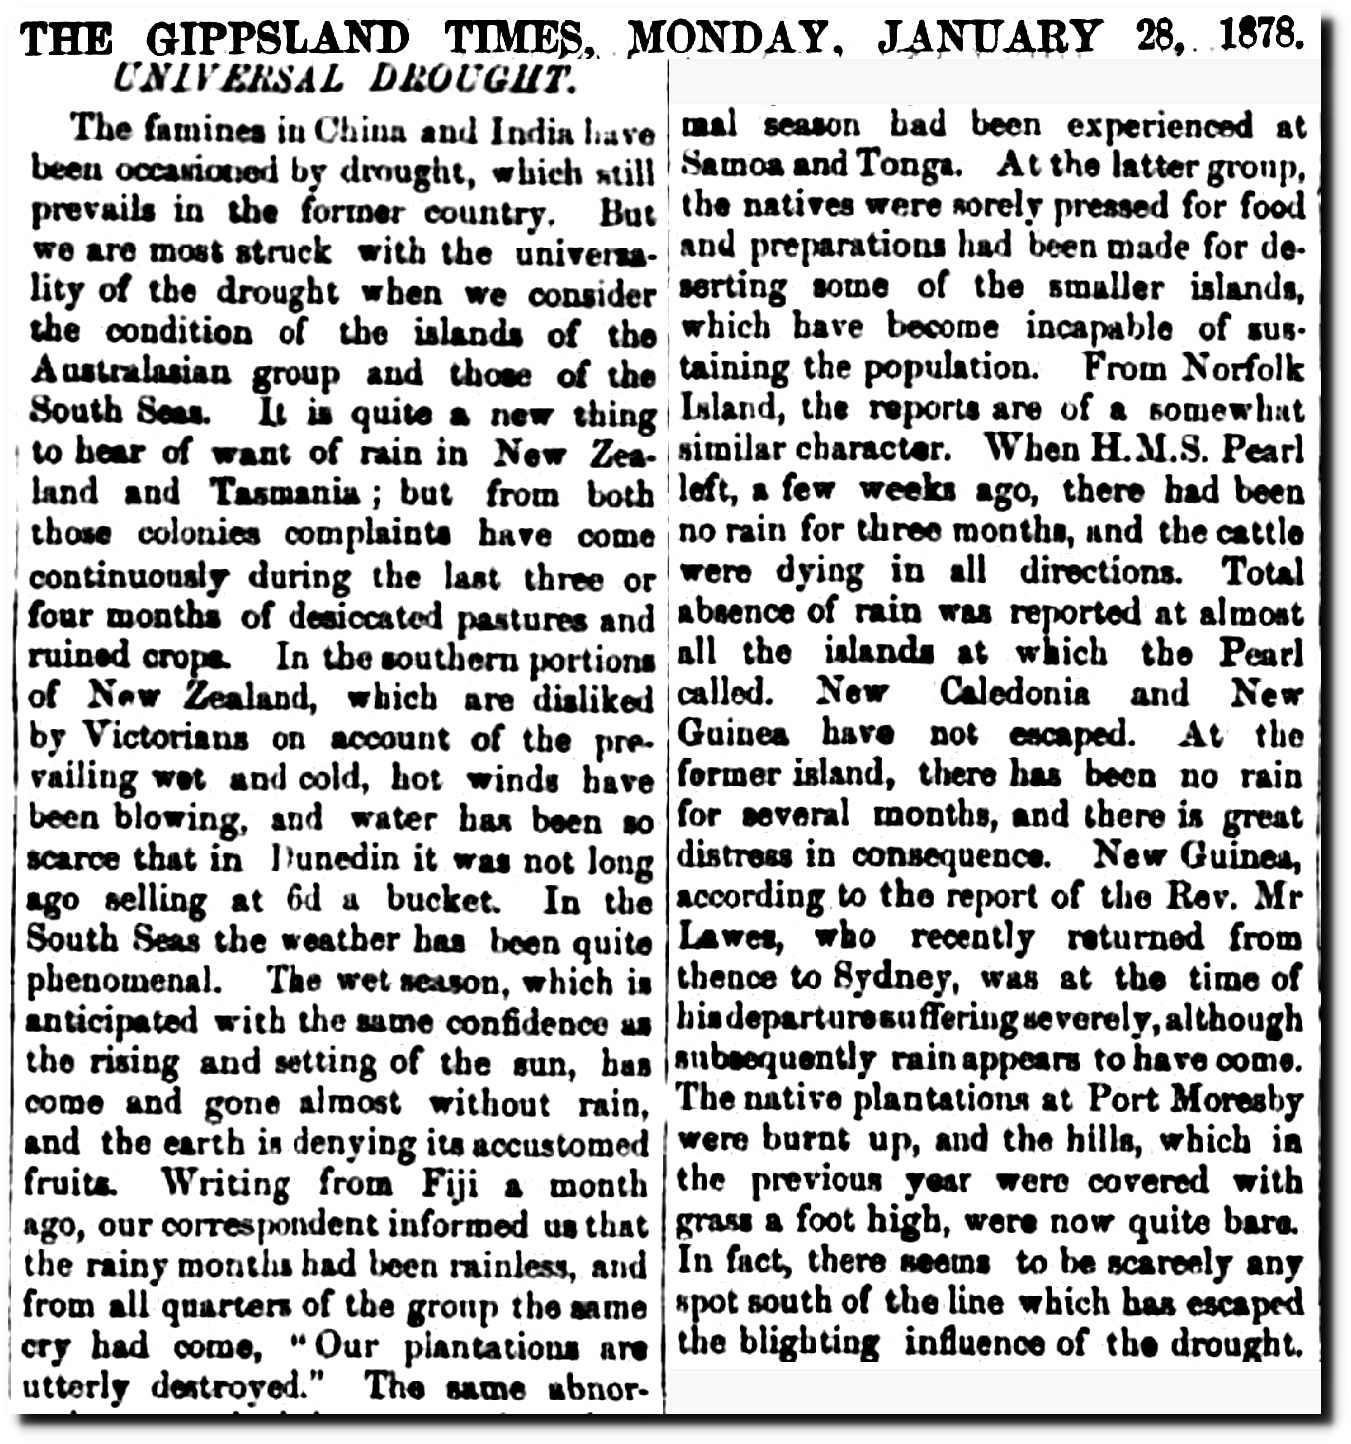
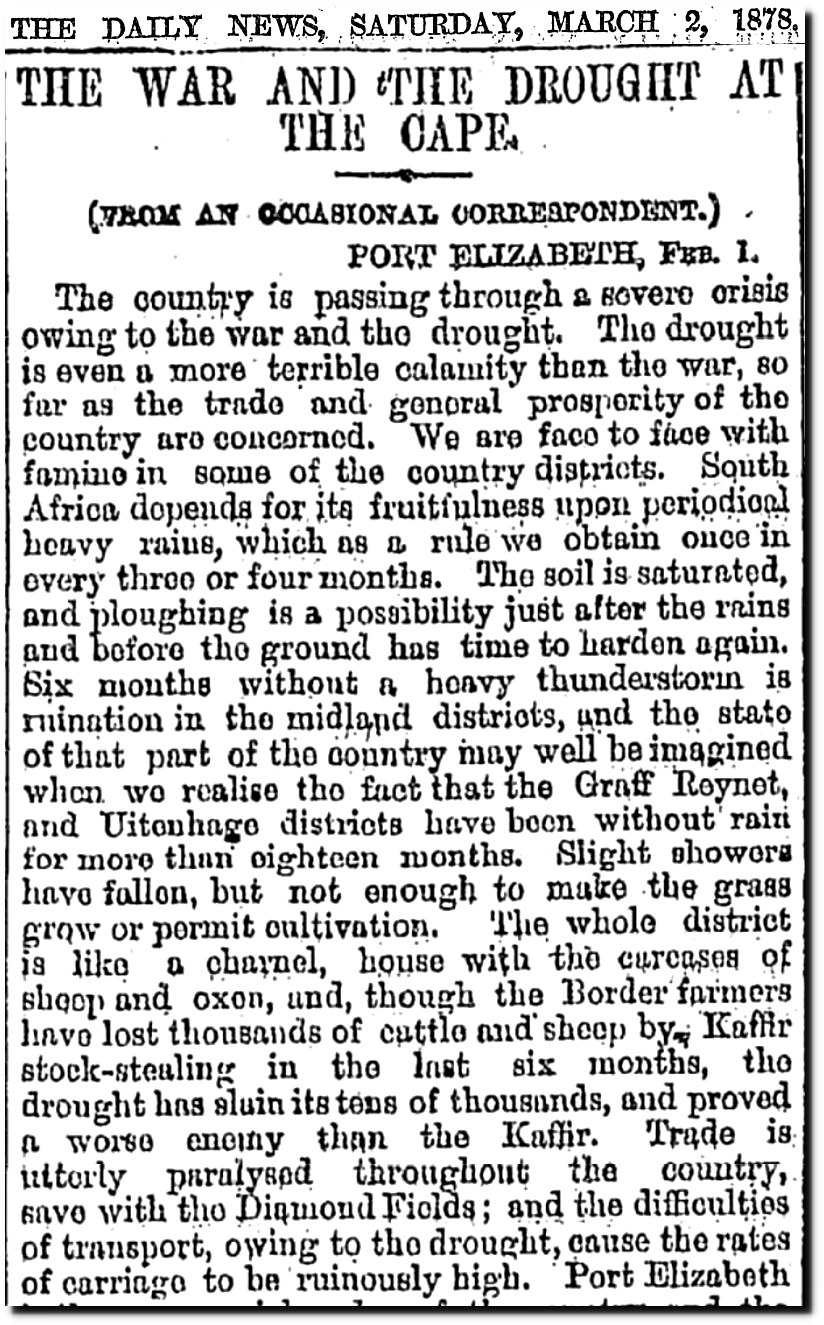
And there was universal drought.
28 Jan 1878 – UNIVERSAL DROUGHT. – Trove
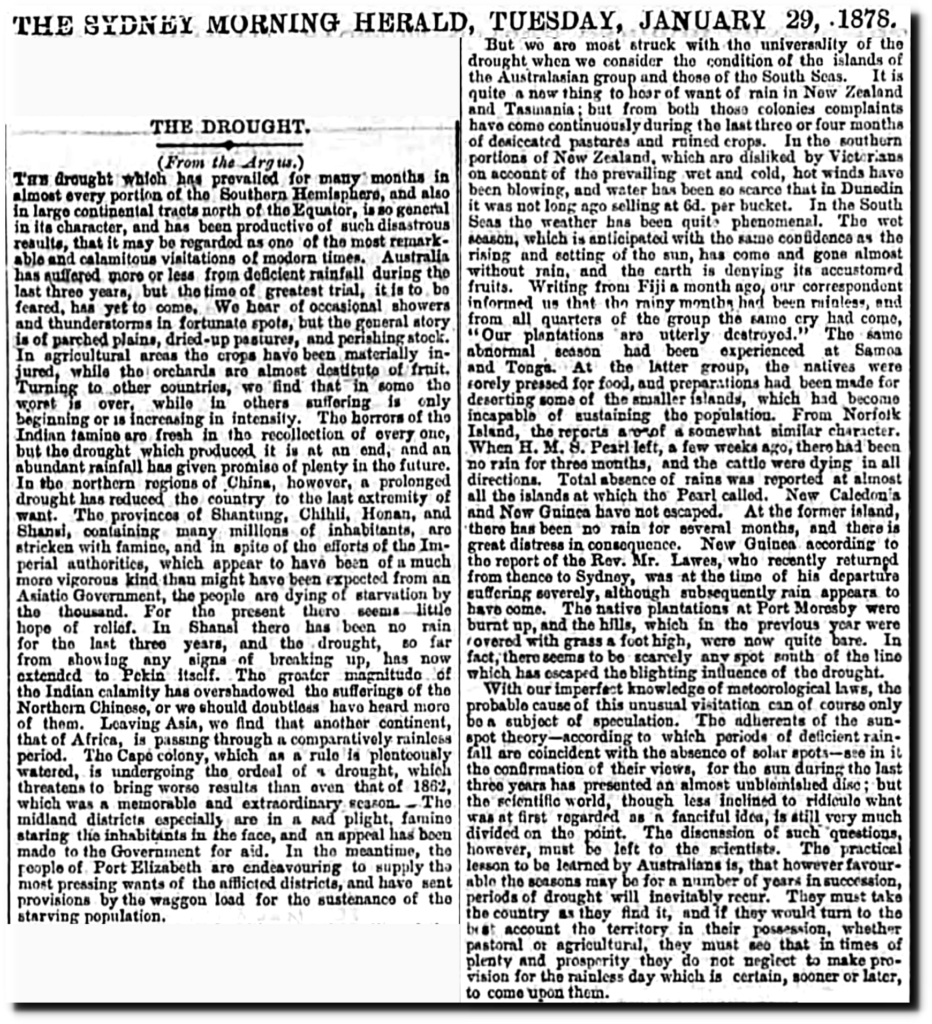
29 Jan 1878, Page 7 – The Sydney Morning Herald at Newspapers.com
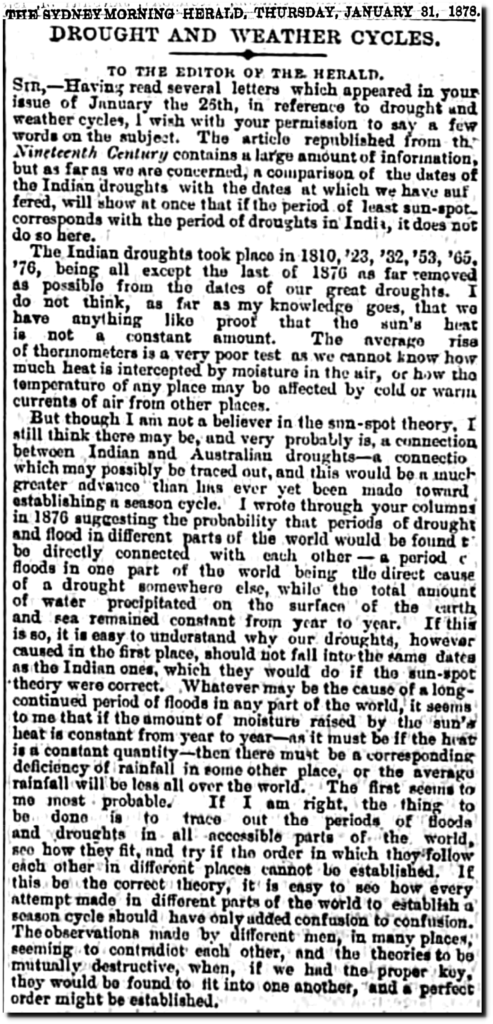
31 Jan 1878, Page 7 – The Sydney Morning Herald at Newspapers.com
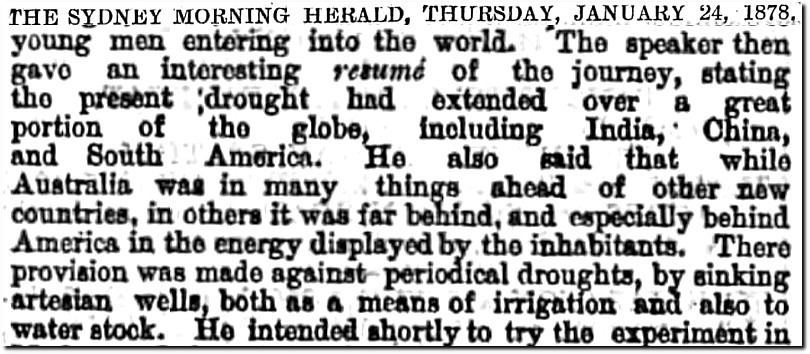
24 Jan 1878, Page 7 – The Sydney Morning Herald at Newspapers.com
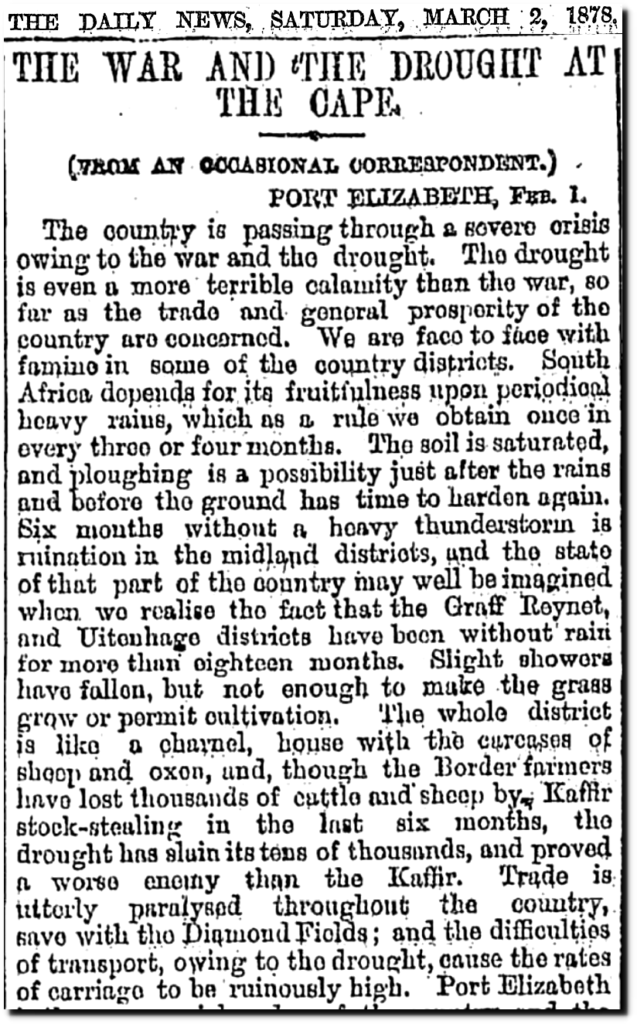
02 Mar 1878, 6 – Daily News at Newspapers.com
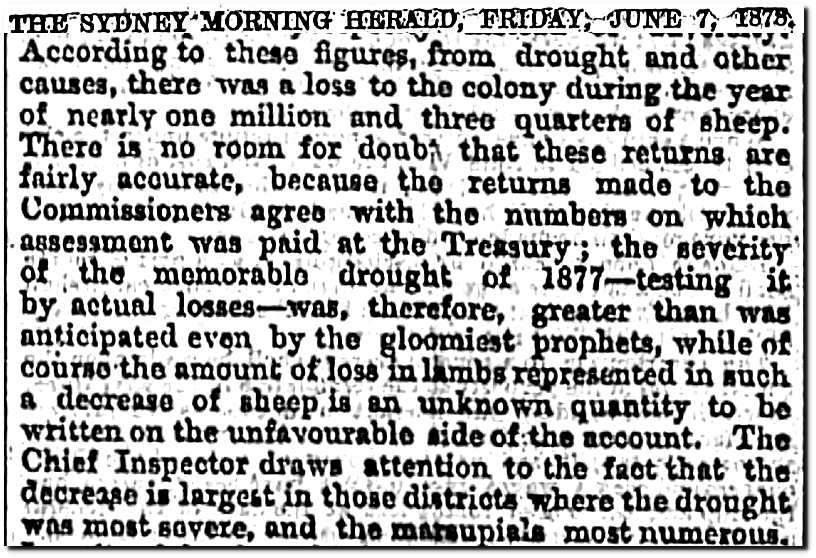
07 Jun 1878, Page 7 – The Sydney Morning Herald at Newspapers.com
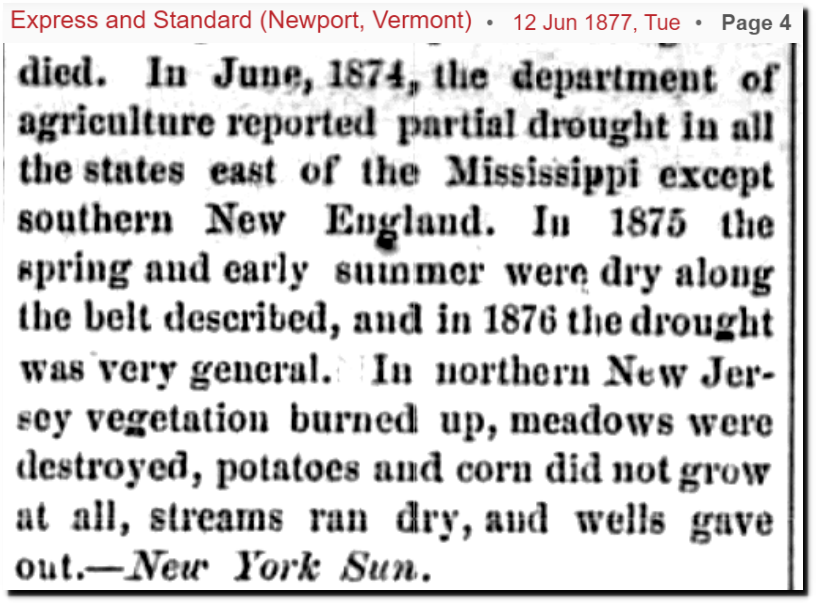
12 Jun 1877, 4 – Express and Standard at Newspapers.com
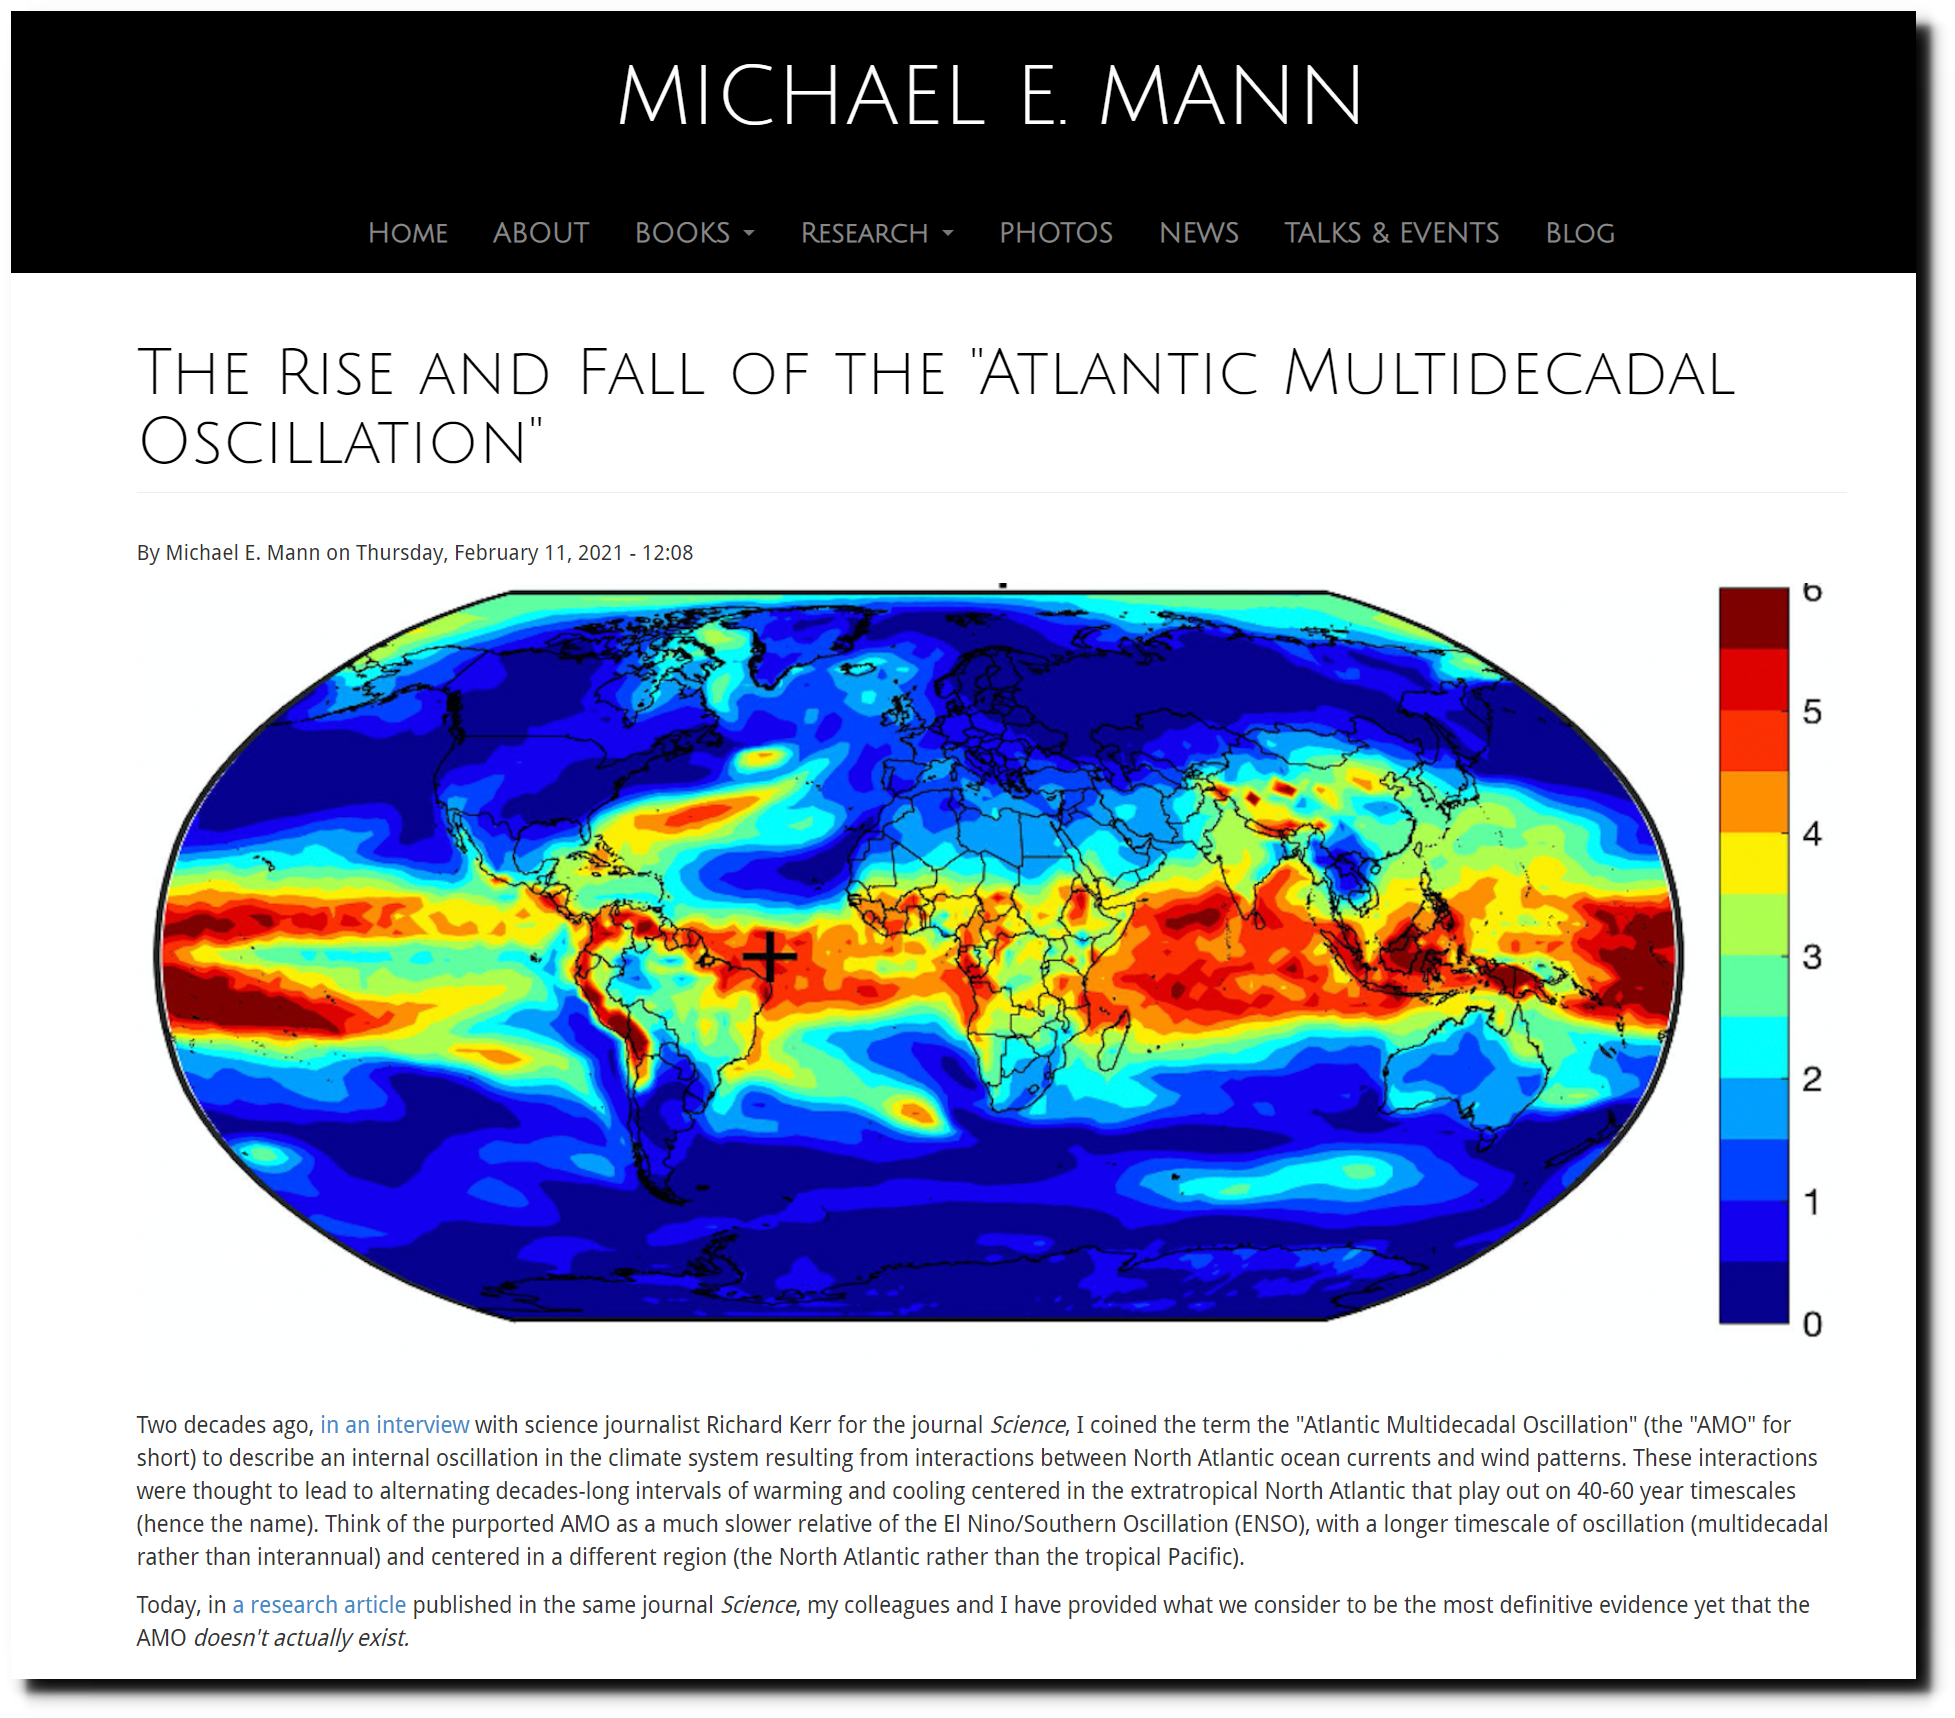
This didn’t suit the agenda of climate alarmists, so Michael Mann is now trying to erase the AMO.
The Rise and Fall of the “Atlantic Multidecadal Oscillation” | MICHAEL E. MANN
Posted in Uncategorized
Leave a comment
Progress To The 19th Century
The Biden administration forgot to provide any money for infrastructure in their first $2 trillion public theft earlier in the month, and now want to steal another $2 trillion to do useful things like expand Amtrak lines.
During the 20th century, people stopped using trains for cross country travel when other options became available – like plane travel which takes one-tenth as long, covers a much larger number of destinations, and is much cheaper. But Joe Biden wants to take people back to the 19th century and pack them on to trains, at the same time he wants people to social distance and avoid crowds.
The 1918-1919 flu pandemic infected 500 million people worldwide and killed 50 million. It was largely spread by train travel.
In Belen, N.Mex., local officials decided that only local returning residents could get off the Santa Fe trains stopping there. Out on the San Diego & Arizona Railroad, a dozen workers building the line through the Carrizo Gorge succumbed to the flu. A 2007 study in the journal Newfoundland & Labrador Studies concluded that passenger trains on the 906-mile narrow-gauge Newfoundland Railway contributed significantly to a deadly second wave of influenza that struck the island in late 1918 and into 1919.
Local leaders in Gunnison, Colo., on the Denver & Rio Grande narrow gauge, took an unusually tough stance. Motoring tourists were instructed to drive straight through town or submit to a quarantine, and passengers arriving on D&RG trains were obligated to go straight into a two-day quarantine.
As 1918 Shows, Railroads Have Been Through This Before – Railway Age
Posted in Uncategorized
Leave a comment
Ice Free Wyoming?
Experts fear that Cheyenne may become ice-free sometime this summer if the current warming trend continues.
Posted in Uncategorized
Leave a comment


