

Disrupting the Borg is expensive and time consuming!

Google Search
-
Recent Posts
- One Atomic Bomb Per Hour
- New Video : Analyzing Oil And Gas
- Is Antarctica Melting?
- High Speed Analysis And Visualization
- El Nino To The Rescue?
- Fake News Update
- Growth Of Antarctic Sea Ice
- 65 Years Of Progress!
- El Nino To The Rescue?
- Worst March Drought On Record
- ChartGL Process Control Demo
- The Biggest Money Laundering Scam
- Drought In The Headwaters Of Lake Powell
- Unrealistic Expectations Of Water Availability
- Did Bill Gates Do This?
- Worst March Drought On Record In The US
- The Real Hockey Stick Graph
- Analyzing The Western Water Crisis
- Gaslighting 1924
- “Why Do You Resist?”
- Climate Attribution Model
- Fact Checking NASA
- Fact Checking Grok
- Fact Checking The New York Times
- New Visitech Features
Recent Comments
- Gordon Vigurs on One Atomic Bomb Per Hour
- Gordon Vigurs on One Atomic Bomb Per Hour
- Gordon Vigurs on One Atomic Bomb Per Hour
- Bob G on One Atomic Bomb Per Hour
- Robertvd on One Atomic Bomb Per Hour
- czechlist on One Atomic Bomb Per Hour
- conrad ziefle on One Atomic Bomb Per Hour
- conrad ziefle on One Atomic Bomb Per Hour
- D. Boss on One Atomic Bomb Per Hour
- D. Boss on One Atomic Bomb Per Hour
New Video : Extreme Fraud At The Union Of Concerned Scientists
Posted in Uncategorized
Leave a comment
The Scary Heat Index
The National Weather Service tweeted this scary map of Missouri temperatures ranging from 105 degrees to 114 degrees.
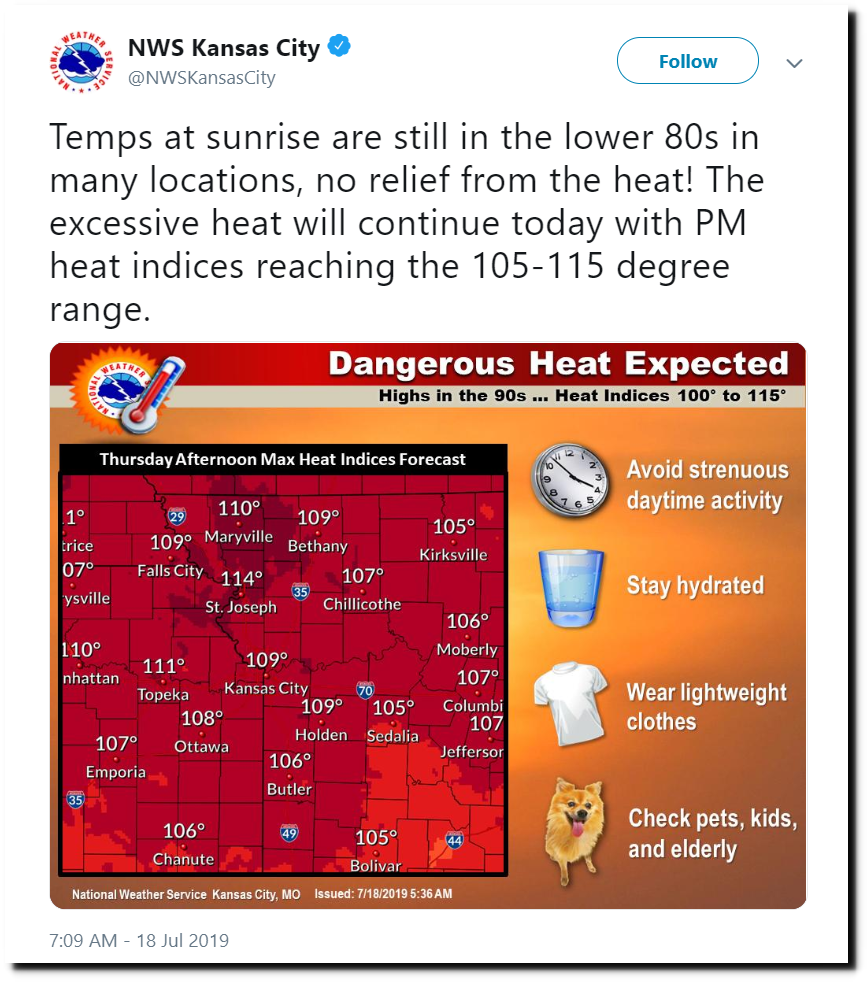
Only problem is, they weren’t actual temperatures – they were the “heat index.” The actual temperature at St. Joseph, Missouri today was 95 degrees – not 114 degrees.
Now compare with this date in 1936, when air temperatures reached 118 degrees. Lamar, Missouri was 26 degrees hotter on this date in 1936 than it was today.

People now spend their entire life in air conditioned buildings and cars, and imagine they live in the hottest weather ever. There is no awareness of how people lived in the past – which is essential for keeping the climate scam alive. The victim mentality is behind everything progressives do.

Posted in Uncategorized
Leave a comment
It’s Not Your Imagination – The New York Times Is Getting More Dishonest
It’s Not Your Imagination. Summers Are Getting Hotter. Extraordinarily hot summers — the kind that were virtually unheard-of in the 1950s — have become commonplace.
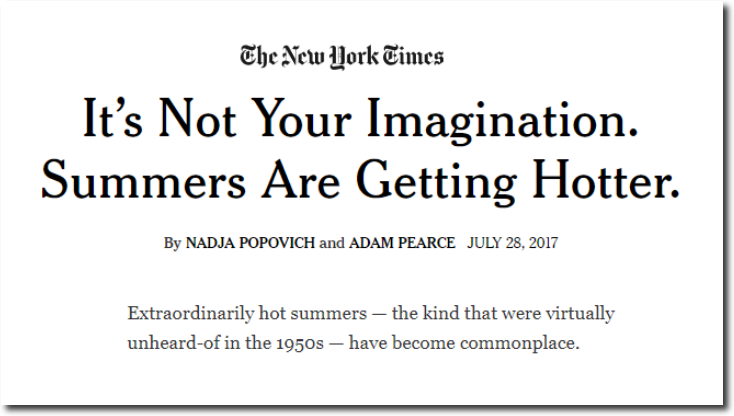
It’s Not Your Imagination. Summers Are Getting Hotter. – The New York Times
The New York Times claims are the exact opposite of reality. The hottest summer in the Northeast was 1949, and the second hottest was 1955. There is no indication that summers in the Northeast are getting hotter.
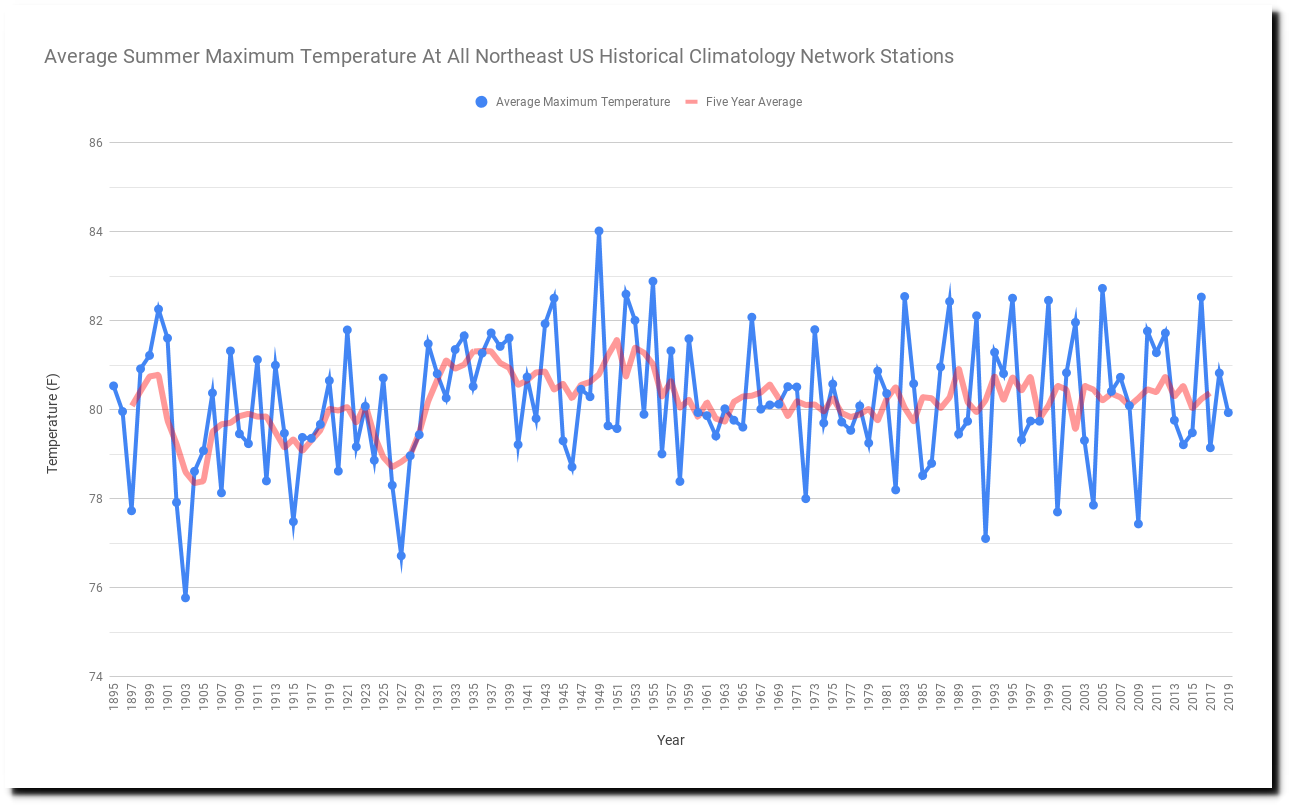
The frequency of hot days in the Northeast has generally been low since the 1950s, with the notable exception of 1988, 1999 and 2002. Recent summers have been among the coolest on record.
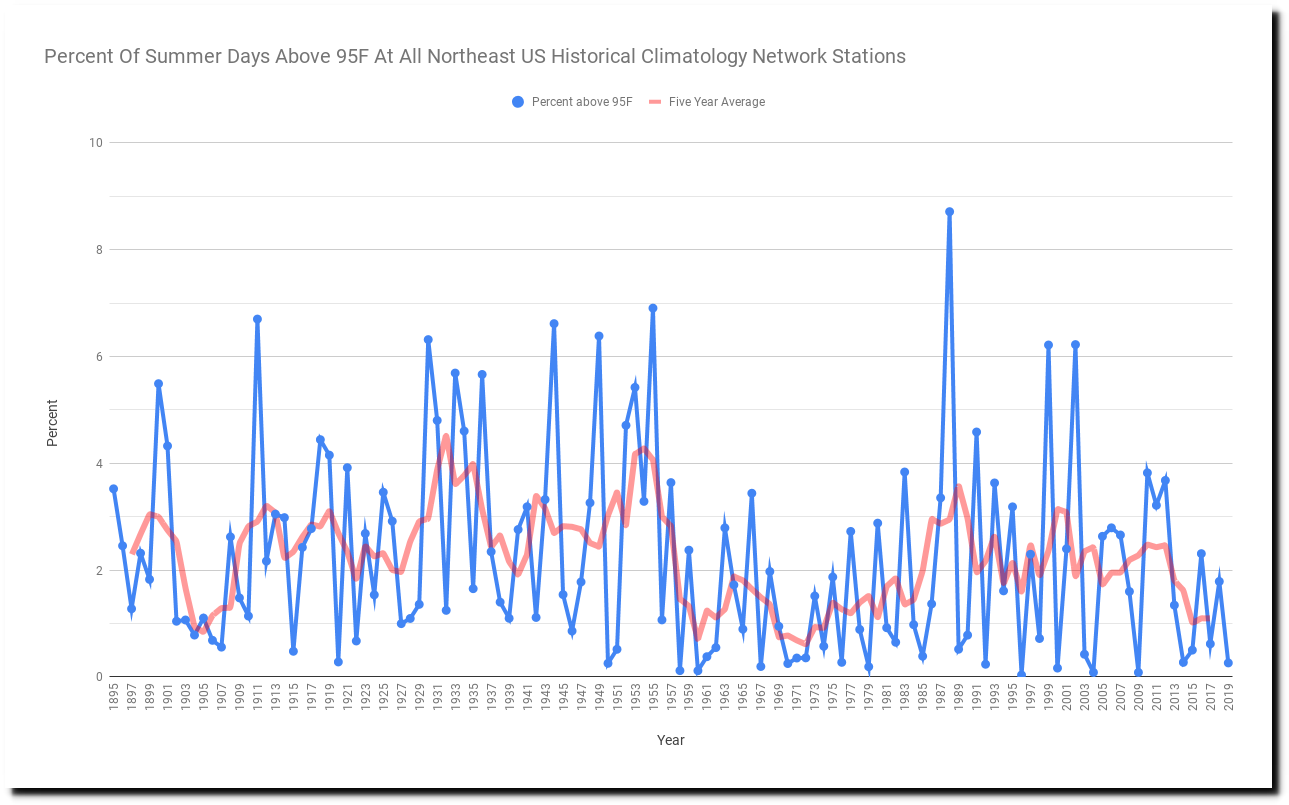
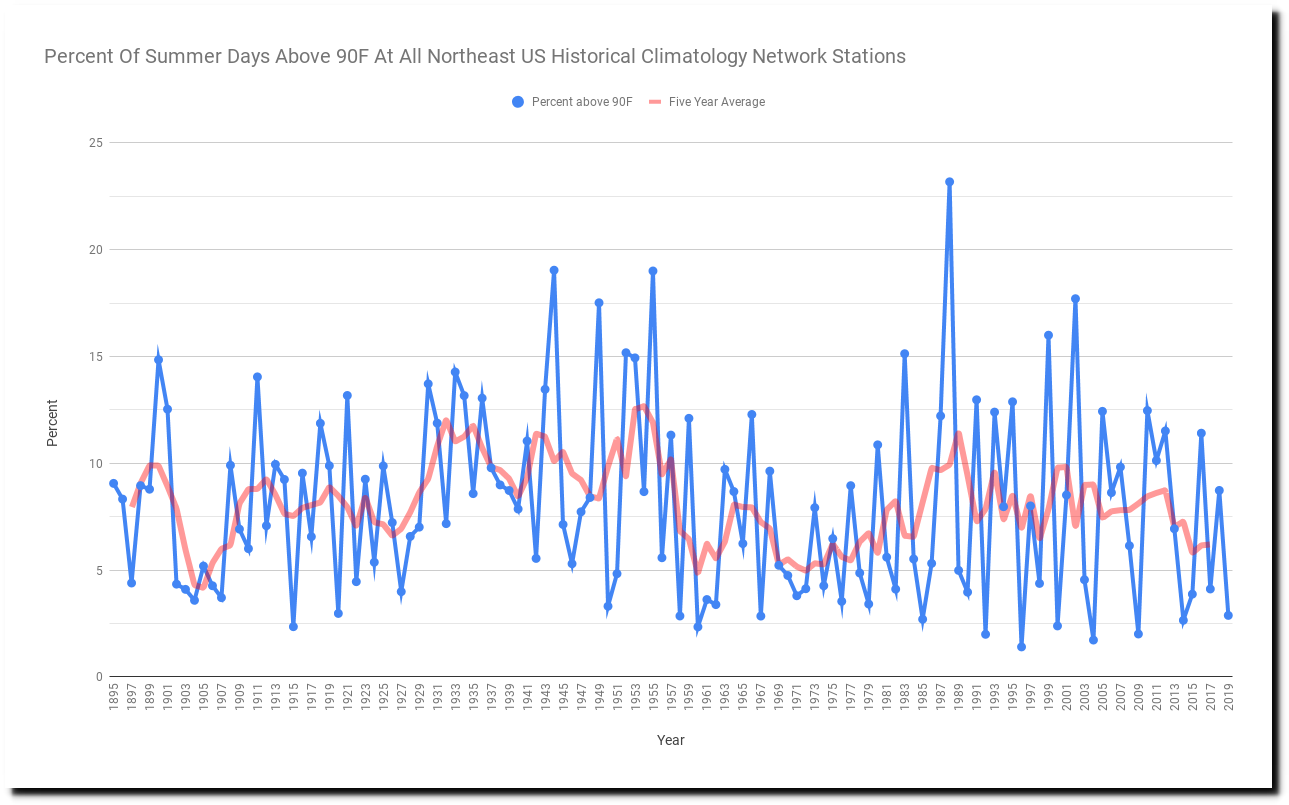
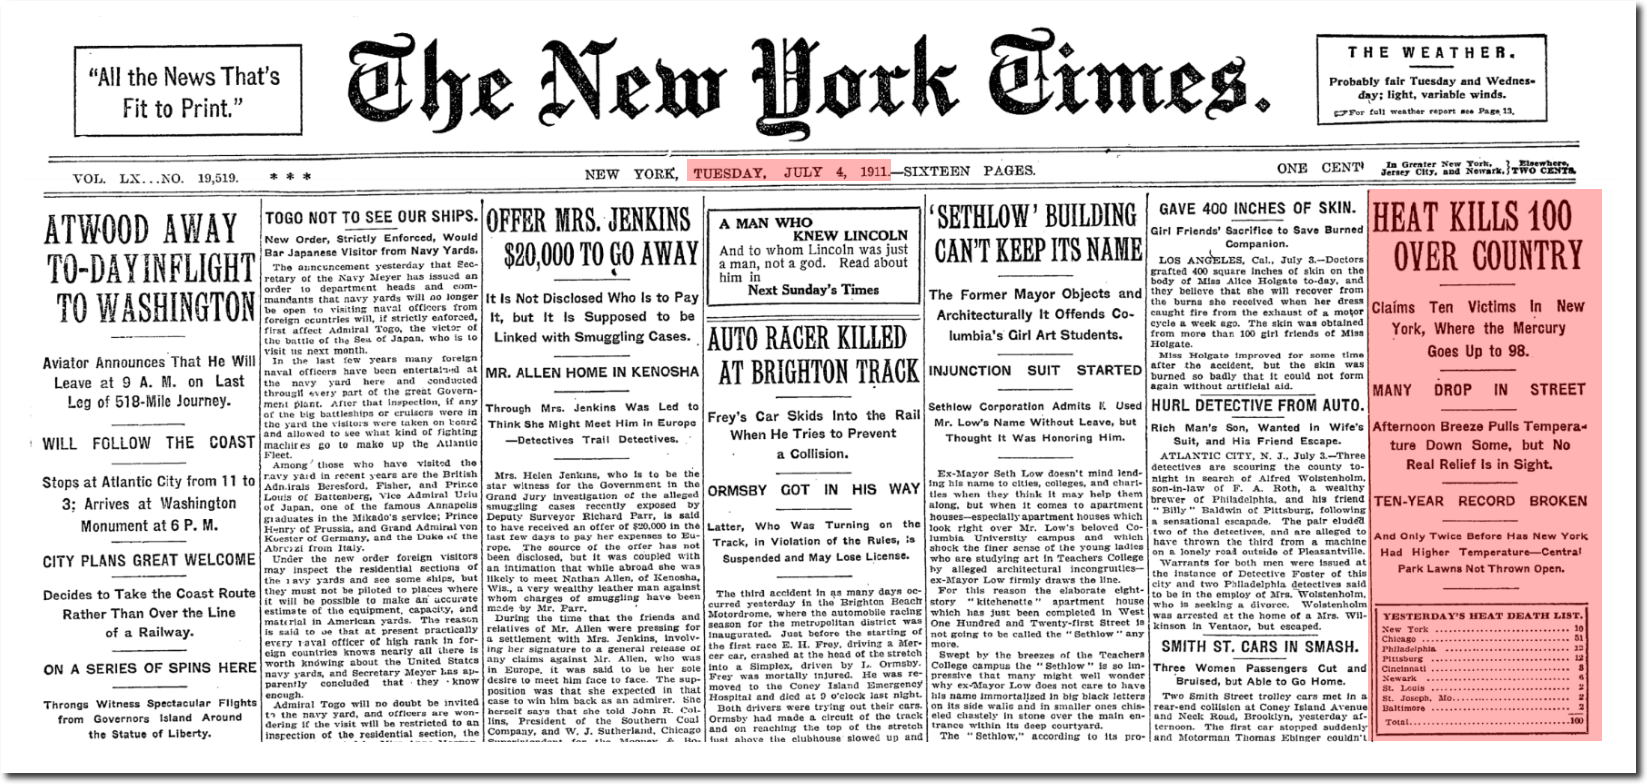
The Northeast US has had seventeen days since 1895 which averaged above 95F (35C.) Five occurred in 1911, and all but one occurred more than sixty years ago. The hottest day on record in the Northeast was July 3, 1911 and the second hottest was July 4, 1911.
7/3/1911    97.1
7/4/1911    96.5
7/10/1936   96.4
7/5/1911    96.2
8/7/1918    96.0
7/9/1936    95.9
9/2/1953    95.8
8/27/1948   95.7
7/5/1919    95.7
8/26/1948   95.7
7/22/2011   95.5
7/3/1898    95.5
7/3/1966    95.5
7/10/1911   95.4
7/4/1919    95.3
7/6/1911    95.3
8/28/1948   95.2
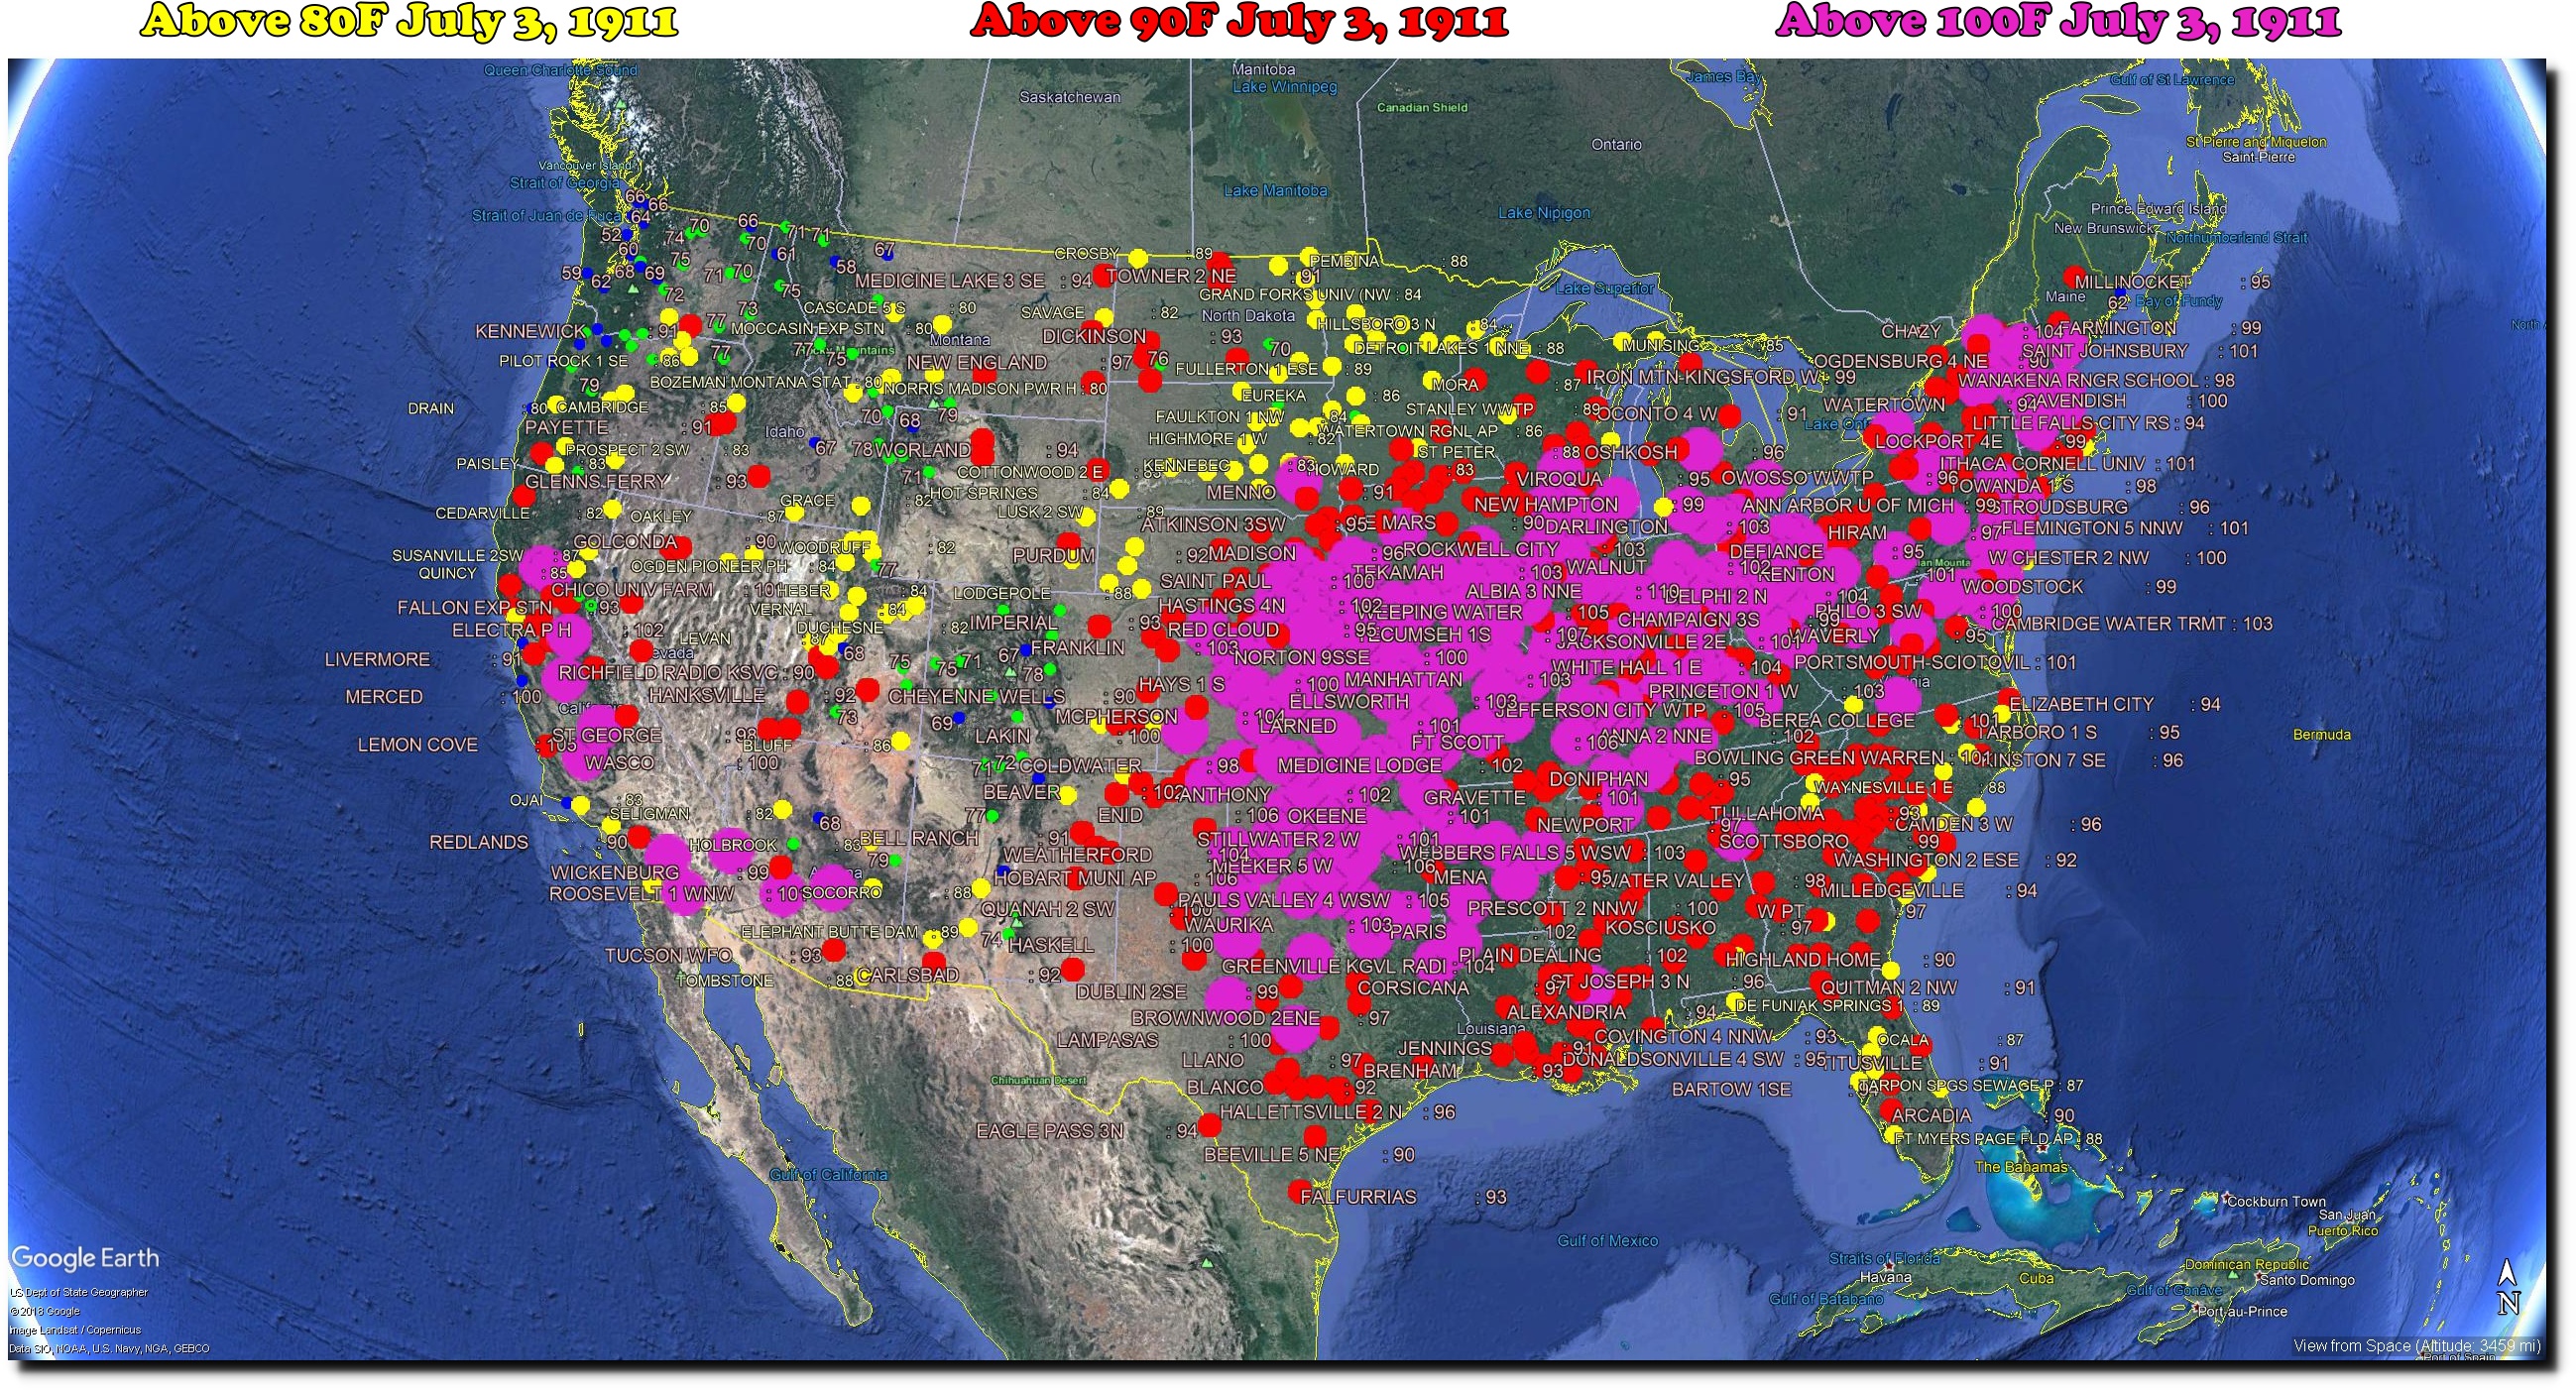


TimesMachine: July 4, 1911 – NYTimes.com

TimesMachine: July 4, 1911 – NYTimes.com
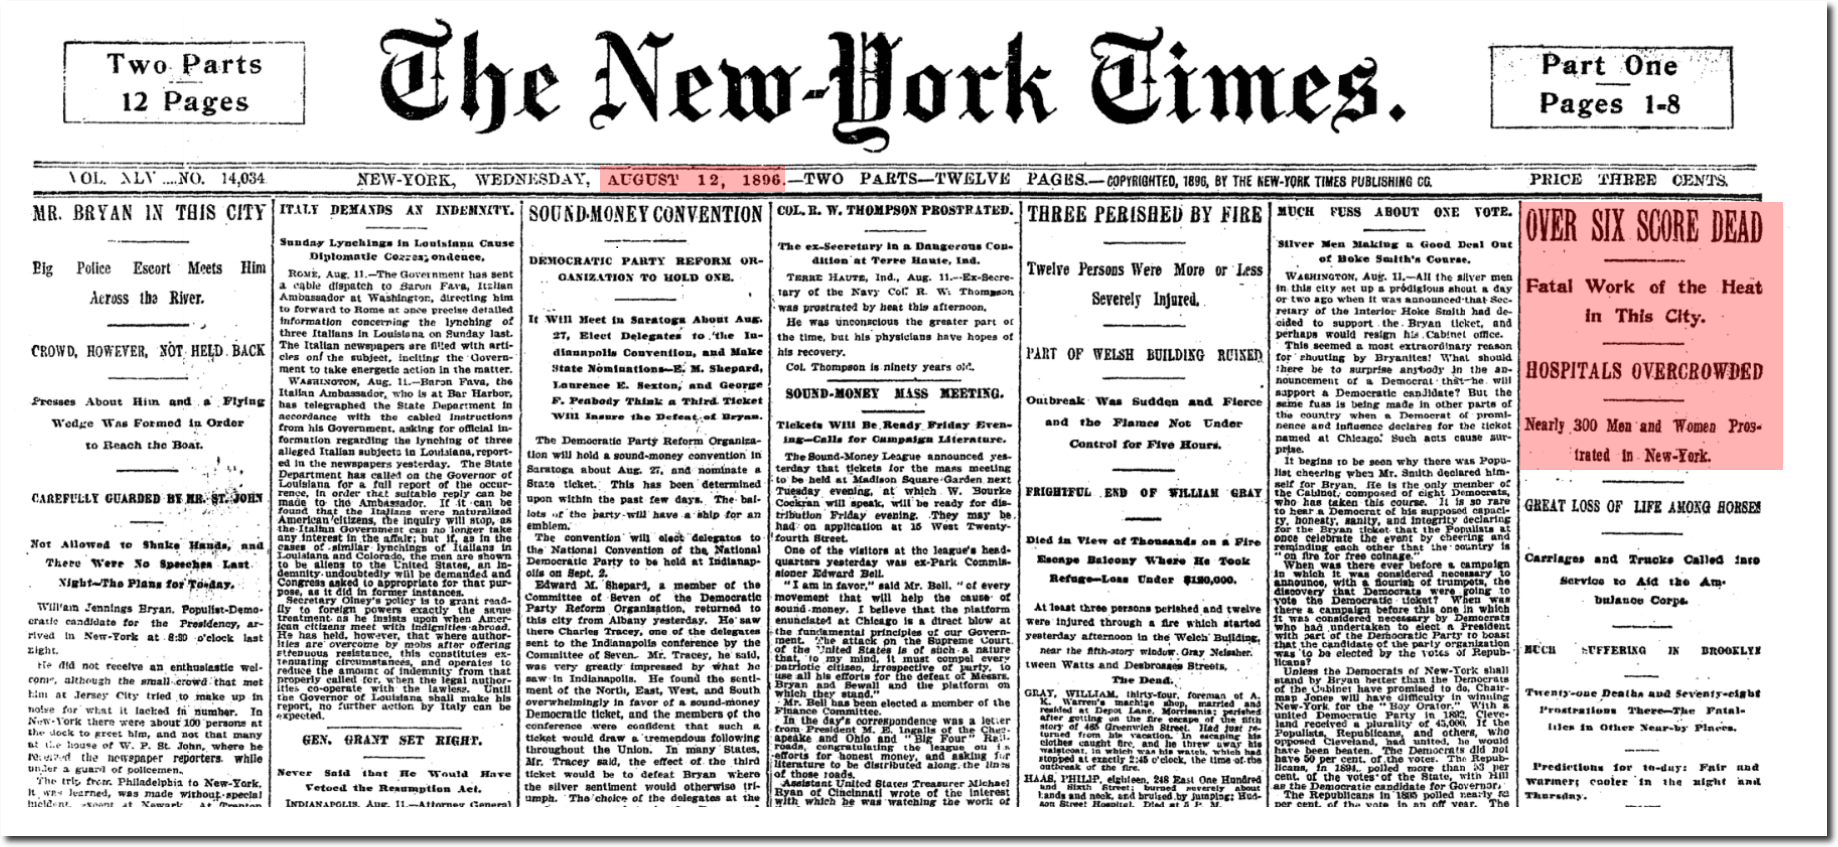
There have been many other terrible heatwaves in New York.
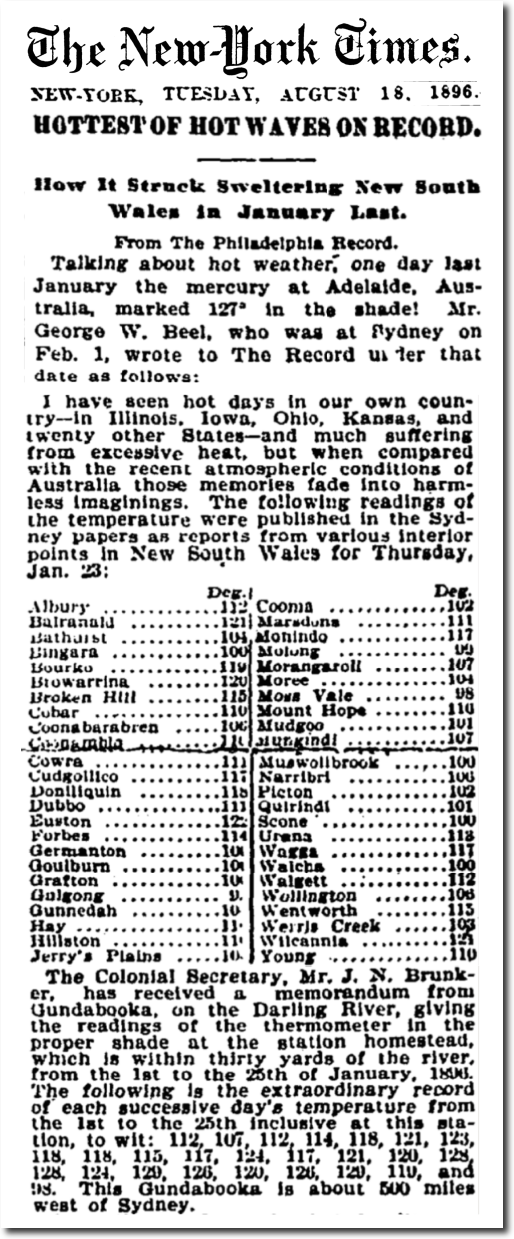
1896
Australia also had their worst heatwave on record during January of 1896.
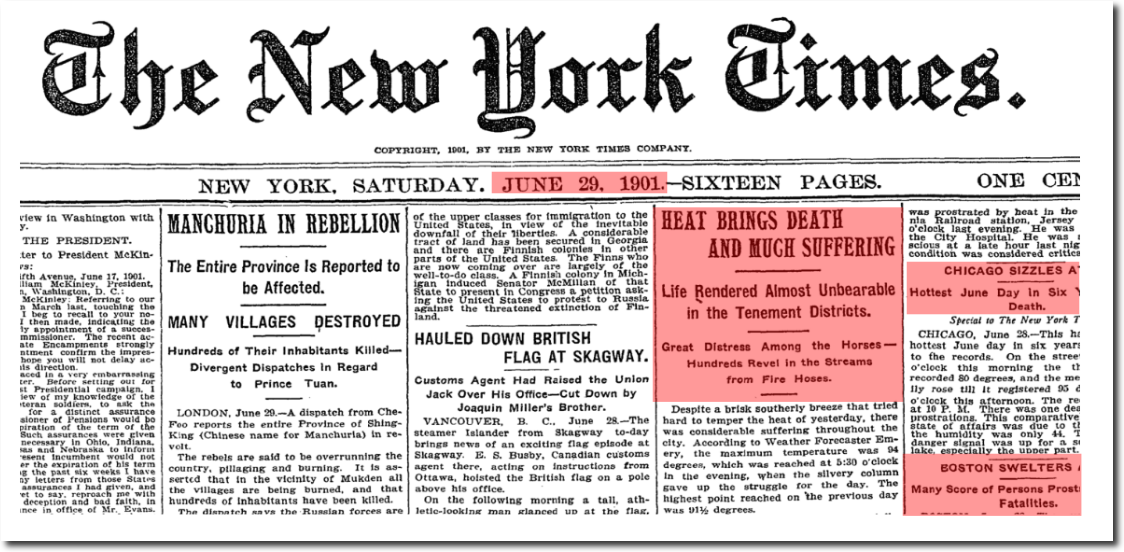
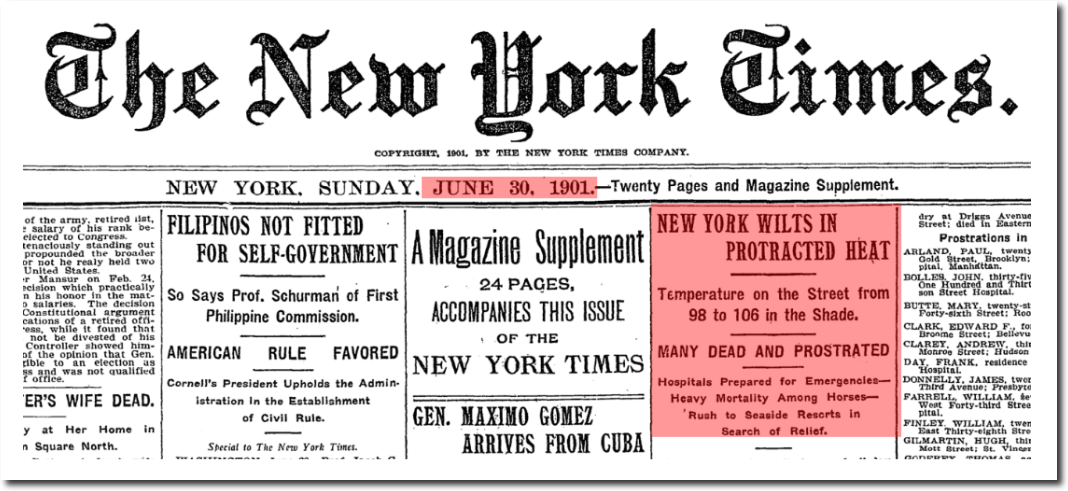
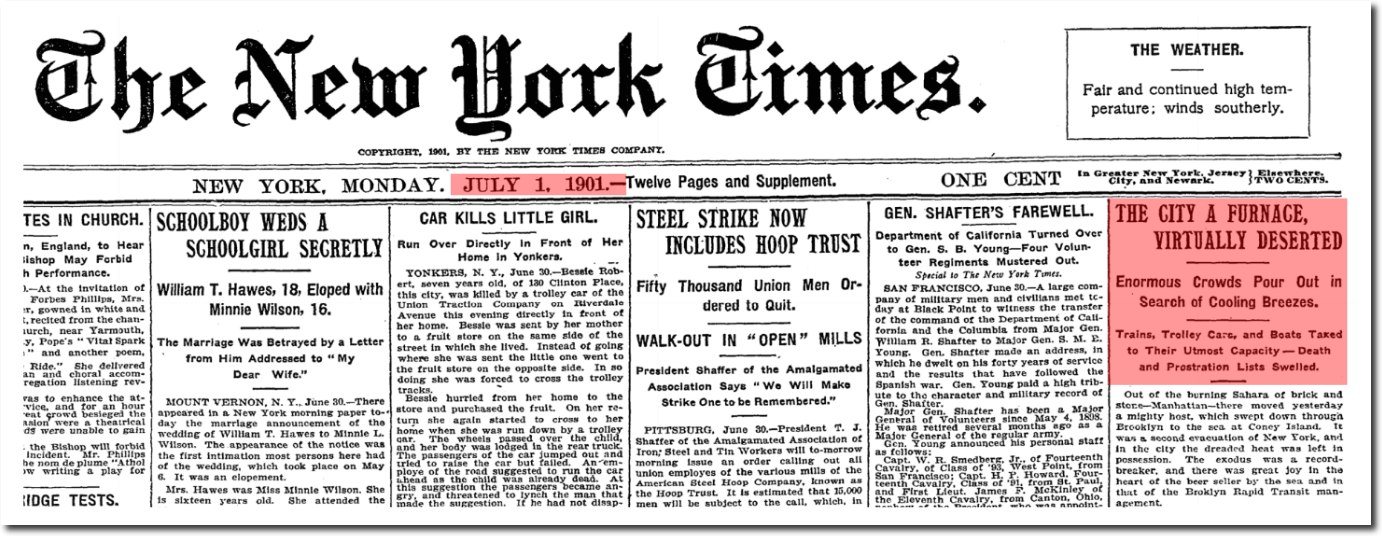
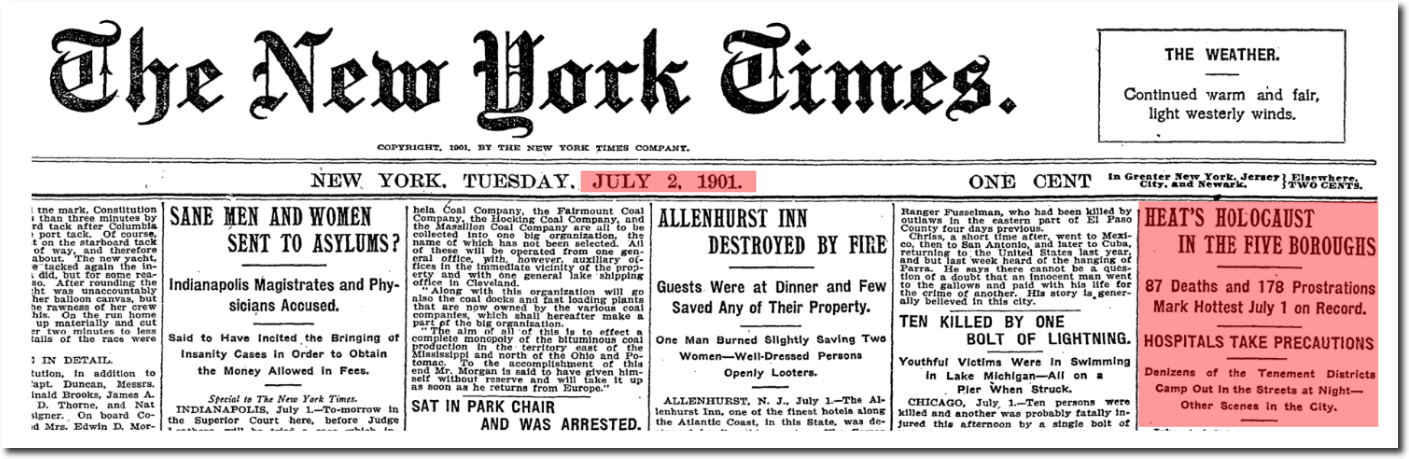
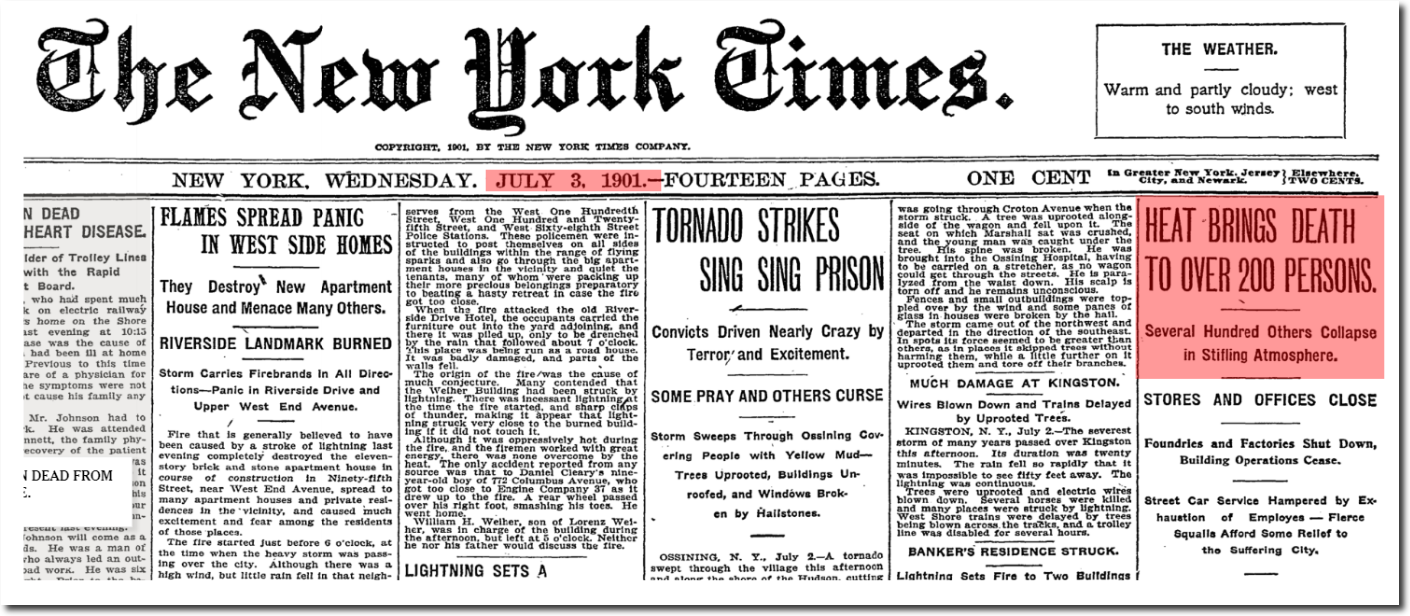
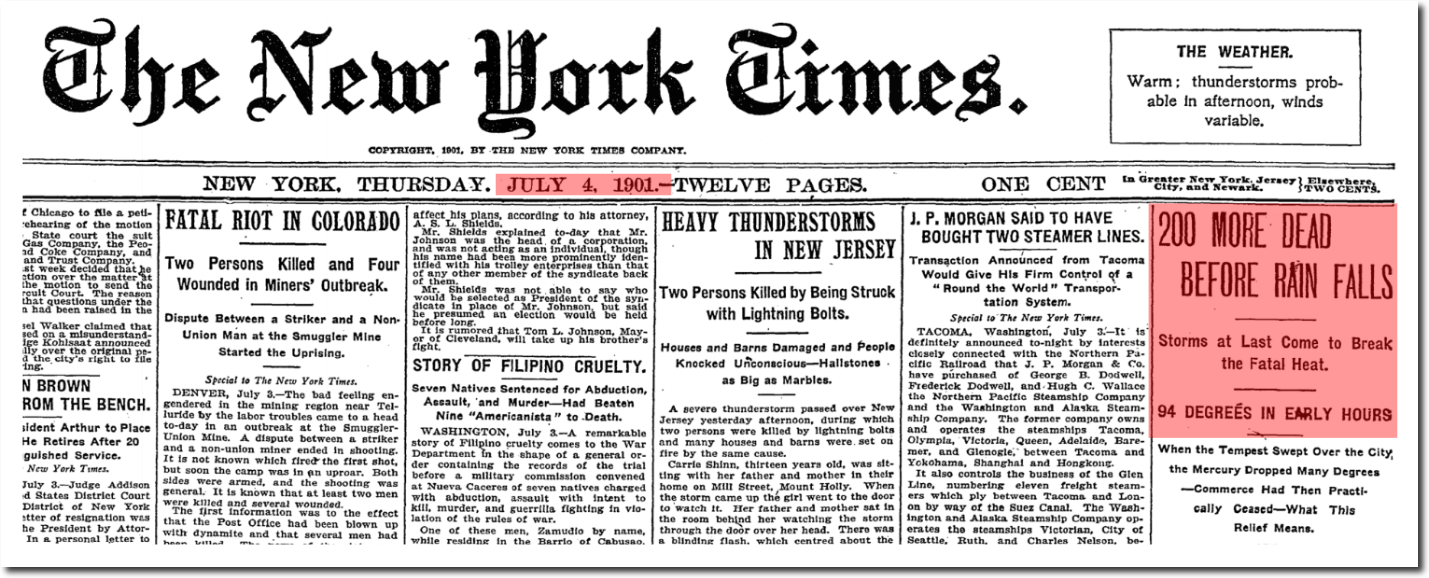
The 1901 heatwave killed thousands of people.
The 1911 heatwave killed thousands of people in New England and across the country.
The New York Times claims about heat are completely fraudulent, and their claims about cold and snow are equally as bad. In 2006, they announced the “endless summer.”
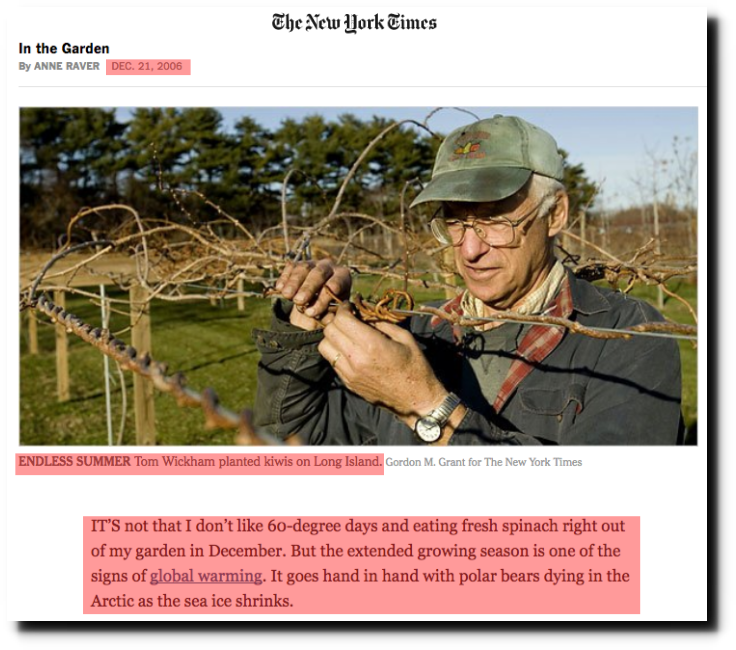
With Warmer Weather, Different Decisions to Make – The New York Times
The Washington Post predicted seven years ago that cherry blossoms would start blooming in January.
Could cherry blossoms one day be blooming in winter? – The Washington Post
January temperatures have been declining in the Northeastern US since the 19th century.
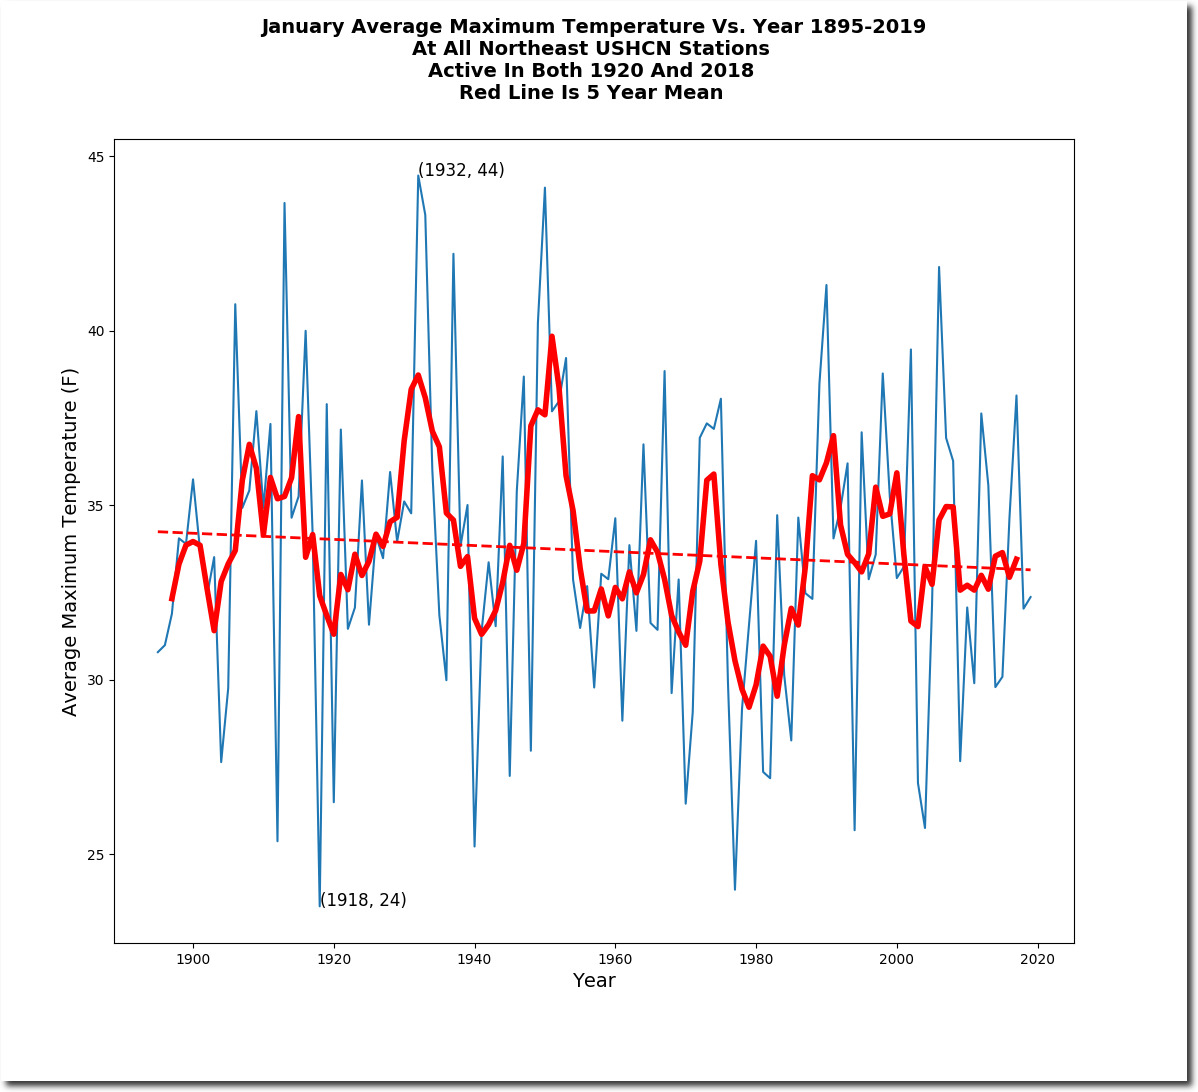
The New York Times cherry-picked a warm year which went against the trend, and declared it to be science.

The percentage of cold January nights has been increasing.

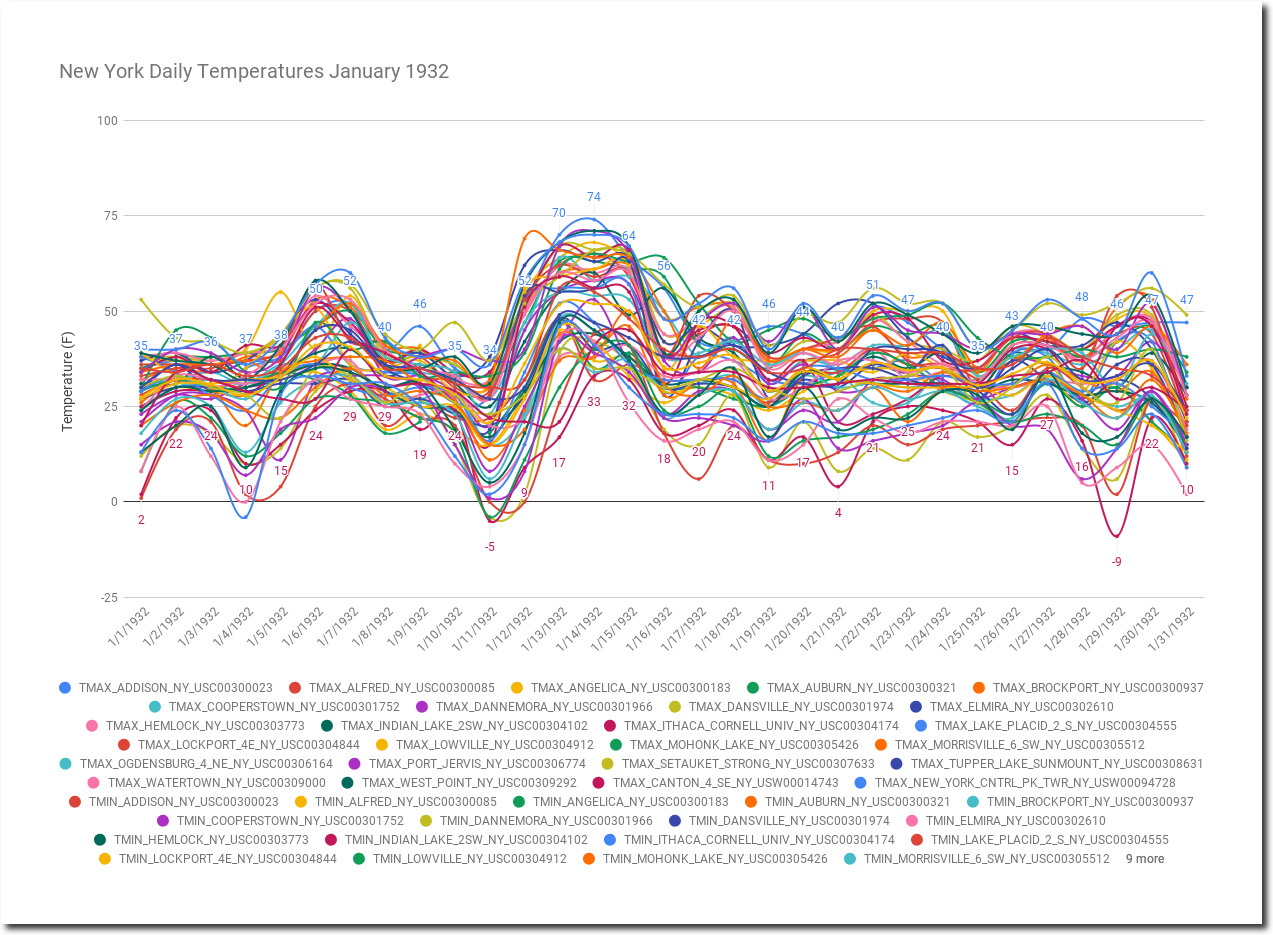
The warmest January in the Northeast was 1932, when the Lake Placid Winter Olympics almost had to be cancelled due to no snow.
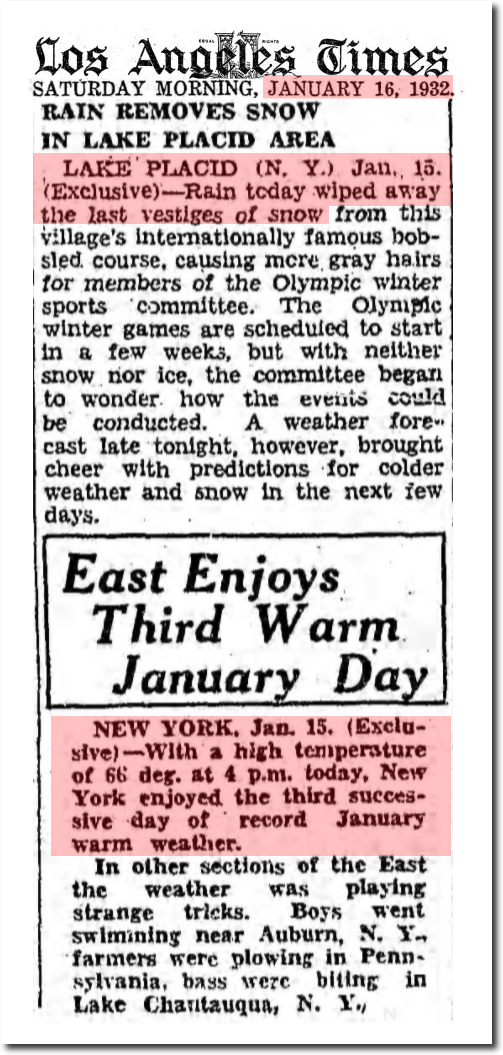
16 Jan 1932, Page 1 – The Los Angeles Times
Addison, New York was 74 degrees on January 14, 1932.
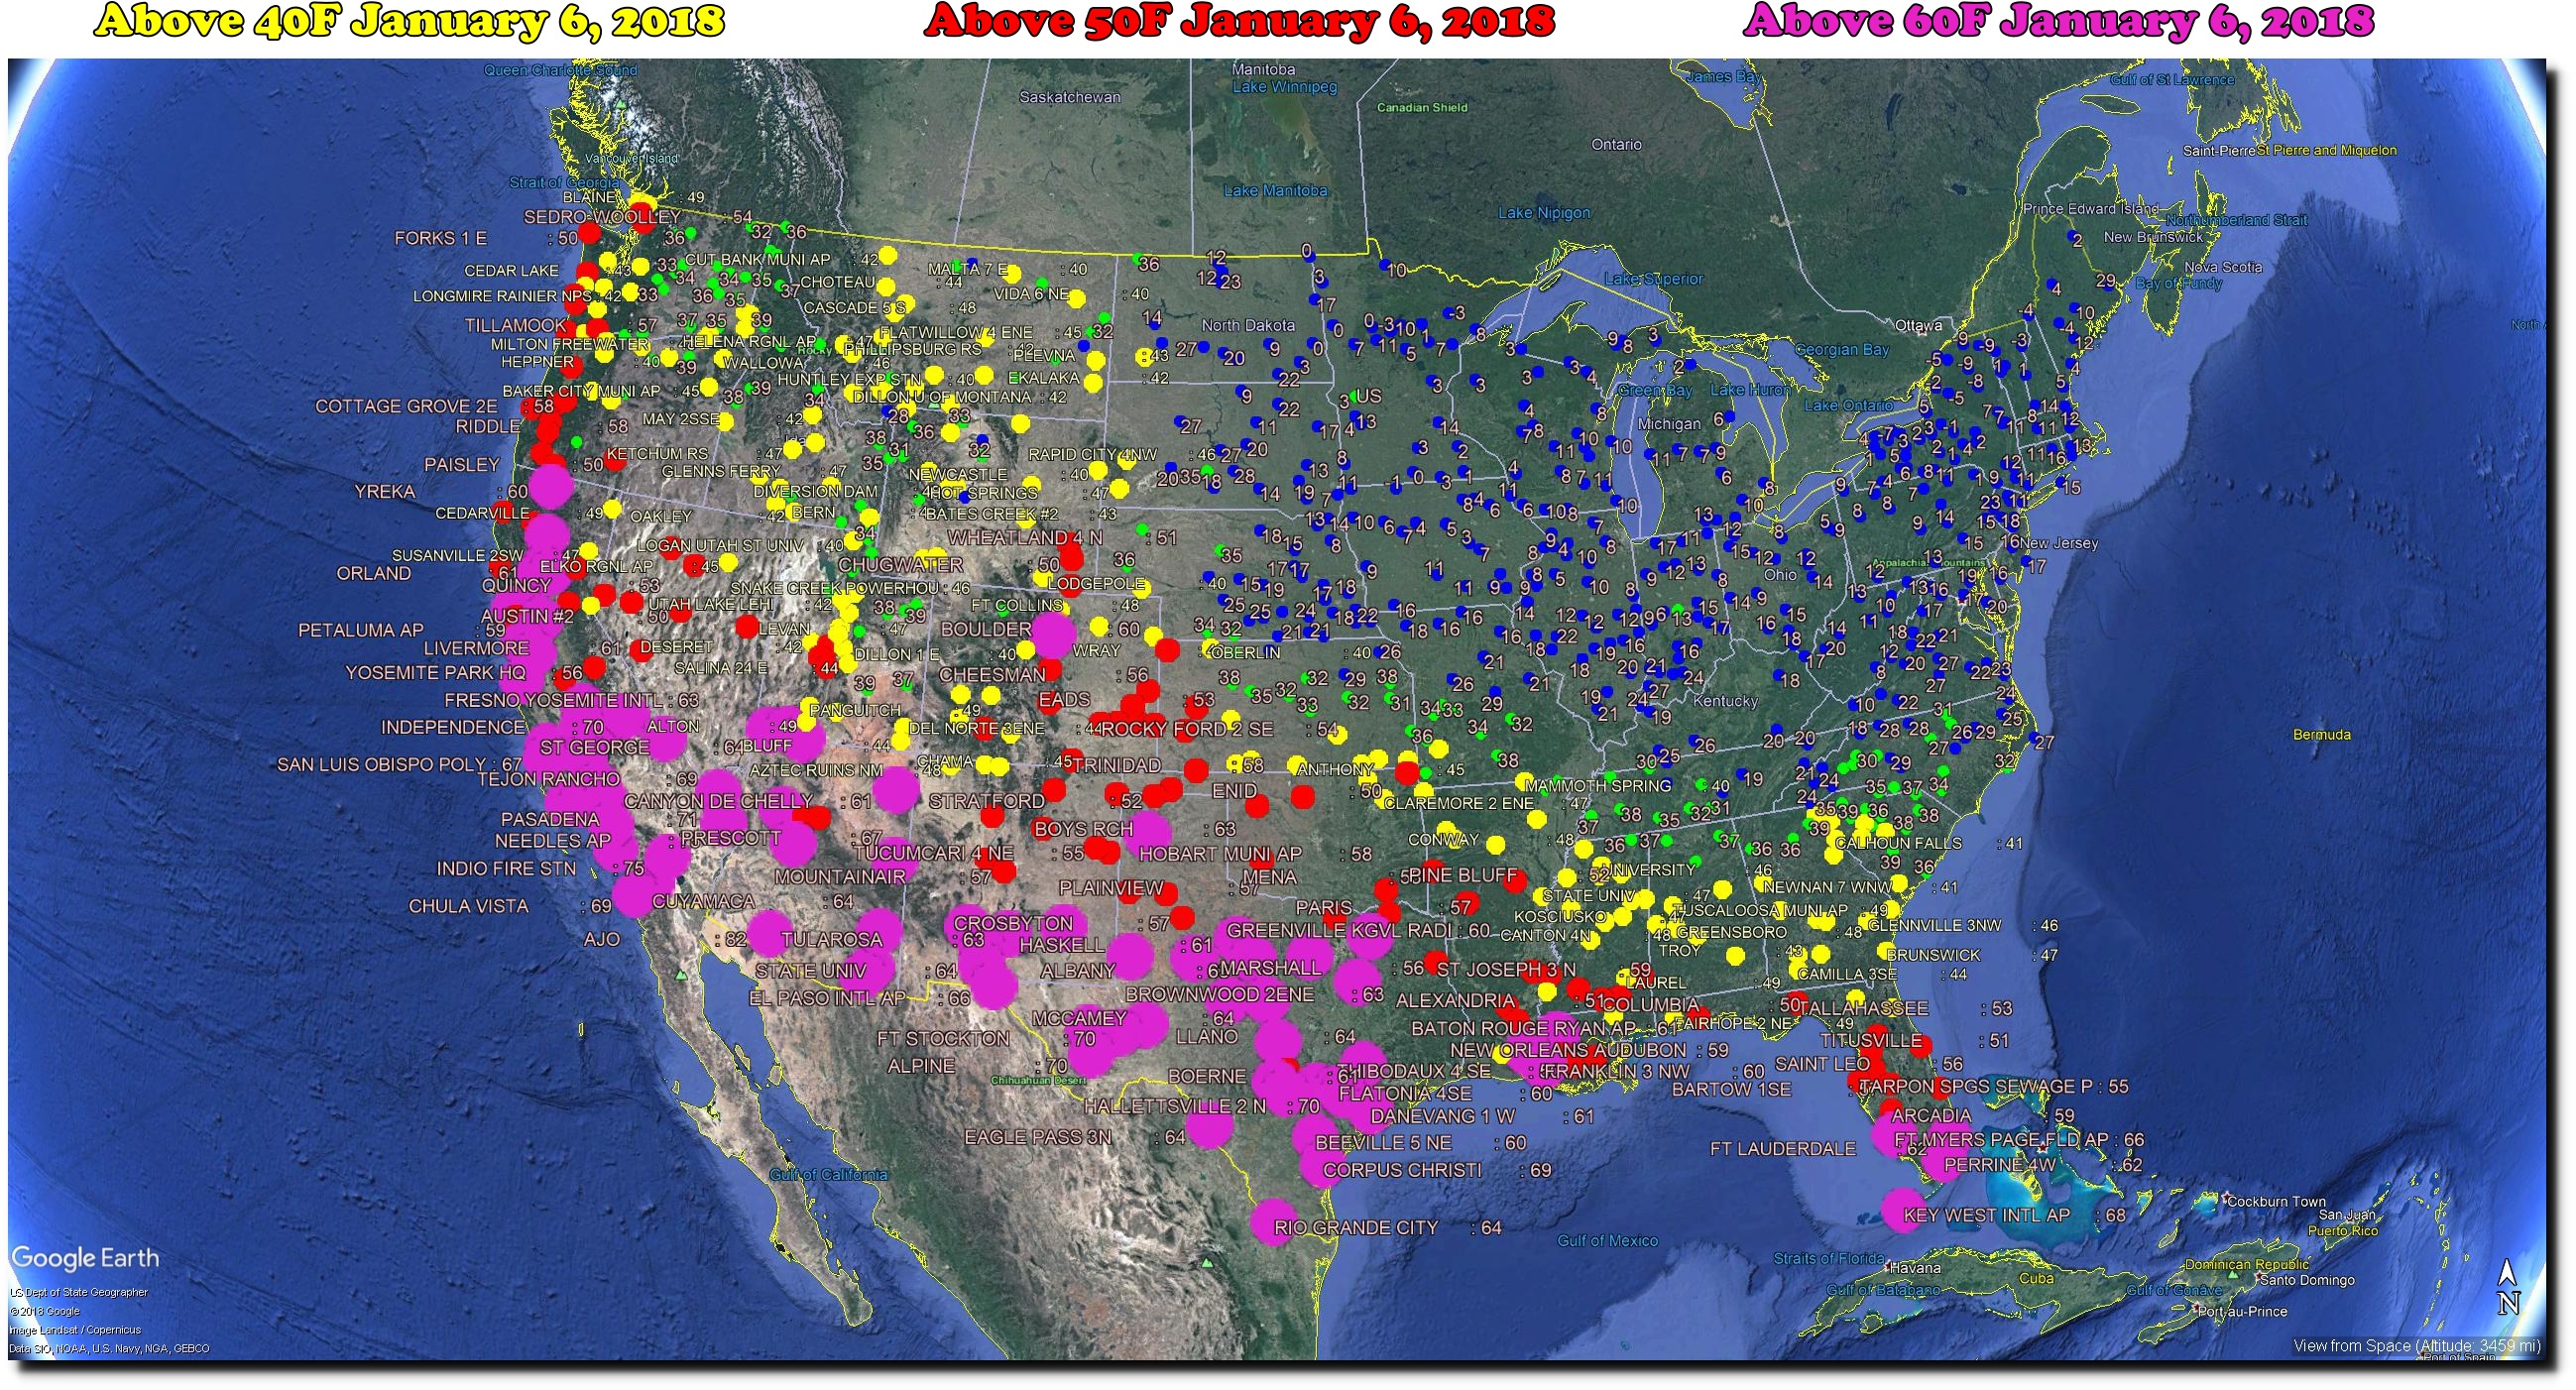
By contrast, January 6, 2018 was the ninth coldest afternoon on record in the Northeast. I flew to DC that day. It was unbelievably cold in the east. The average maximum temperature in the Northeast that day was 7.5F (-14C.)
Evil fossil fuels were keeping the Midwest running, as the windmills were motionless.
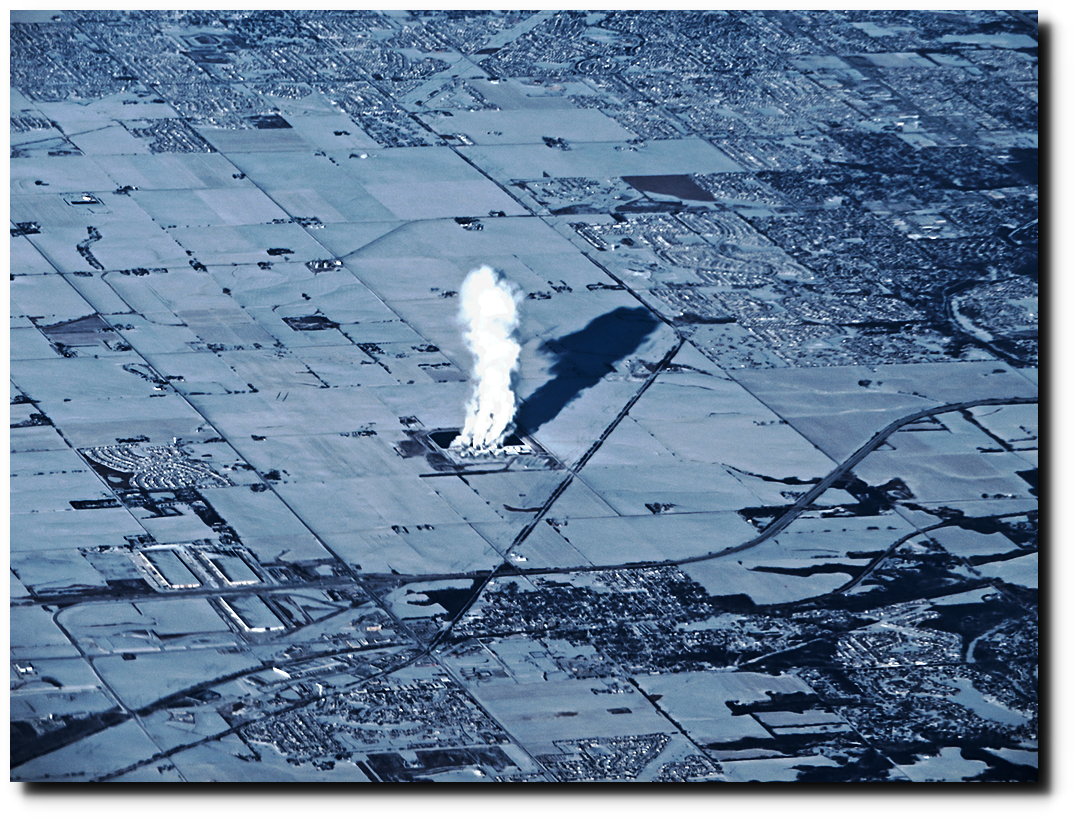

Lots of ice around Chicago and southern Lake Michigan.

Lake Erie

The Potomac was frozen solid.

I nearly got frostbite on my face due to the high winds and very cold temperatures in DC on the evening of January 6, 2018. It didn’t feel like “endless summer.”

I found this leaf frozen into thick ice in the reflecting pool in front of the US Capitol on January 7, 2018. People were playing hockey right in front of the Capitol Building.


Summers are not getting hotter in the Northeast. Winters are not getting warmer in the Northeast. It is not your imagination – the New York Times is lying about the climate.
Posted in Uncategorized
Leave a comment
Extreme Fraud By The Union Of Concerned Scientists
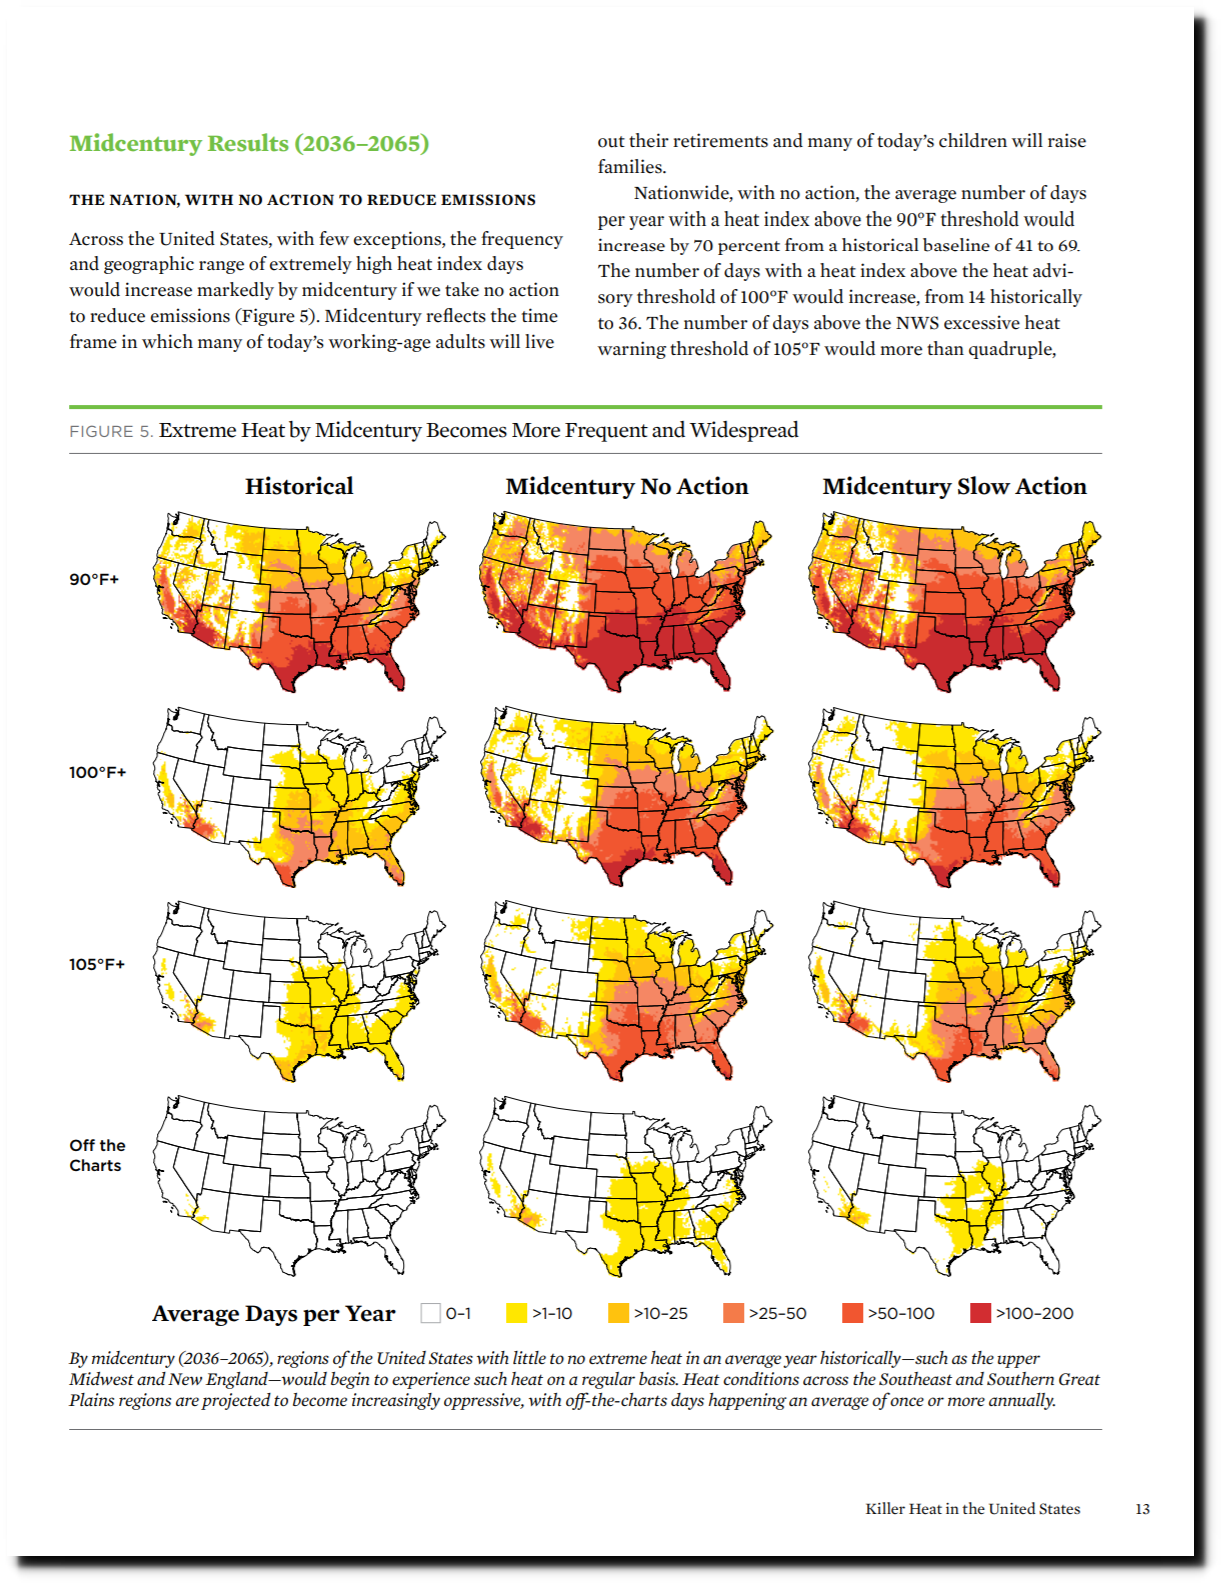
During the hottest week of the year, the Union of Concerned Scientists has warned that we are all going to burn up in future summers, unless we take action to reduce emissions.
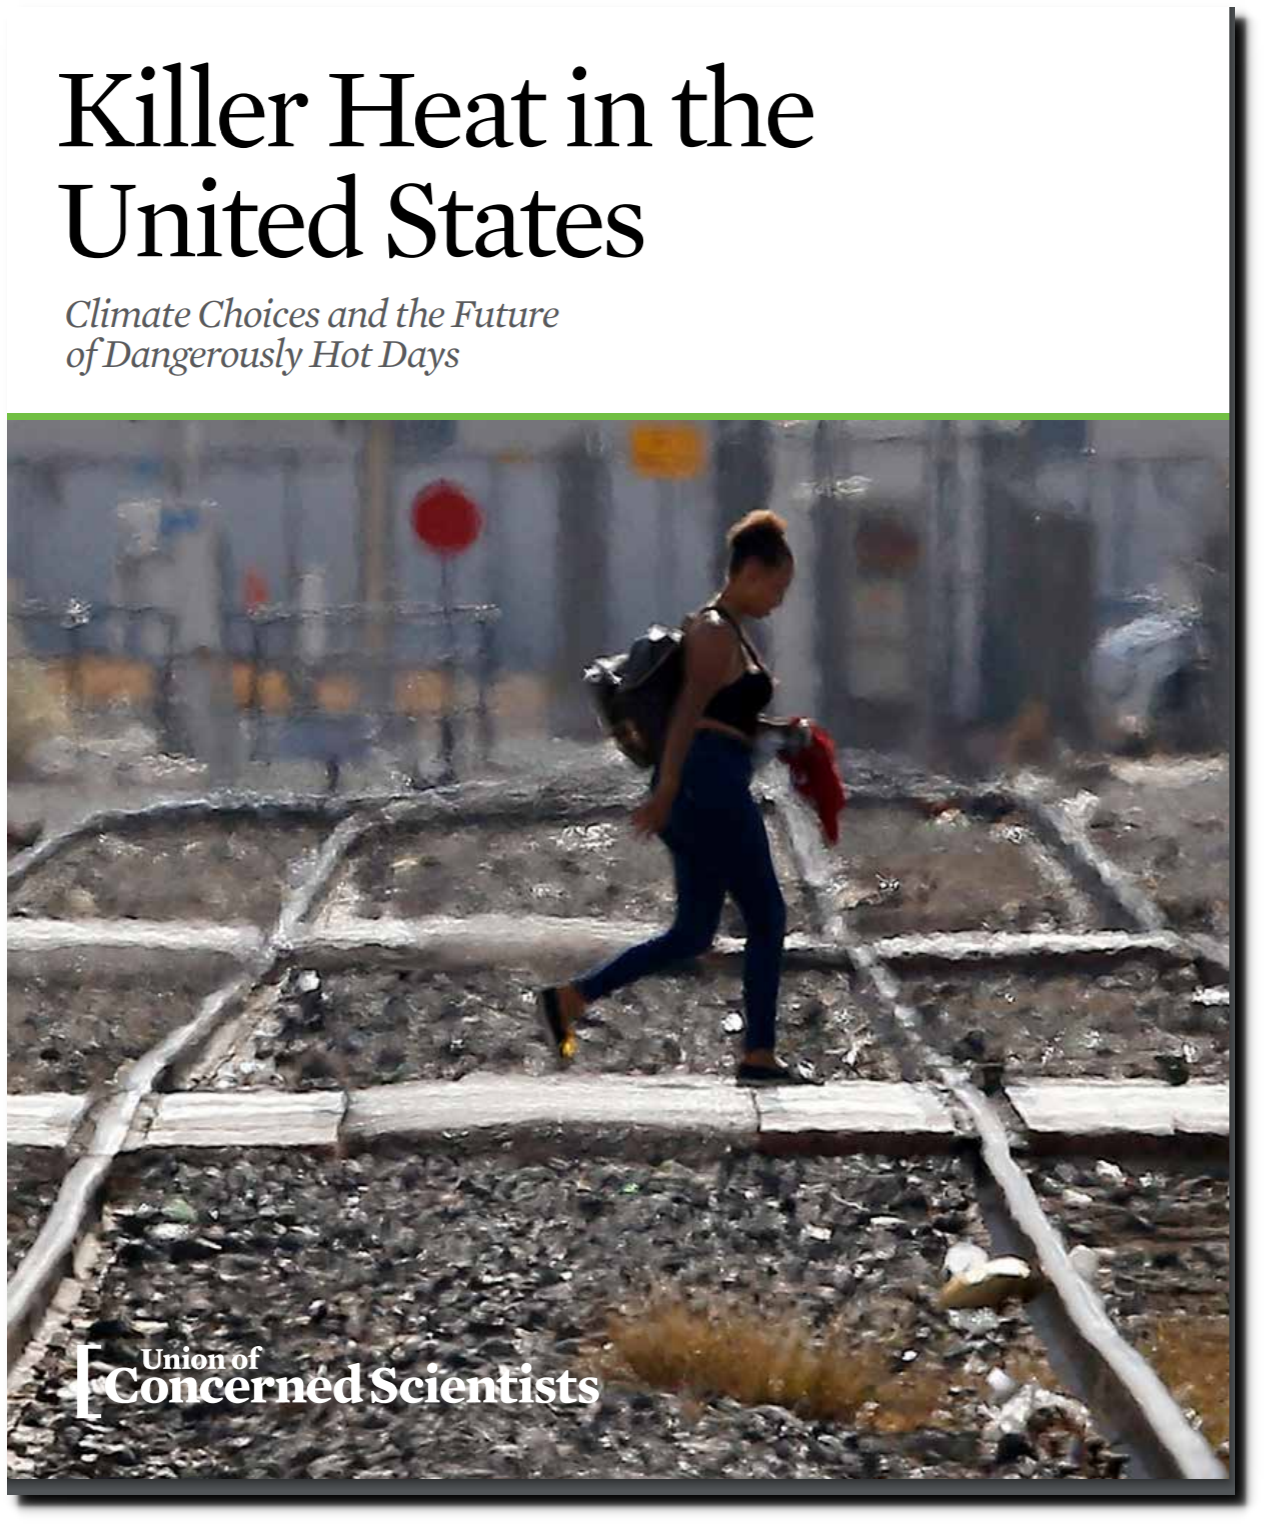
They generated this chart, with a bold statement and no uncertainty :
TABLE 1. Extreme Heat Will Become More Frequent and More Severe in All Regions of the Country
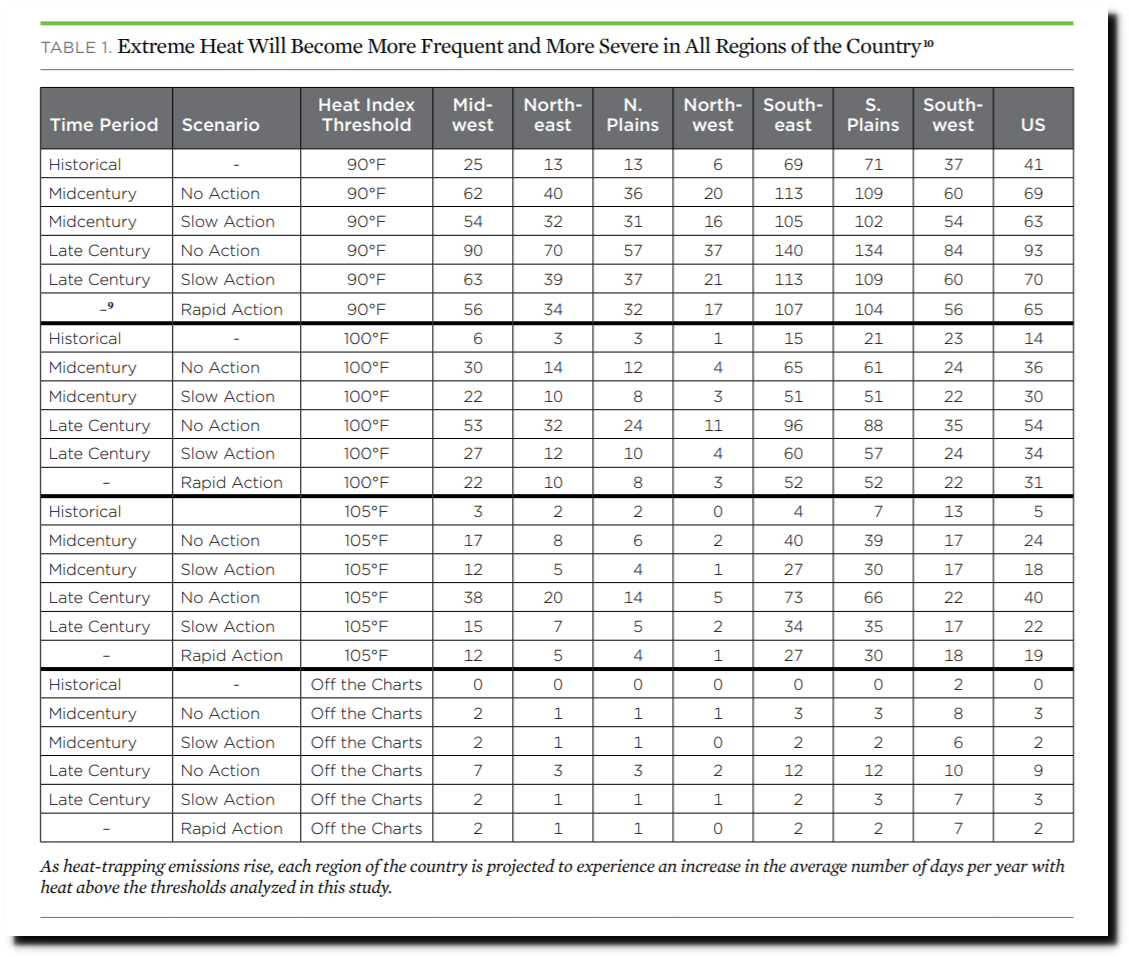
killer-heat-analysis-full-report.pdf
Their claim is that hot weather is caused by CO2. Yet The National Climate Assessment shows that hot weather used to be more frequent, extreme and intense in the US, and that it has declined sharply over the past 80 years as CO2 has increased.

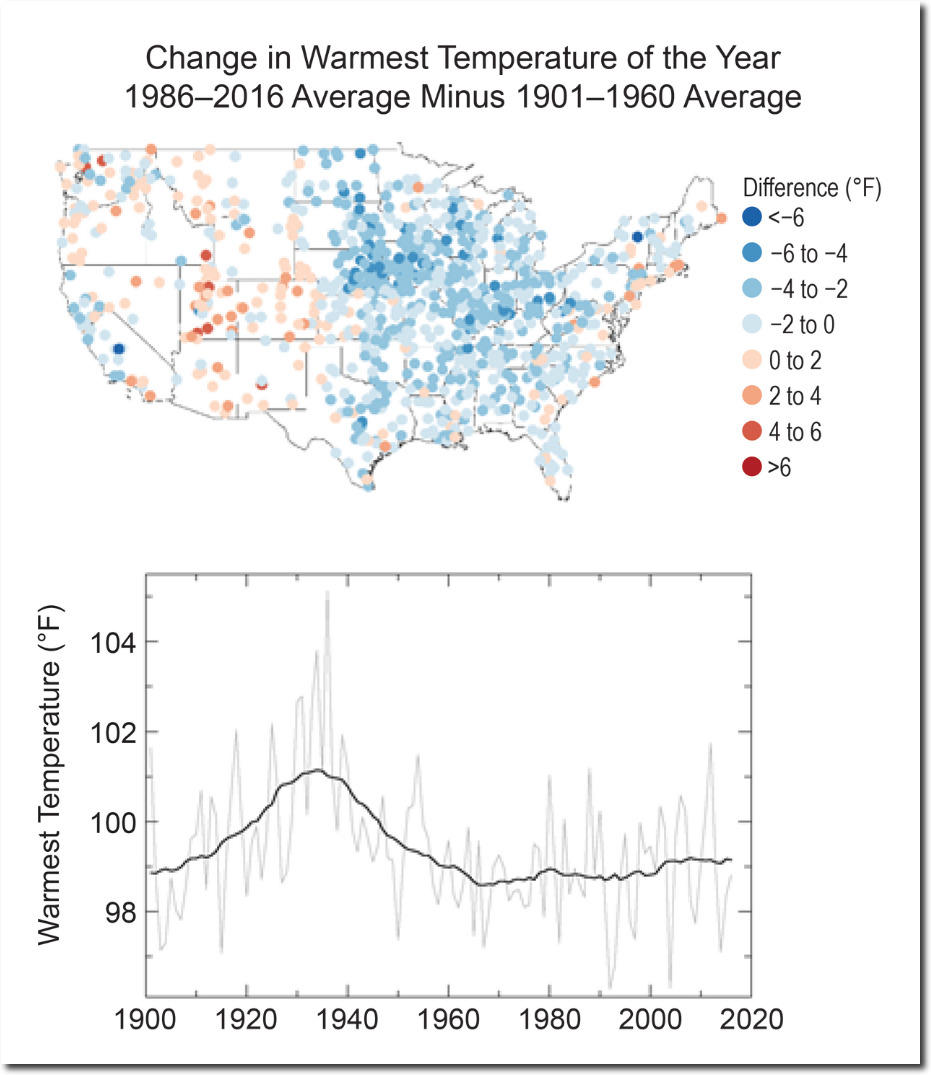
Temperature Changes in the United States – Climate Science Special Report
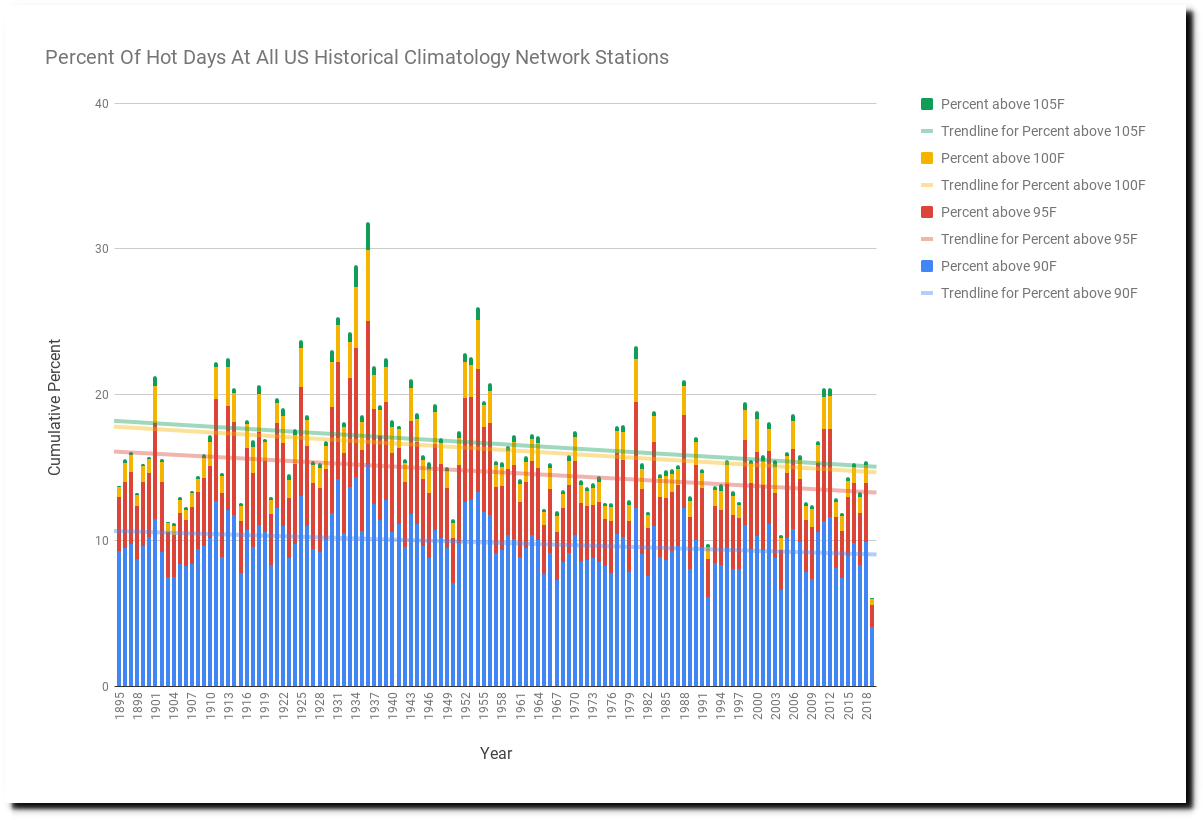
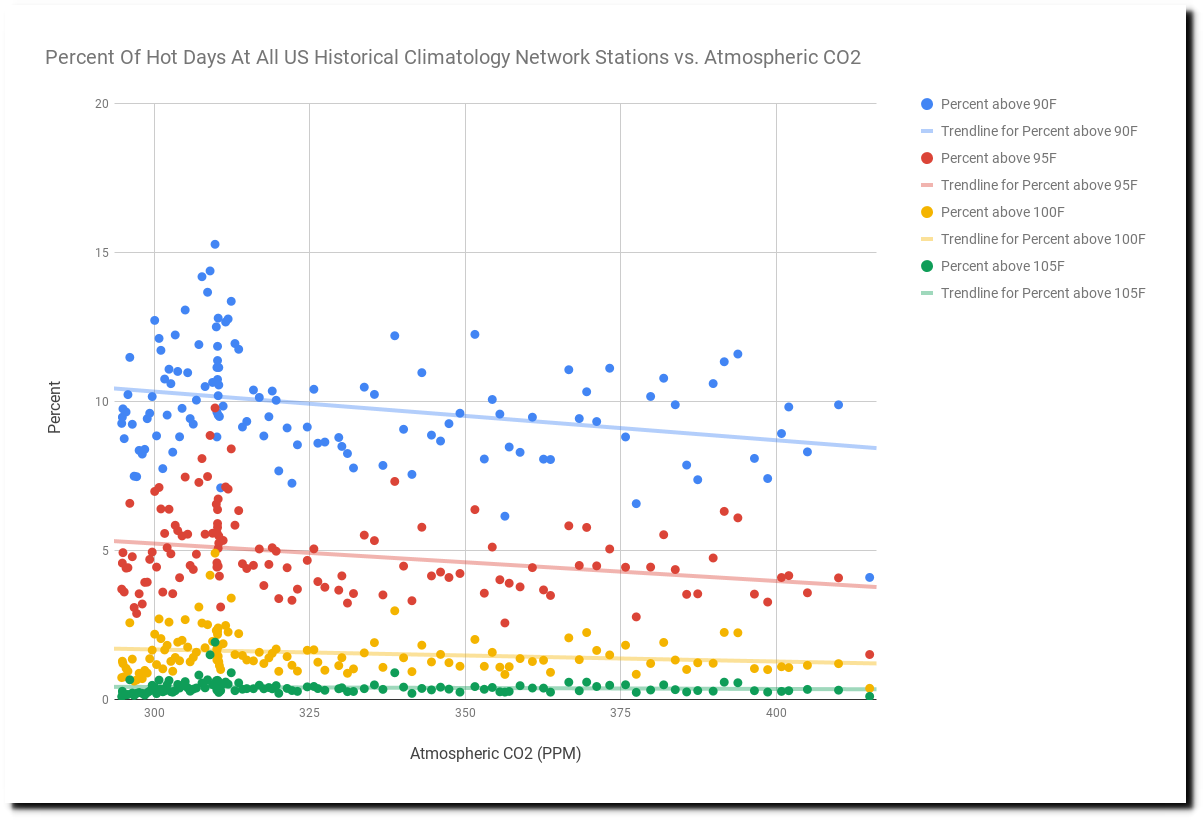
Data from NOAA shows unequivocally that the frequency of hot days has declined in the US as CO2 has increased.
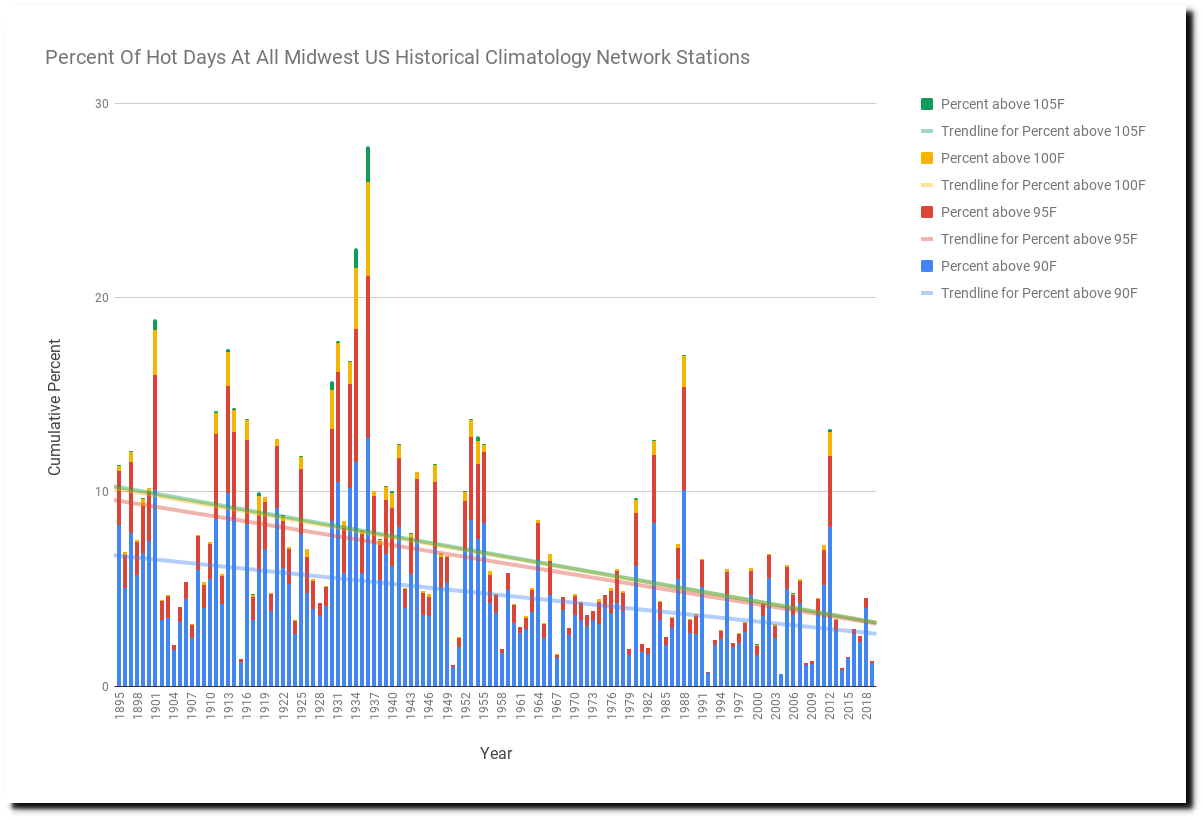
Midwest heat has declined sharply.
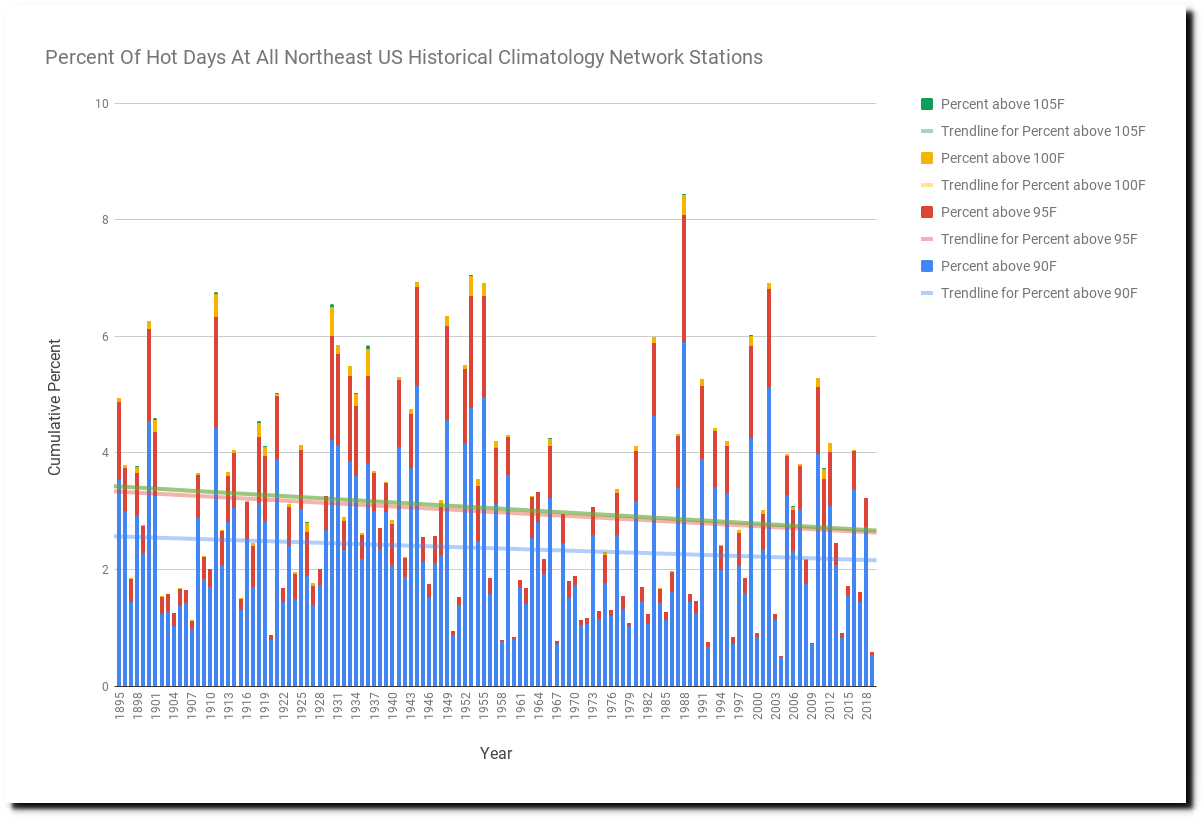
Northeast heat has declined.
Northern Plains heat has declined sharply.

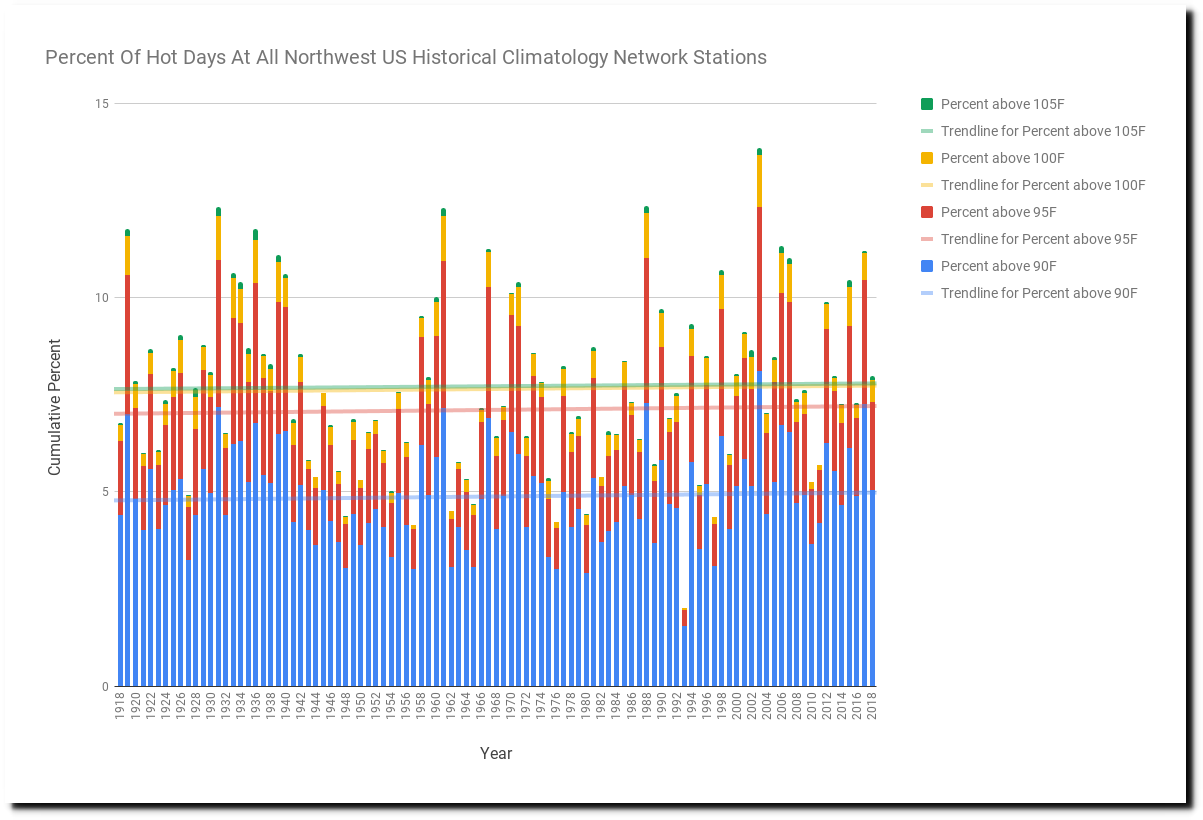
Northwest heat has increased.
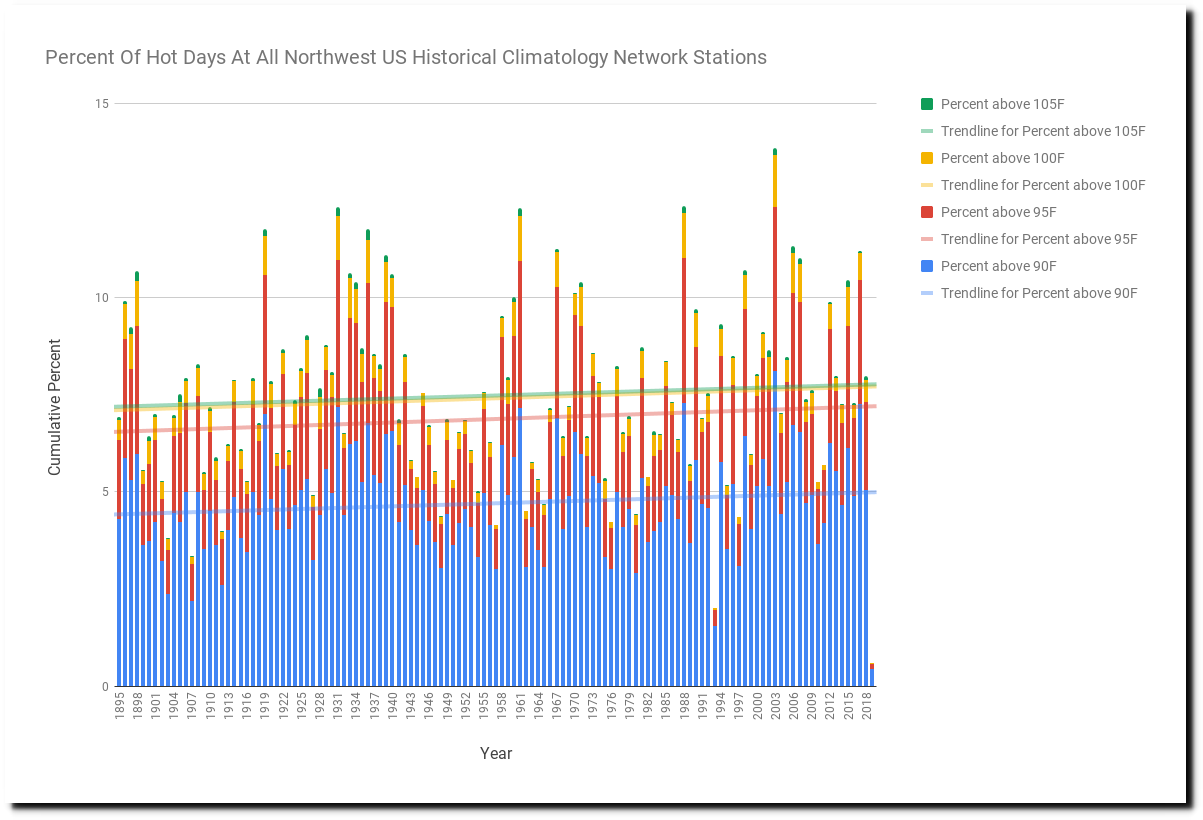
However, most of that increase occurred more than 100 years ago. Over the past century there has been almost no change.
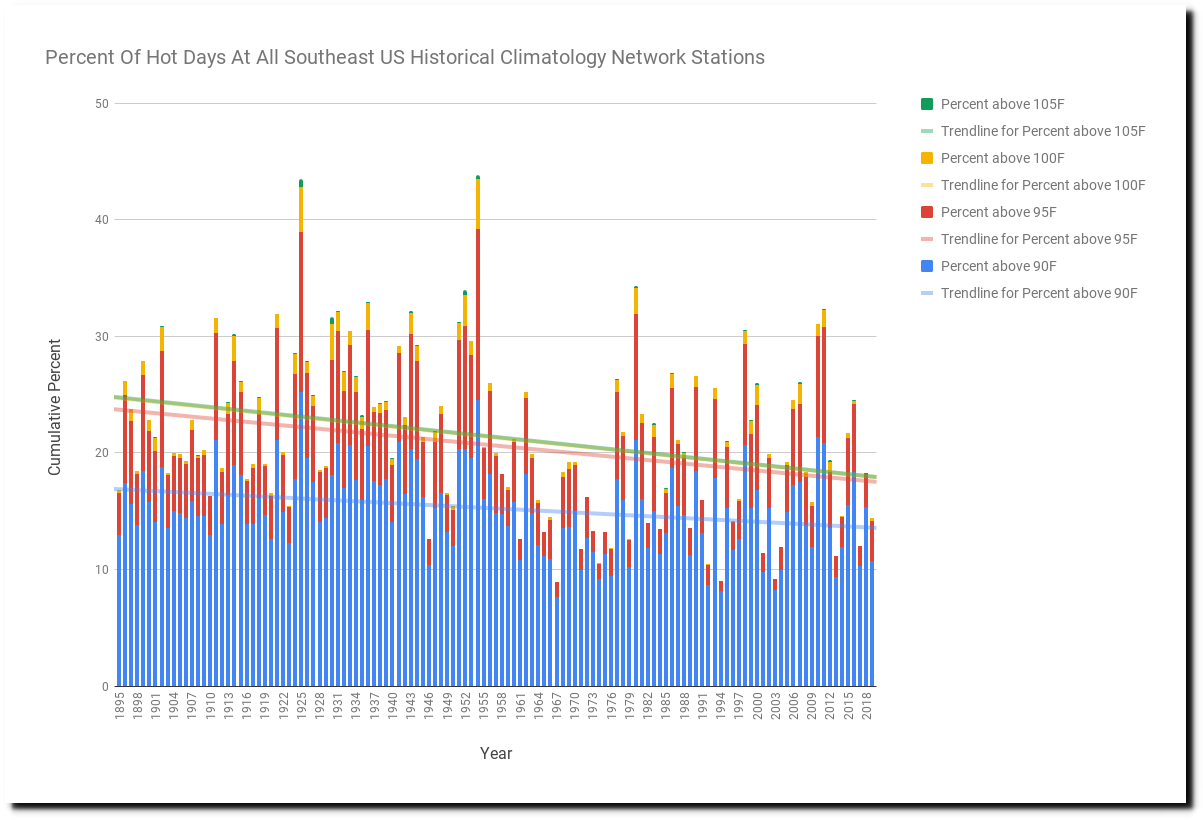
Southeastern US heat has decreased.
Southern Plains heat has decreased.

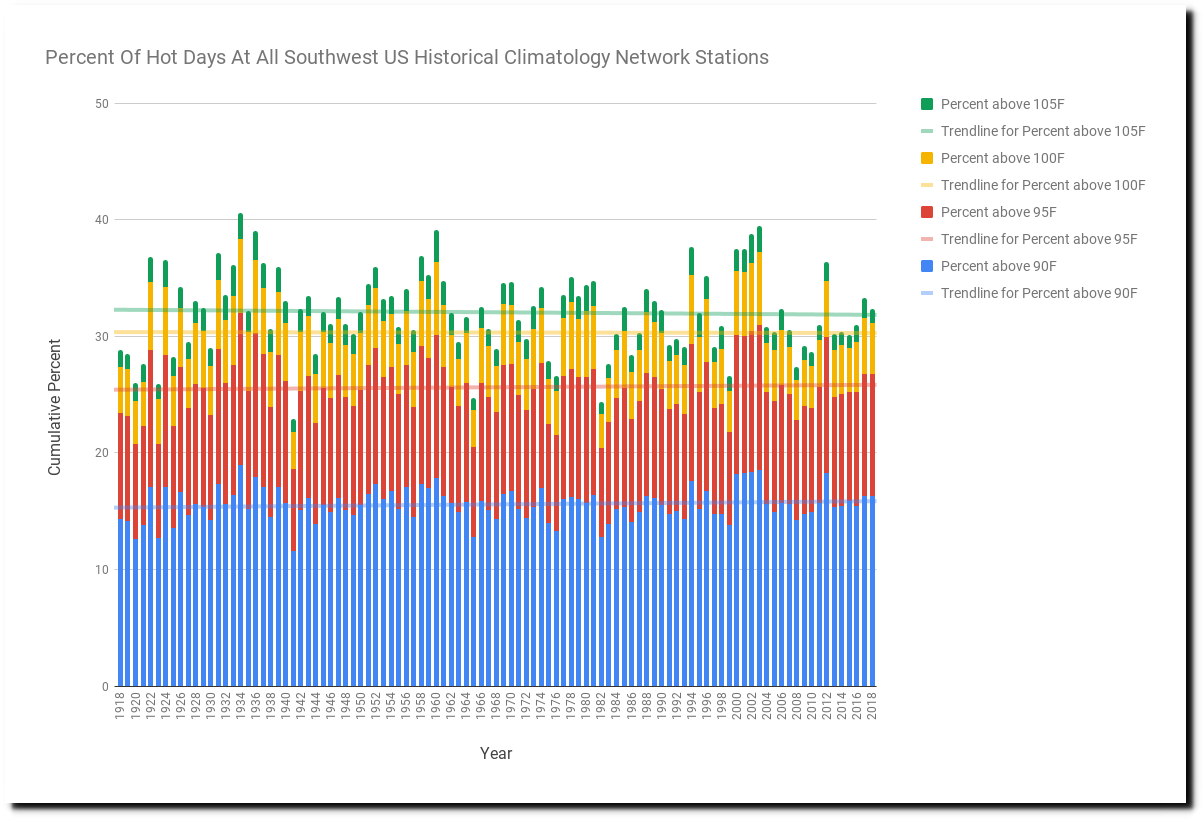
Southwest heat has increased.
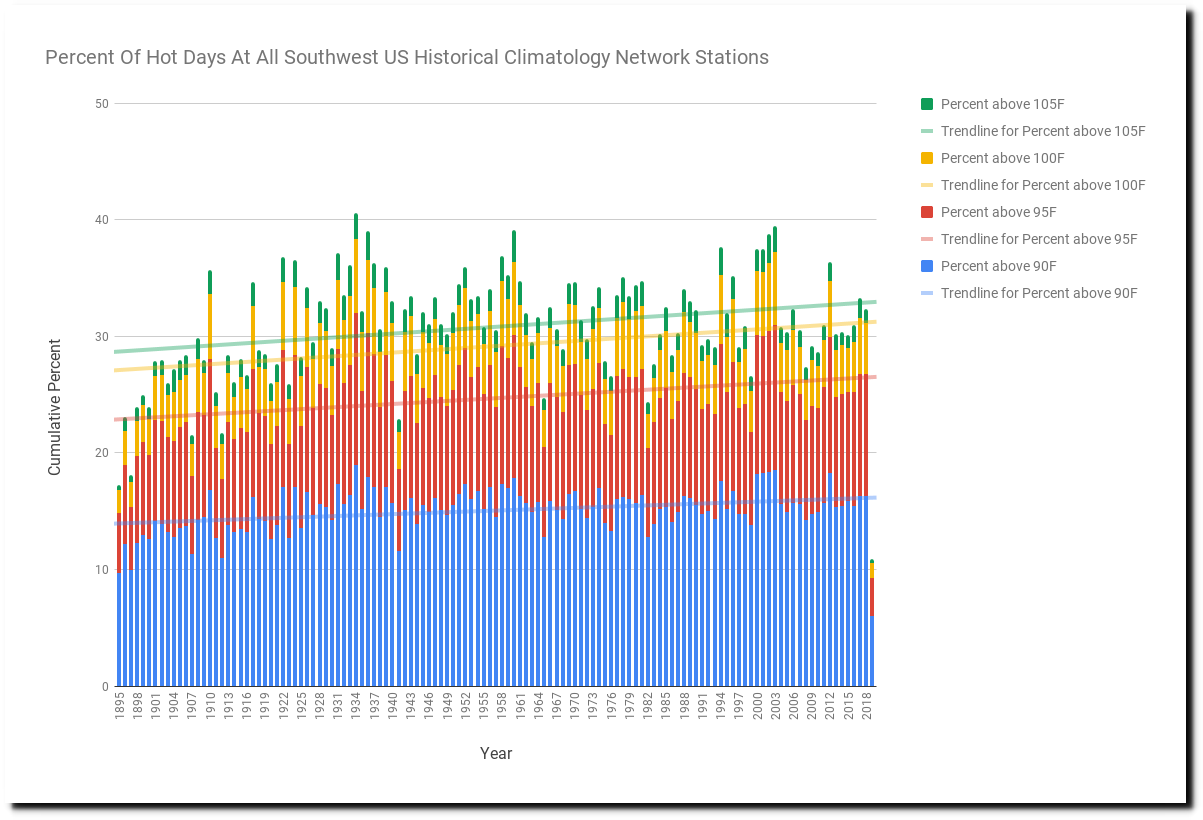
However, all of that increase occurred more than 100 years ago. Over the past century there has been no change.
All of the bold claims in the UCSUSA special report are baseless, particularly the claim that the US can control CO2 emissions. China is building lots of new coal fired power plants, and even if the US dropped off the face of the earth – CO2 emissions would continue to increase.
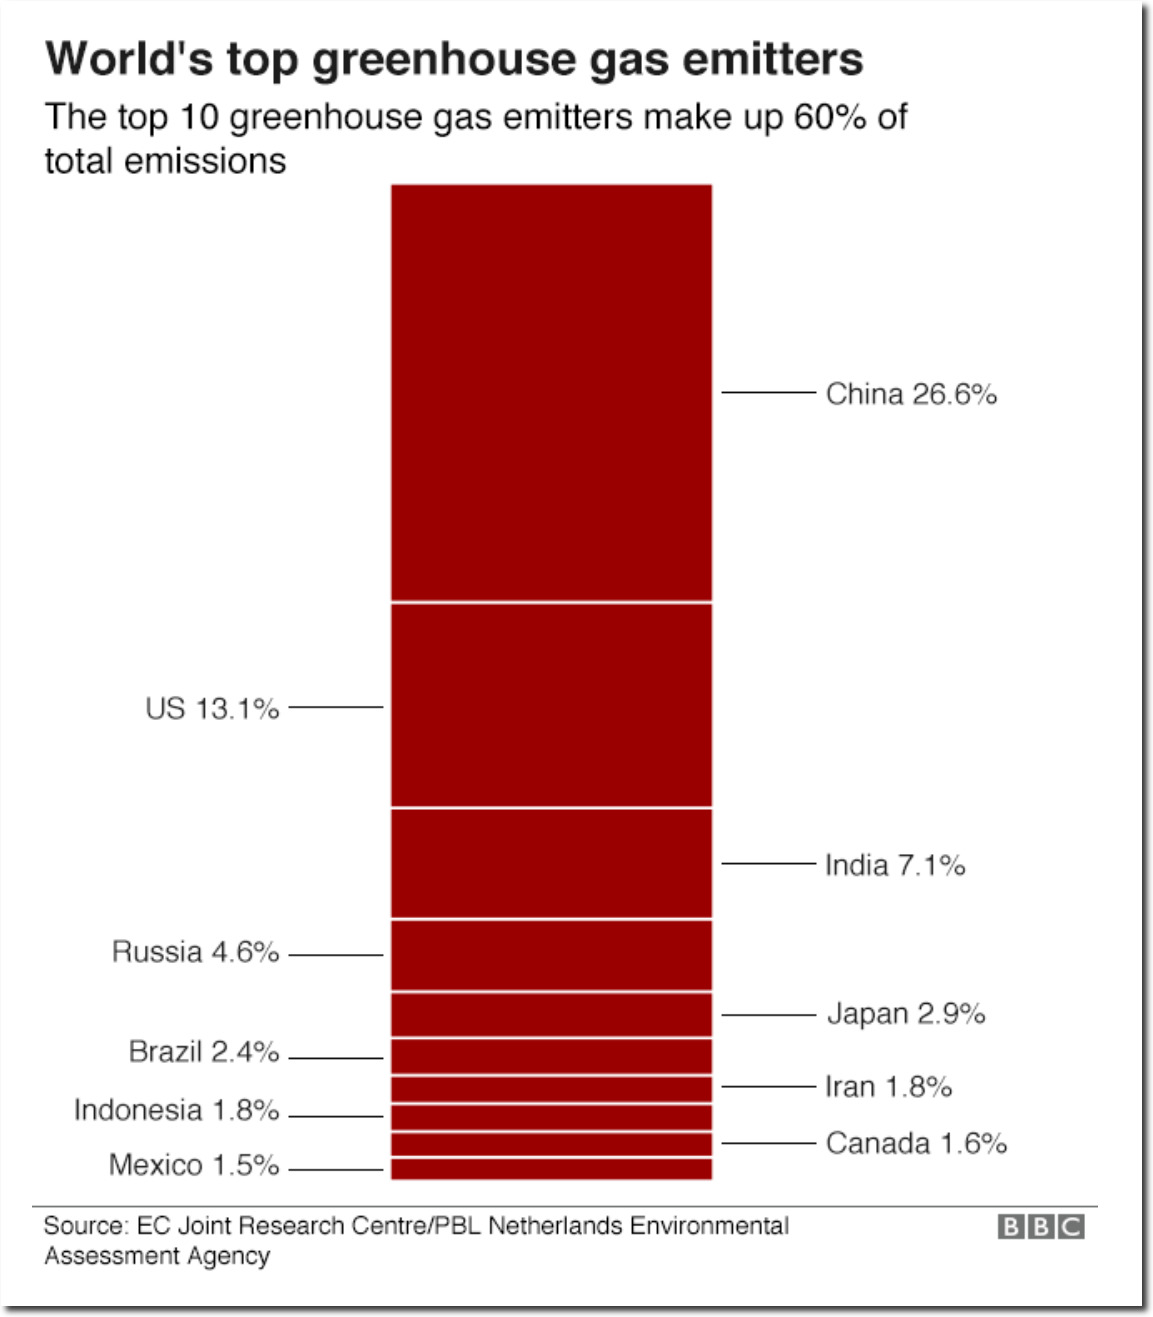
Climate change: Where we are in seven charts and what you can do to help – BBC News
With US emissions declining, China is on target to increase their lead, just as they promised President Obama they would do.
Climate Goals Pledged by China and the U.S. – The New York Times
As Beijing Joins Climate Fight, Chinese Companies Build Coal Plants
Chinese corporations are building or planning to build more than 700 new coal plants at home and around the world, some in countries that today burn little or no coal, according to tallies compiled by Urgewald, an environmental group based in Berlin. Many of the plants are in China, but by capacity, roughly a fifth of these new coal power stations are in other countries.
Over all, 1,600 coal plants are planned or under construction in 62 countries, according to Urgewald’s tally, which uses data from the Global Coal Plant Tracker portal. The new plants would expand the world’s coal-fired power capacity by 43 percent. The fleet of new coal plants would make it virtually impossible to meet the goals set in the Paris climate accord

As Beijing Joins Climate Fight, Chinese Companies Build Coal Plants – The New York Times
“Climate action” has no impact on either CO2 levels or the climate.
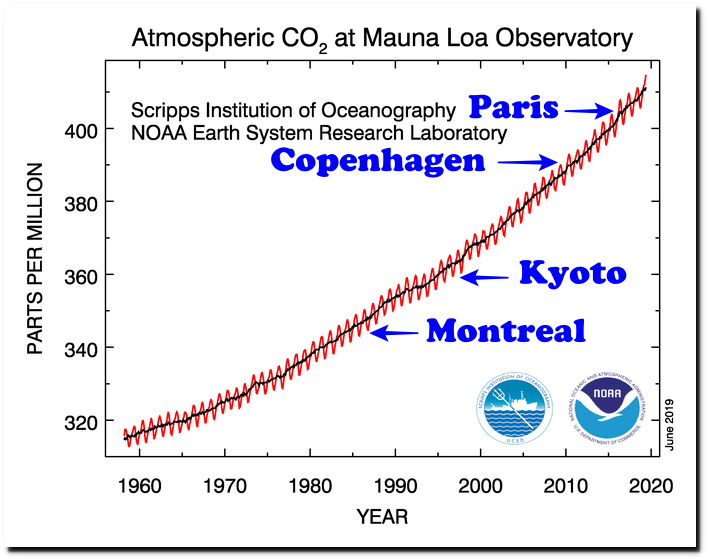
ESRL Global Monitoring Division – Global Greenhouse Gas Reference Network
So who are the people behind this fraudulent study? They are defending science budgets and relying on feelings rather than data.
Rachel Licker works to defend climate science budgets and programs.

Kristy Dahl : Feeling Blue About Climate Change? You’re Not Alone.
It’s been a tough year for those of us in the climate change community. Each week has seemed to bring either a fresh report reminding us of how precious little time we have left to try to turn this ship around or a disaster that has climate change’s fingerprints all over it.

Posted in Uncategorized
Leave a comment
Declining Heat In France
The graph below plots the average daily maximum temperature at all French GHCN stations in the northern hemisphere, for every summer day since 1895. The hottest day was July 28, 1947, which averaged 98F (37C.)
This year’s heatwave (so far) was nowhere near as hot as 2003, other than at a few stations along a narrow ten mile stretch in the south of France. We will have to see how the rest of the summer turns out.
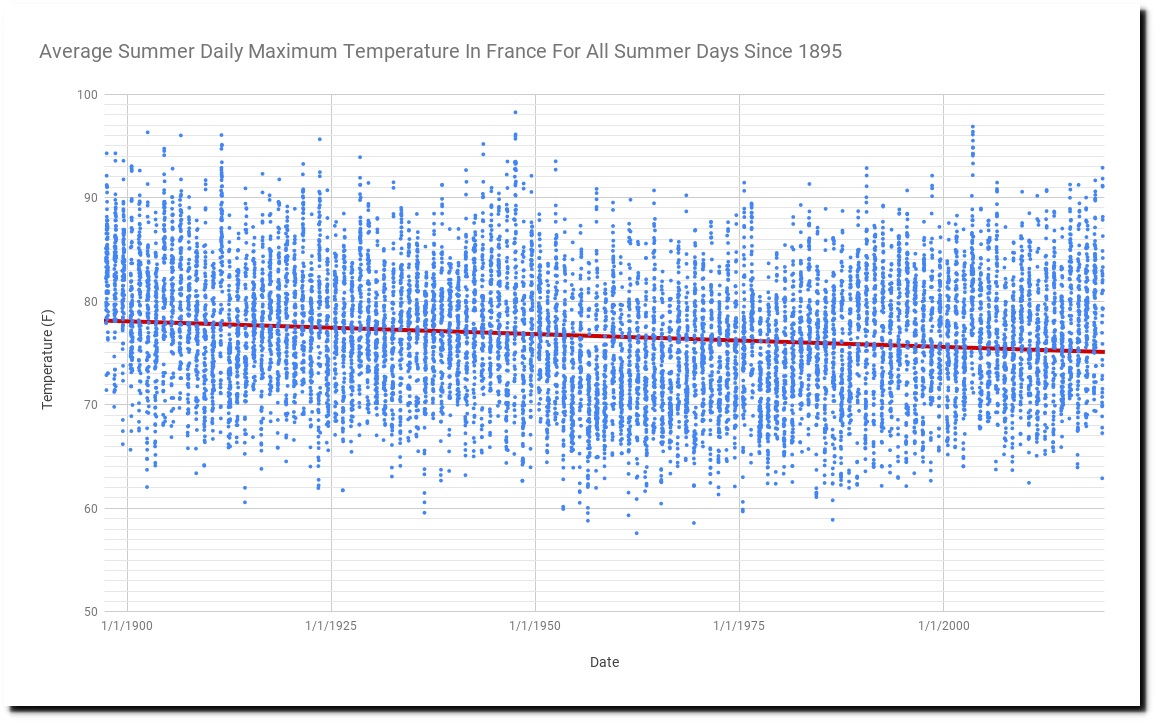
I have been working on some new tools, which give me the ability to do some new types of analysis like this very quickly.
Posted in Uncategorized
Leave a comment
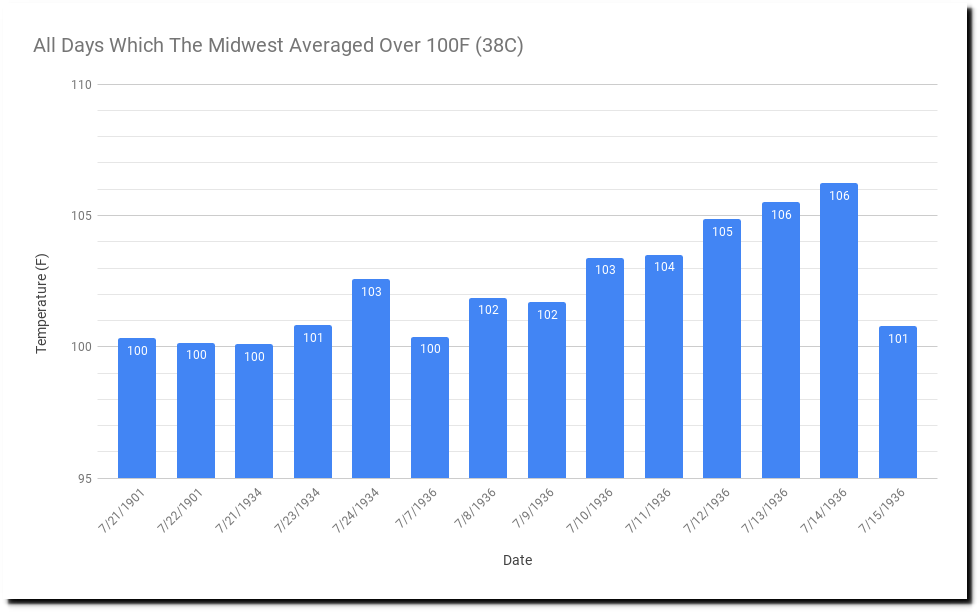
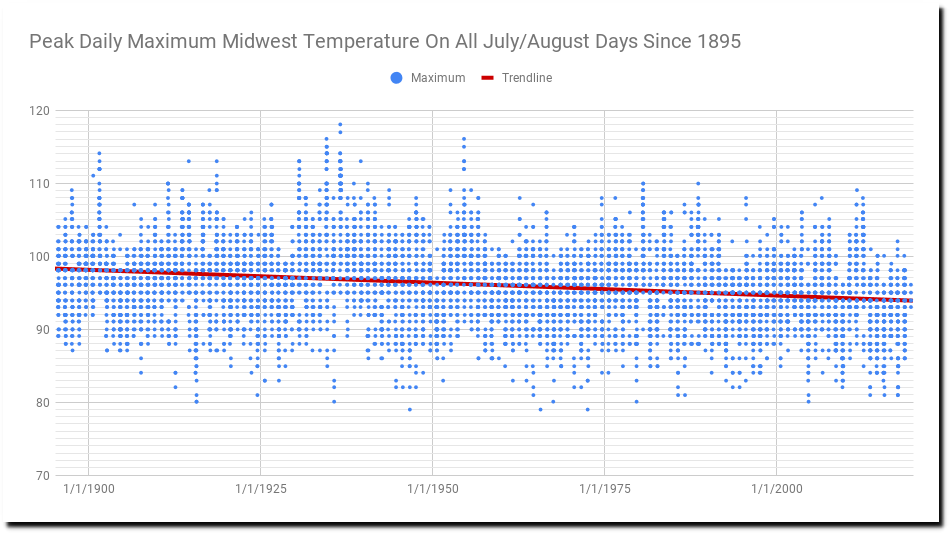
Plummeting Midwest Heat
The Midwest has had only fourteen days since 1895 which averaged over 100 degrees (38C.) All occurred before 1937. The days were July 21-22 1901, July 21 1934, July 23-24 1934 and the incredible heatwave of July 7-15 1936 – nine consecutive days averaging over 100 degrees during that stretch. The hottest day was July 14, 1936 which averaged 106 degrees across the Midwest.
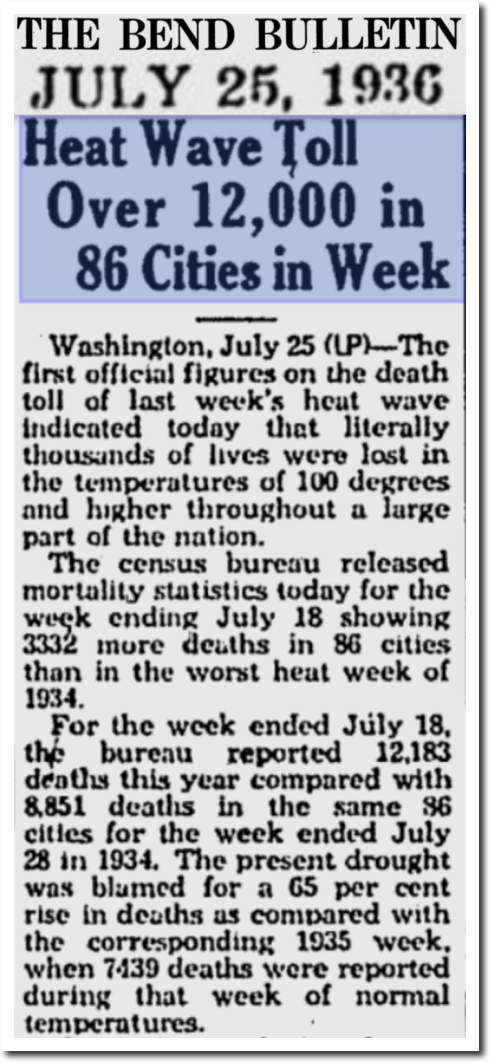
The Bulletin – Google News Archive Search
It is now very rare for Midwest temperatures to average over 90 degrees, and the average Midwest July/August temperature has dropped three degrees since the 19th century.
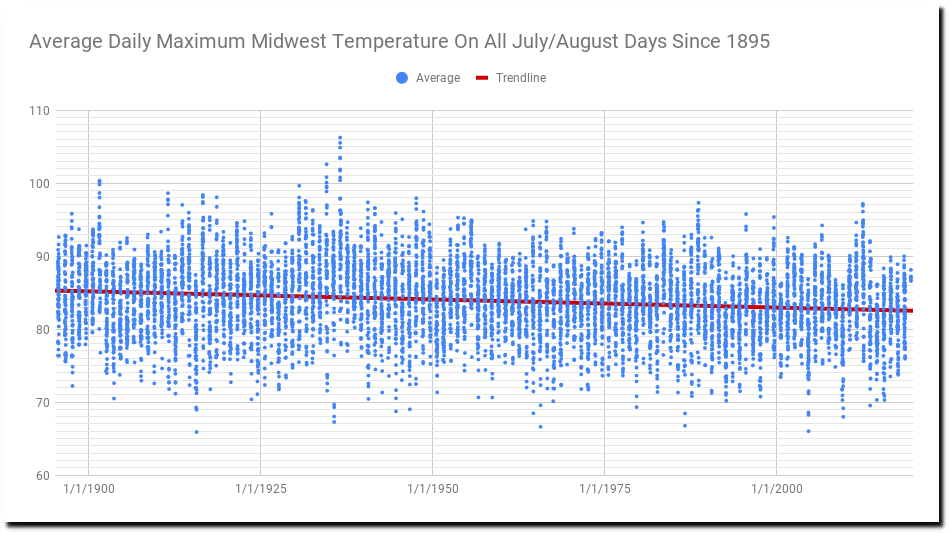
The hottest days have dropped about four degrees since the 19th century.
Meanwhile the criminals at the Union of Concerned Scientists claim the exact opposite, and want you to sign a petition that you “stand with science.”

Heat in the Heartland: 60 Years of Warming in the Midwest (2012) | Union of Concerned Scientists
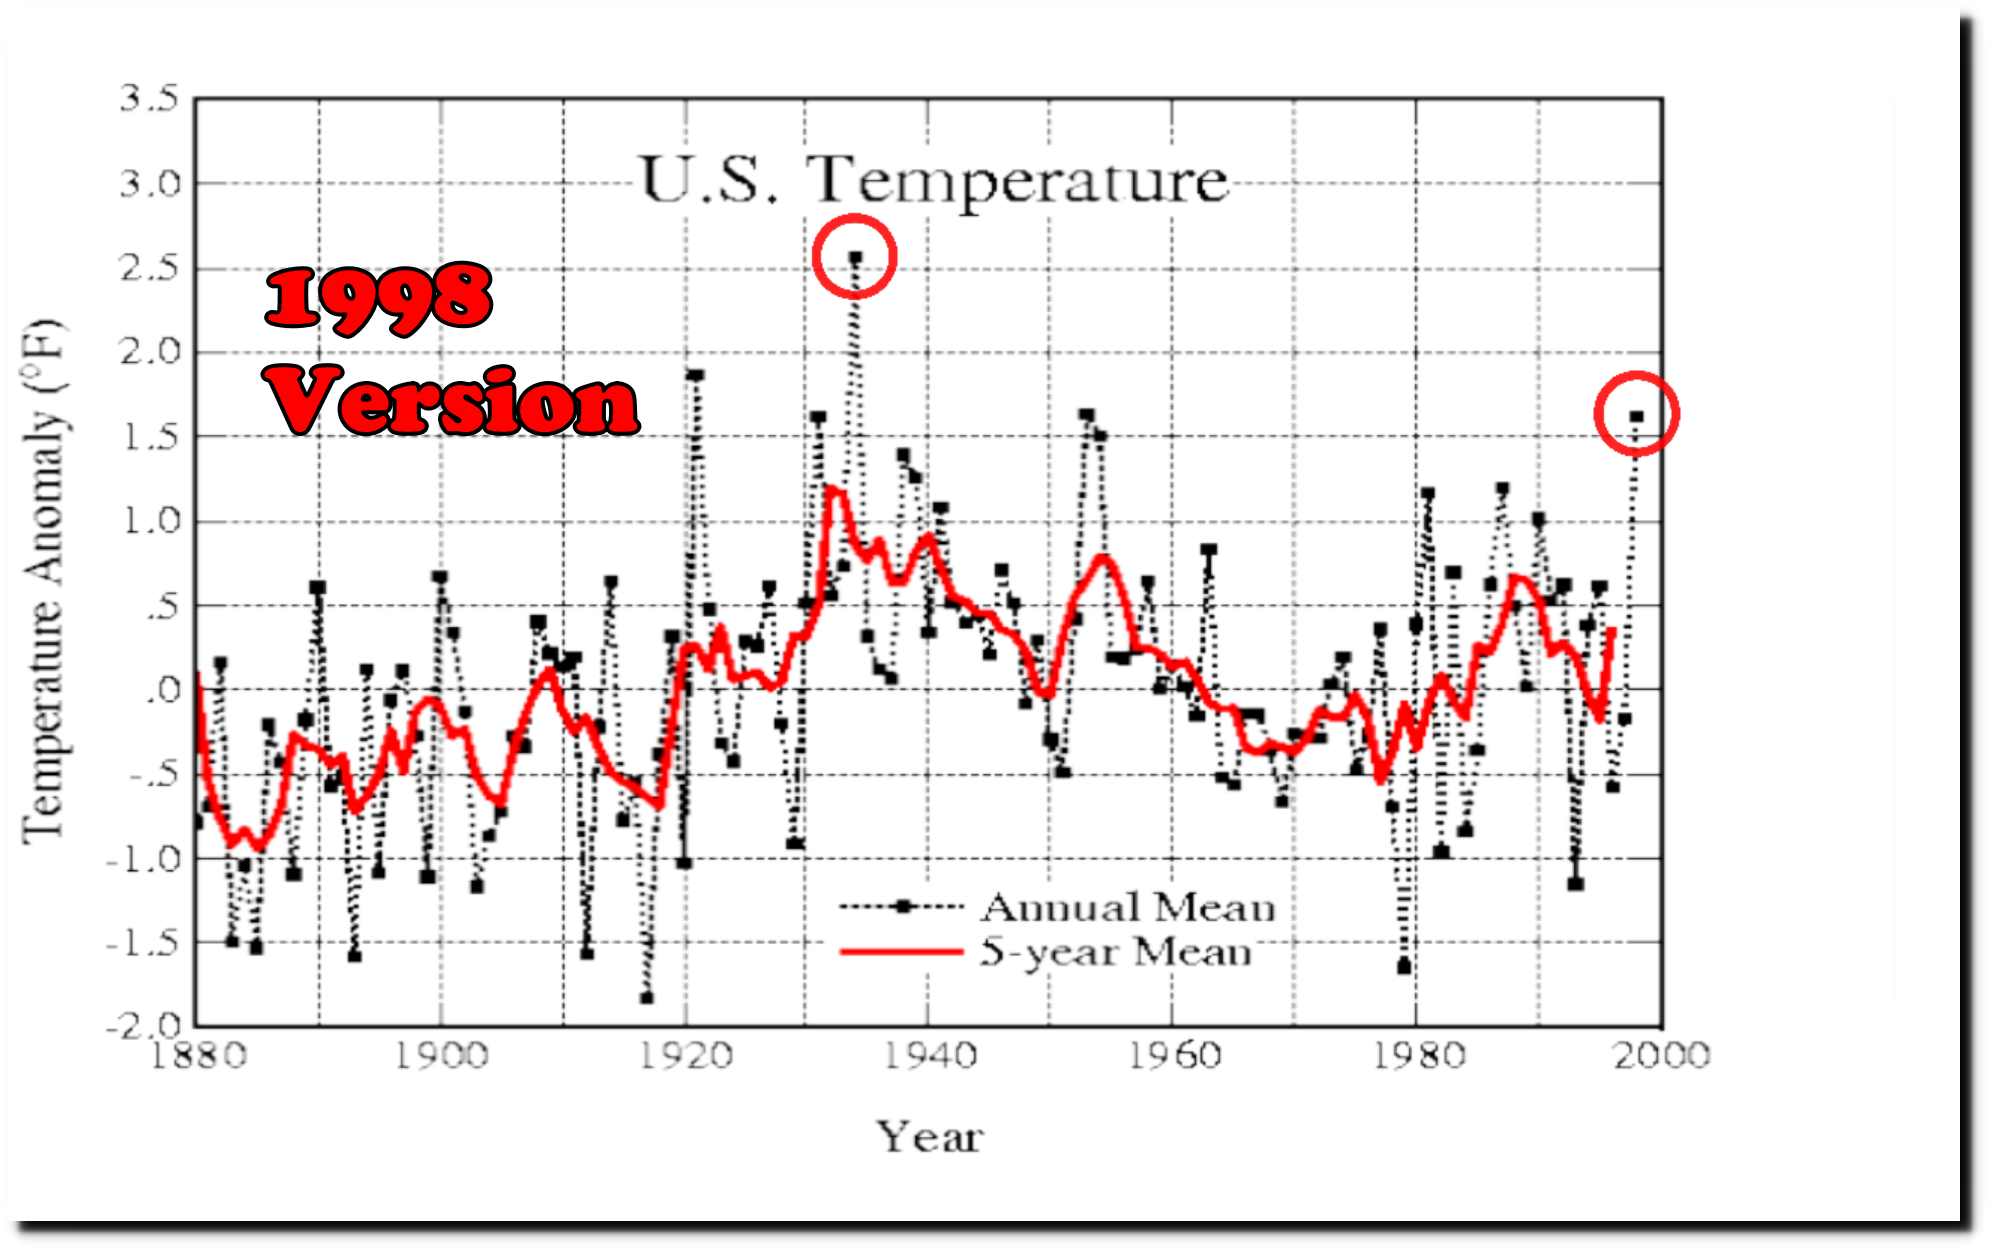
They hid all the pre-1955 temperatures in their report, but even for the time period they covered they still are lying. NASA and NOAA are doing exactly the same thing – hiding the heat of the 1930s. Huge amounts of money are dependent on keeping the climate scam alive.
Posted in Uncategorized
Leave a comment
World To End In 547 Days
Prince Charles advances the apocalypse by ten years.
Posted in Uncategorized
Leave a comment