
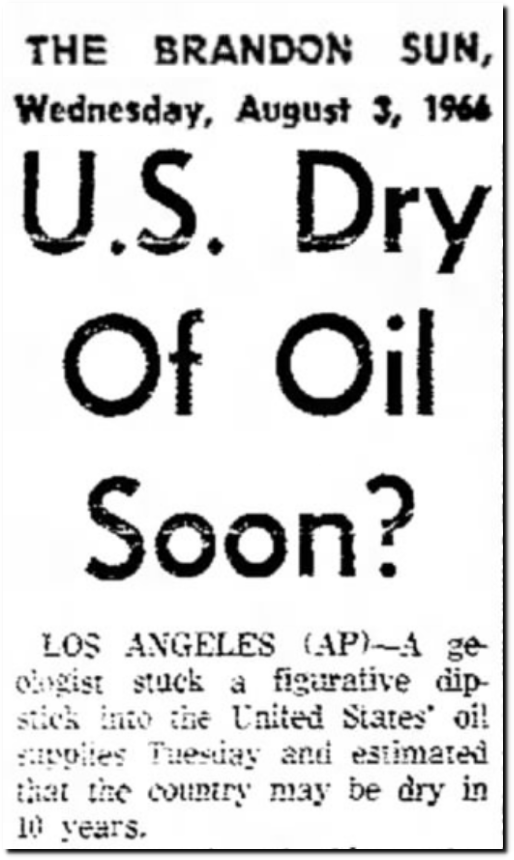
Sad news – the US will run out of oil by 1992, and the world will run out of oil between 2012 and 2022.

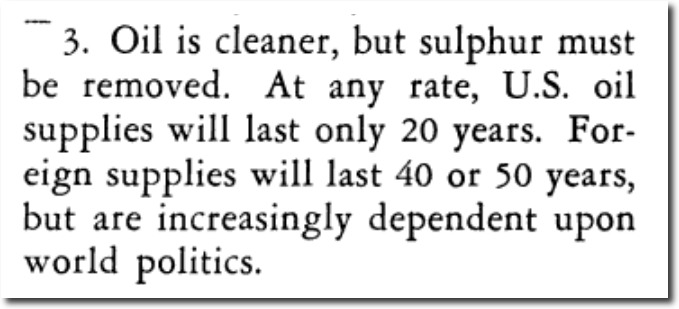
Sad news – the US will run out of oil by 1992, and the world will run out of oil between 2012 and 2022.
“He who controls the past, controls the future; and he who controls the present, controls the past.”
– George Orwell “1984”
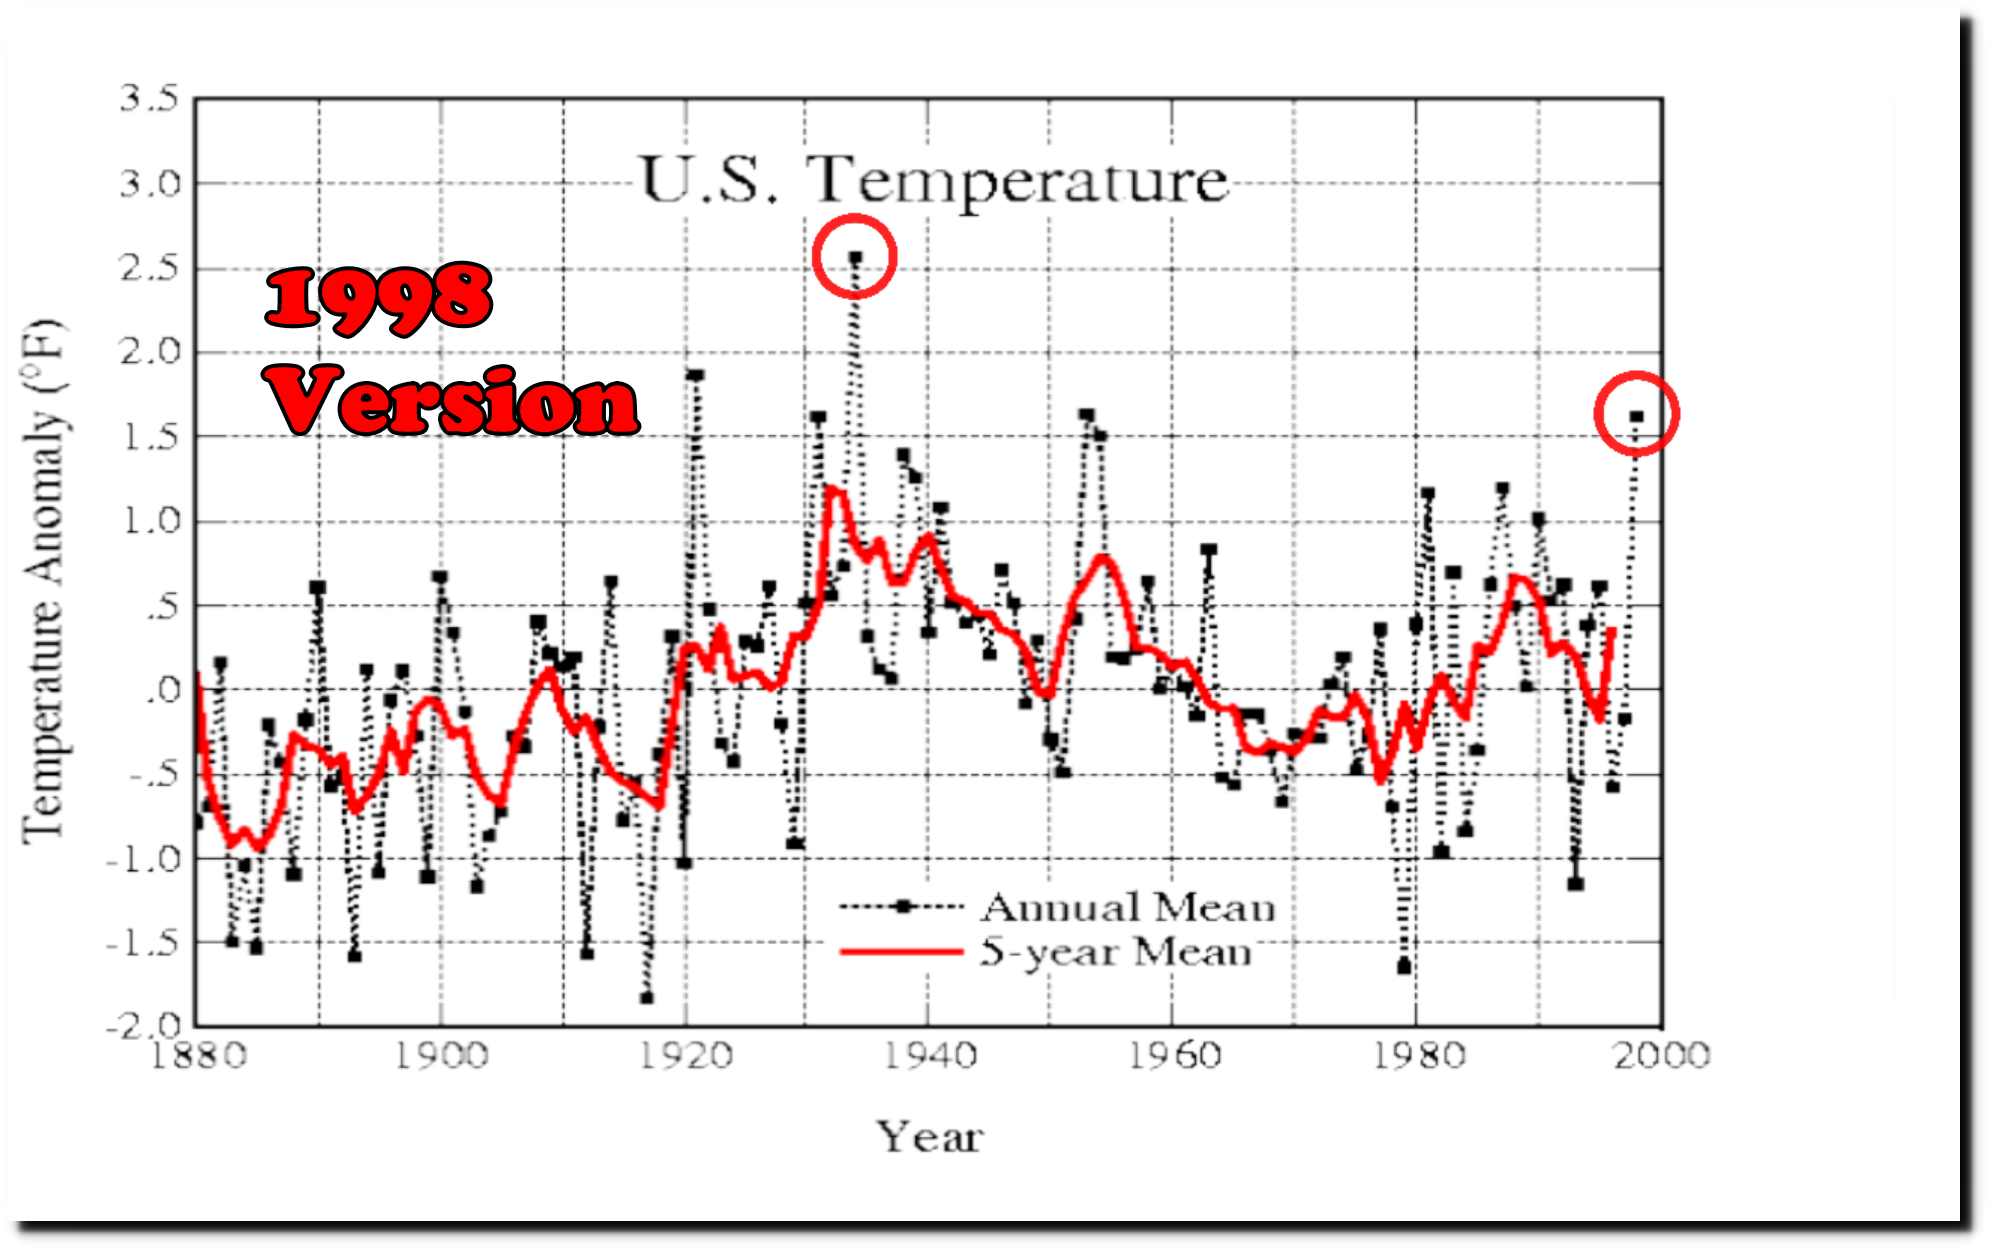
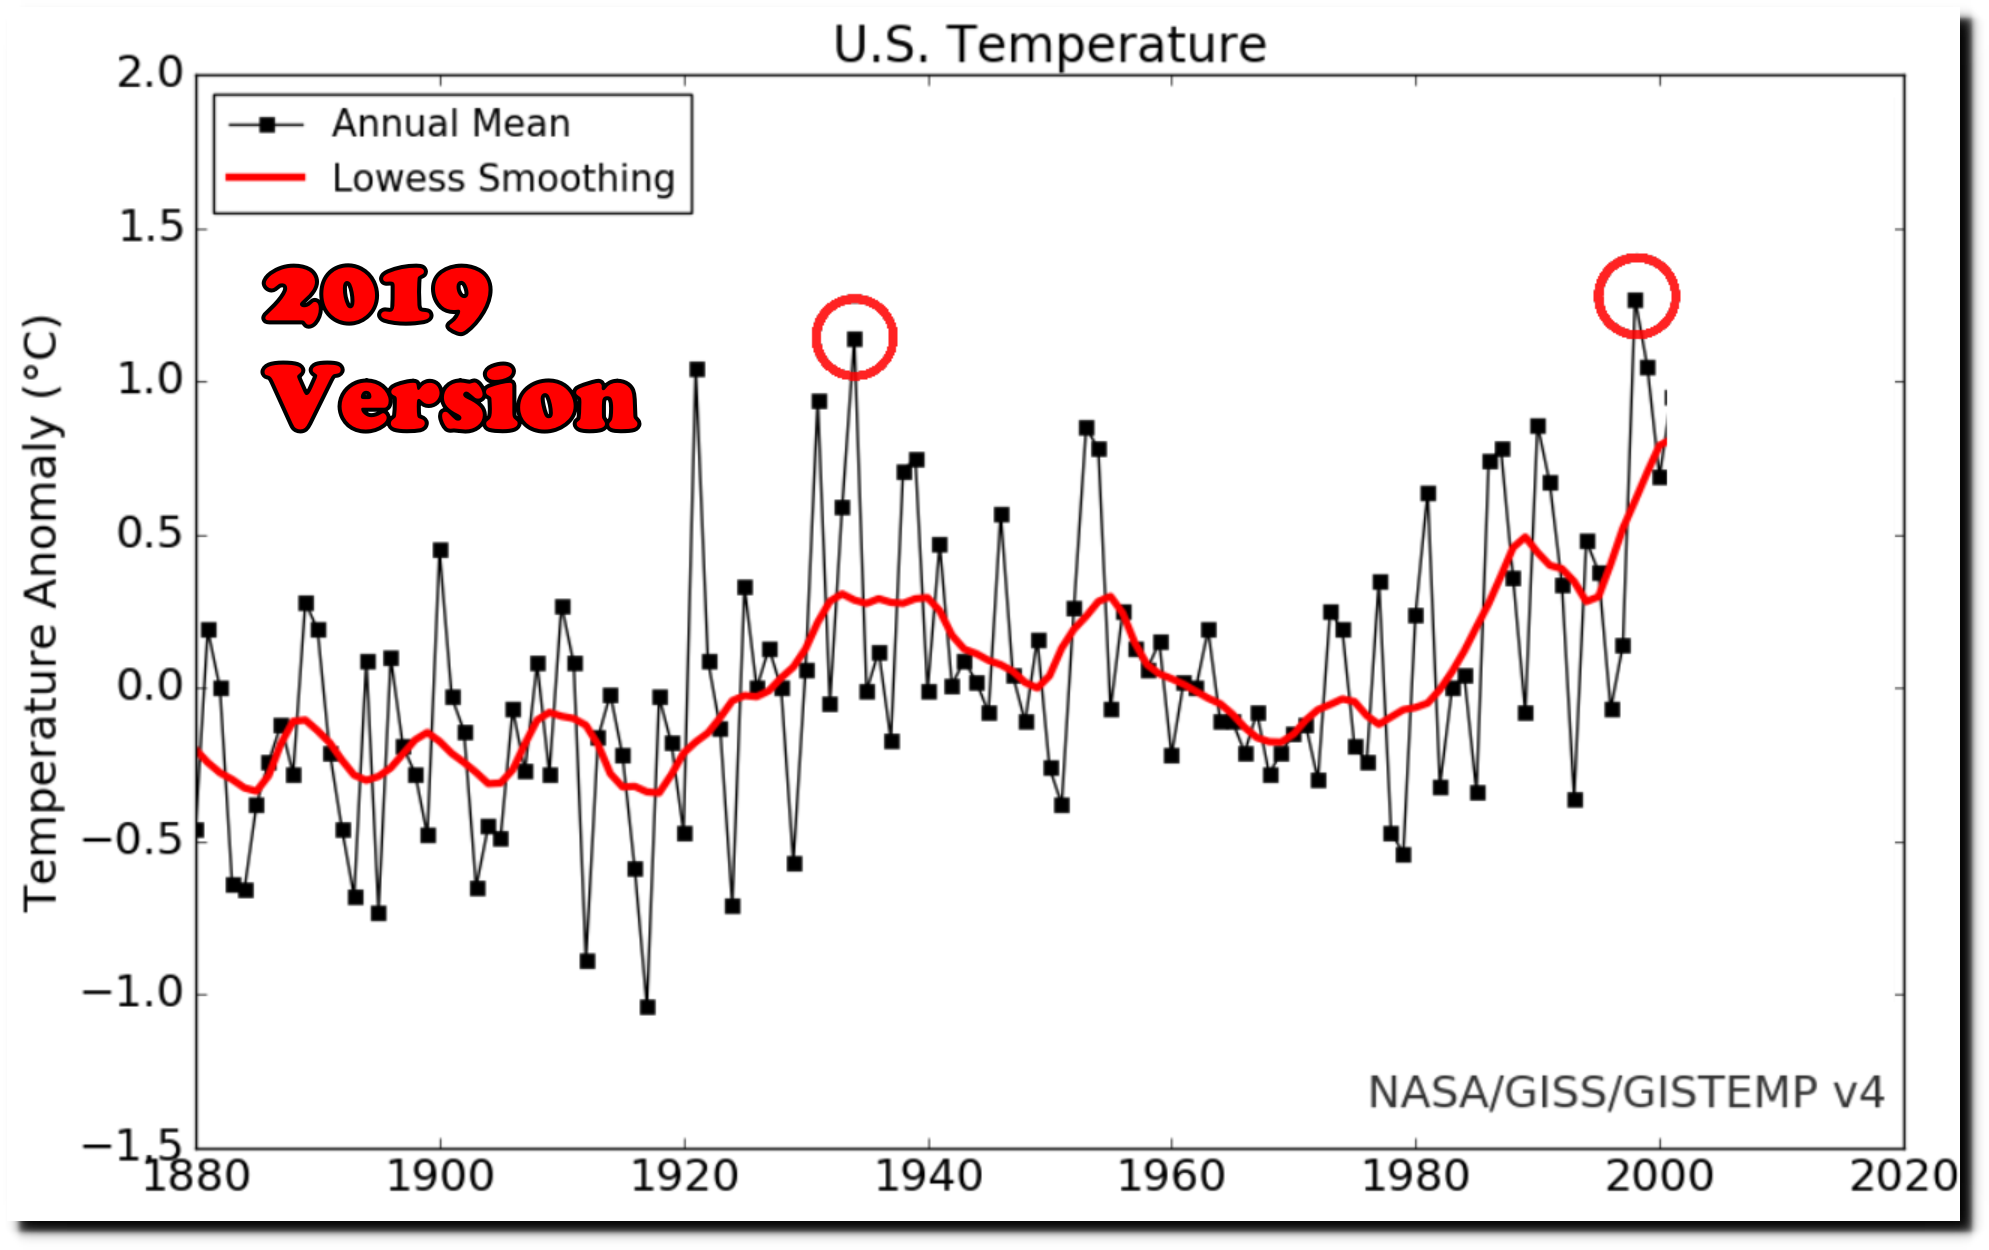
In 1998, NASA showed 1934 as the hottest year on record in the US, and declining temperatures for the rest of the century. They have since rewritten the data to eliminate the post 1930s cooling. 1998 used to be one degree Fahrenheit cooler than 1934, and now it is warmer. Note that 1998 version is in Fahrenheit and the 2019 version is in Celsius, thus the different numbers along the Y-Axis.
Why did they do this? The National Climate Assessment shows that the US used to be much hotter – in defiance of greenhouse gas theory and the political needs of climate alarmists.
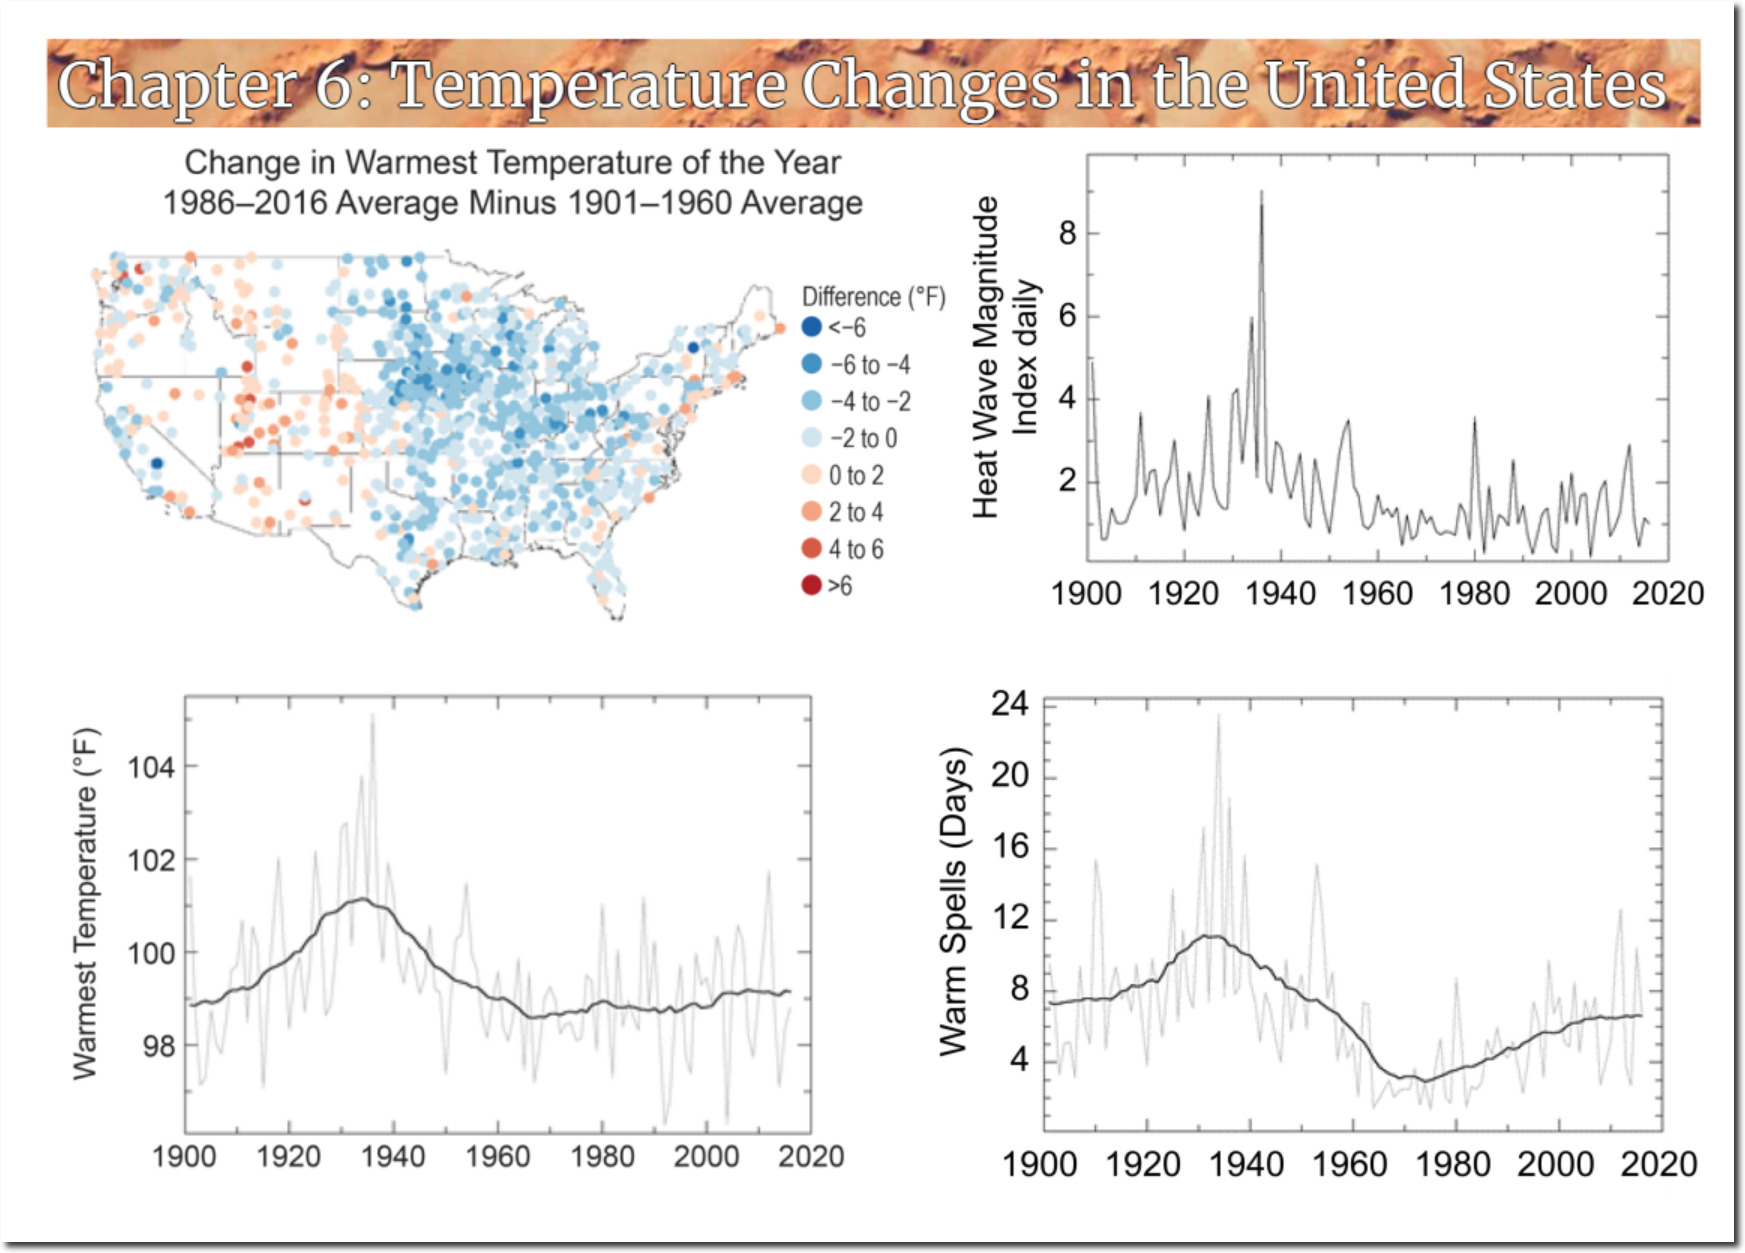
Temperature Changes in the United States – Climate Science Special Report
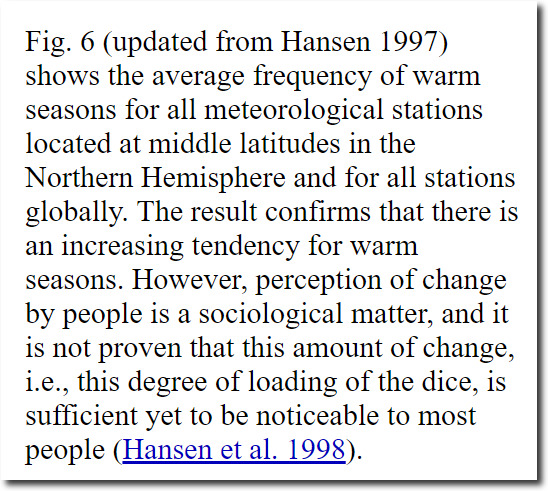
In 1998, NASA was worried that people hadn’t yet accepted their scam, so they altered the data. They said it was a “sociological matter.”
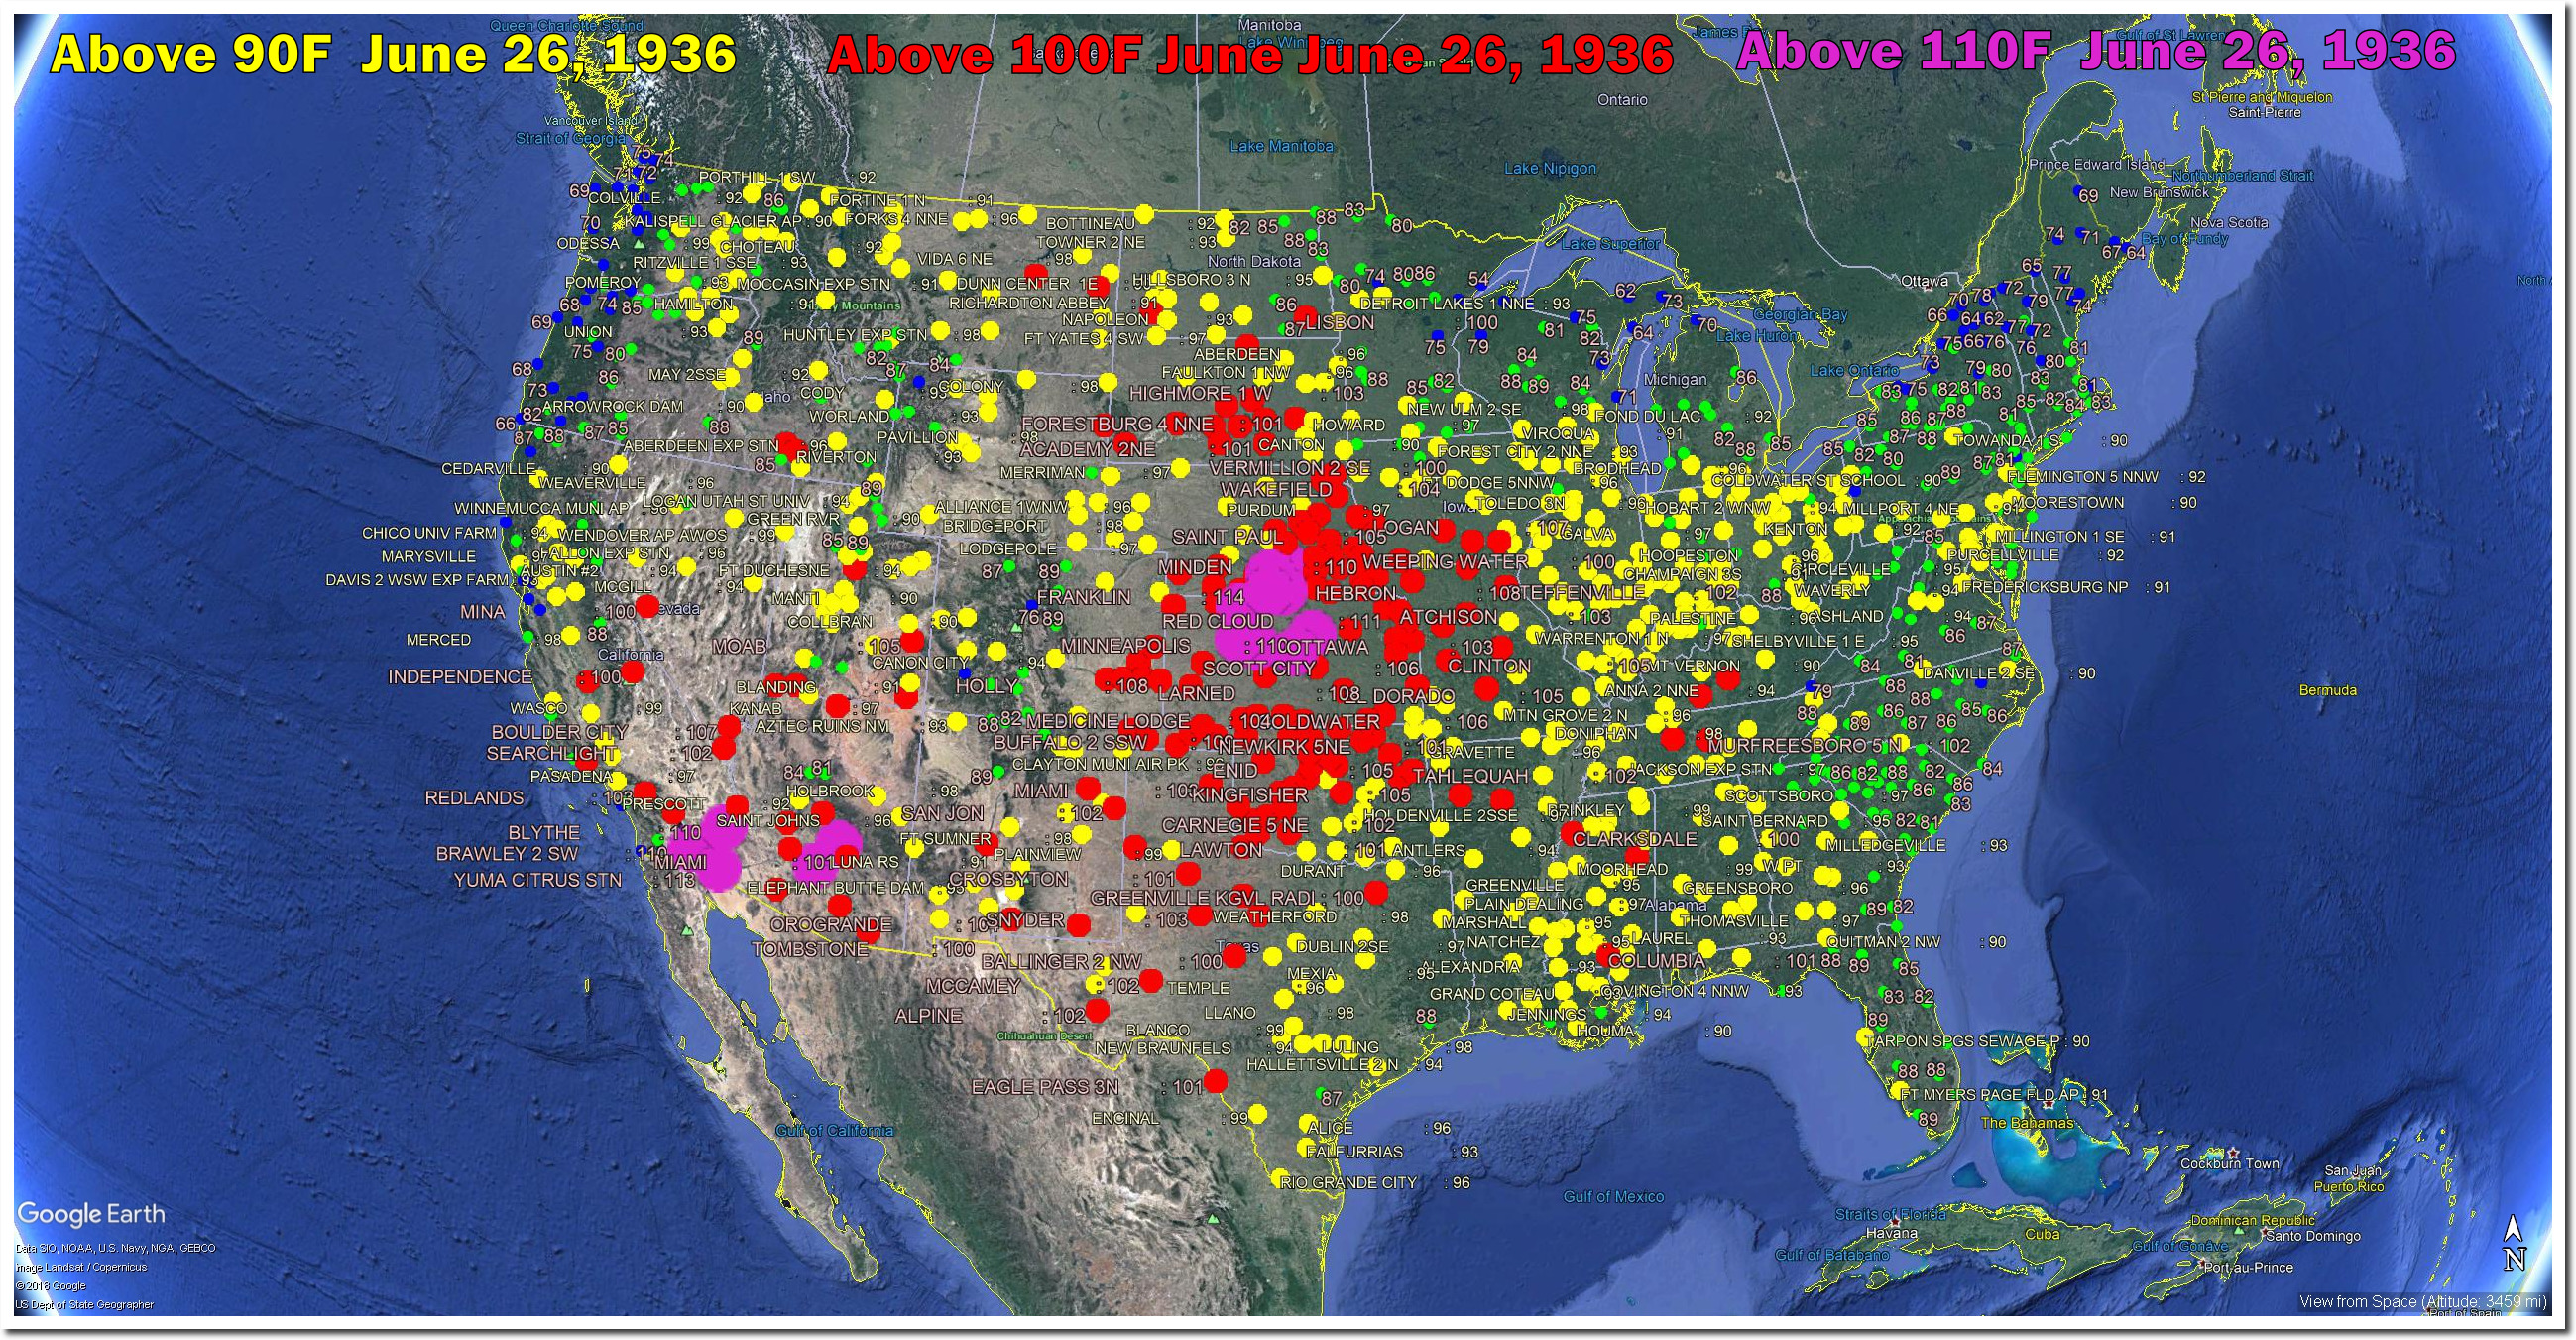
On this date in 1936, the vast majority of the US was over 90 degrees, a large section was over 100 degrees, and it was over 110 degrees in Nebraska and Kansas. Franklin, Nebraska was 114 degrees, and Hays, Kansas was 113 degrees. Nearly 20 degrees warmer than today’s hot weather.
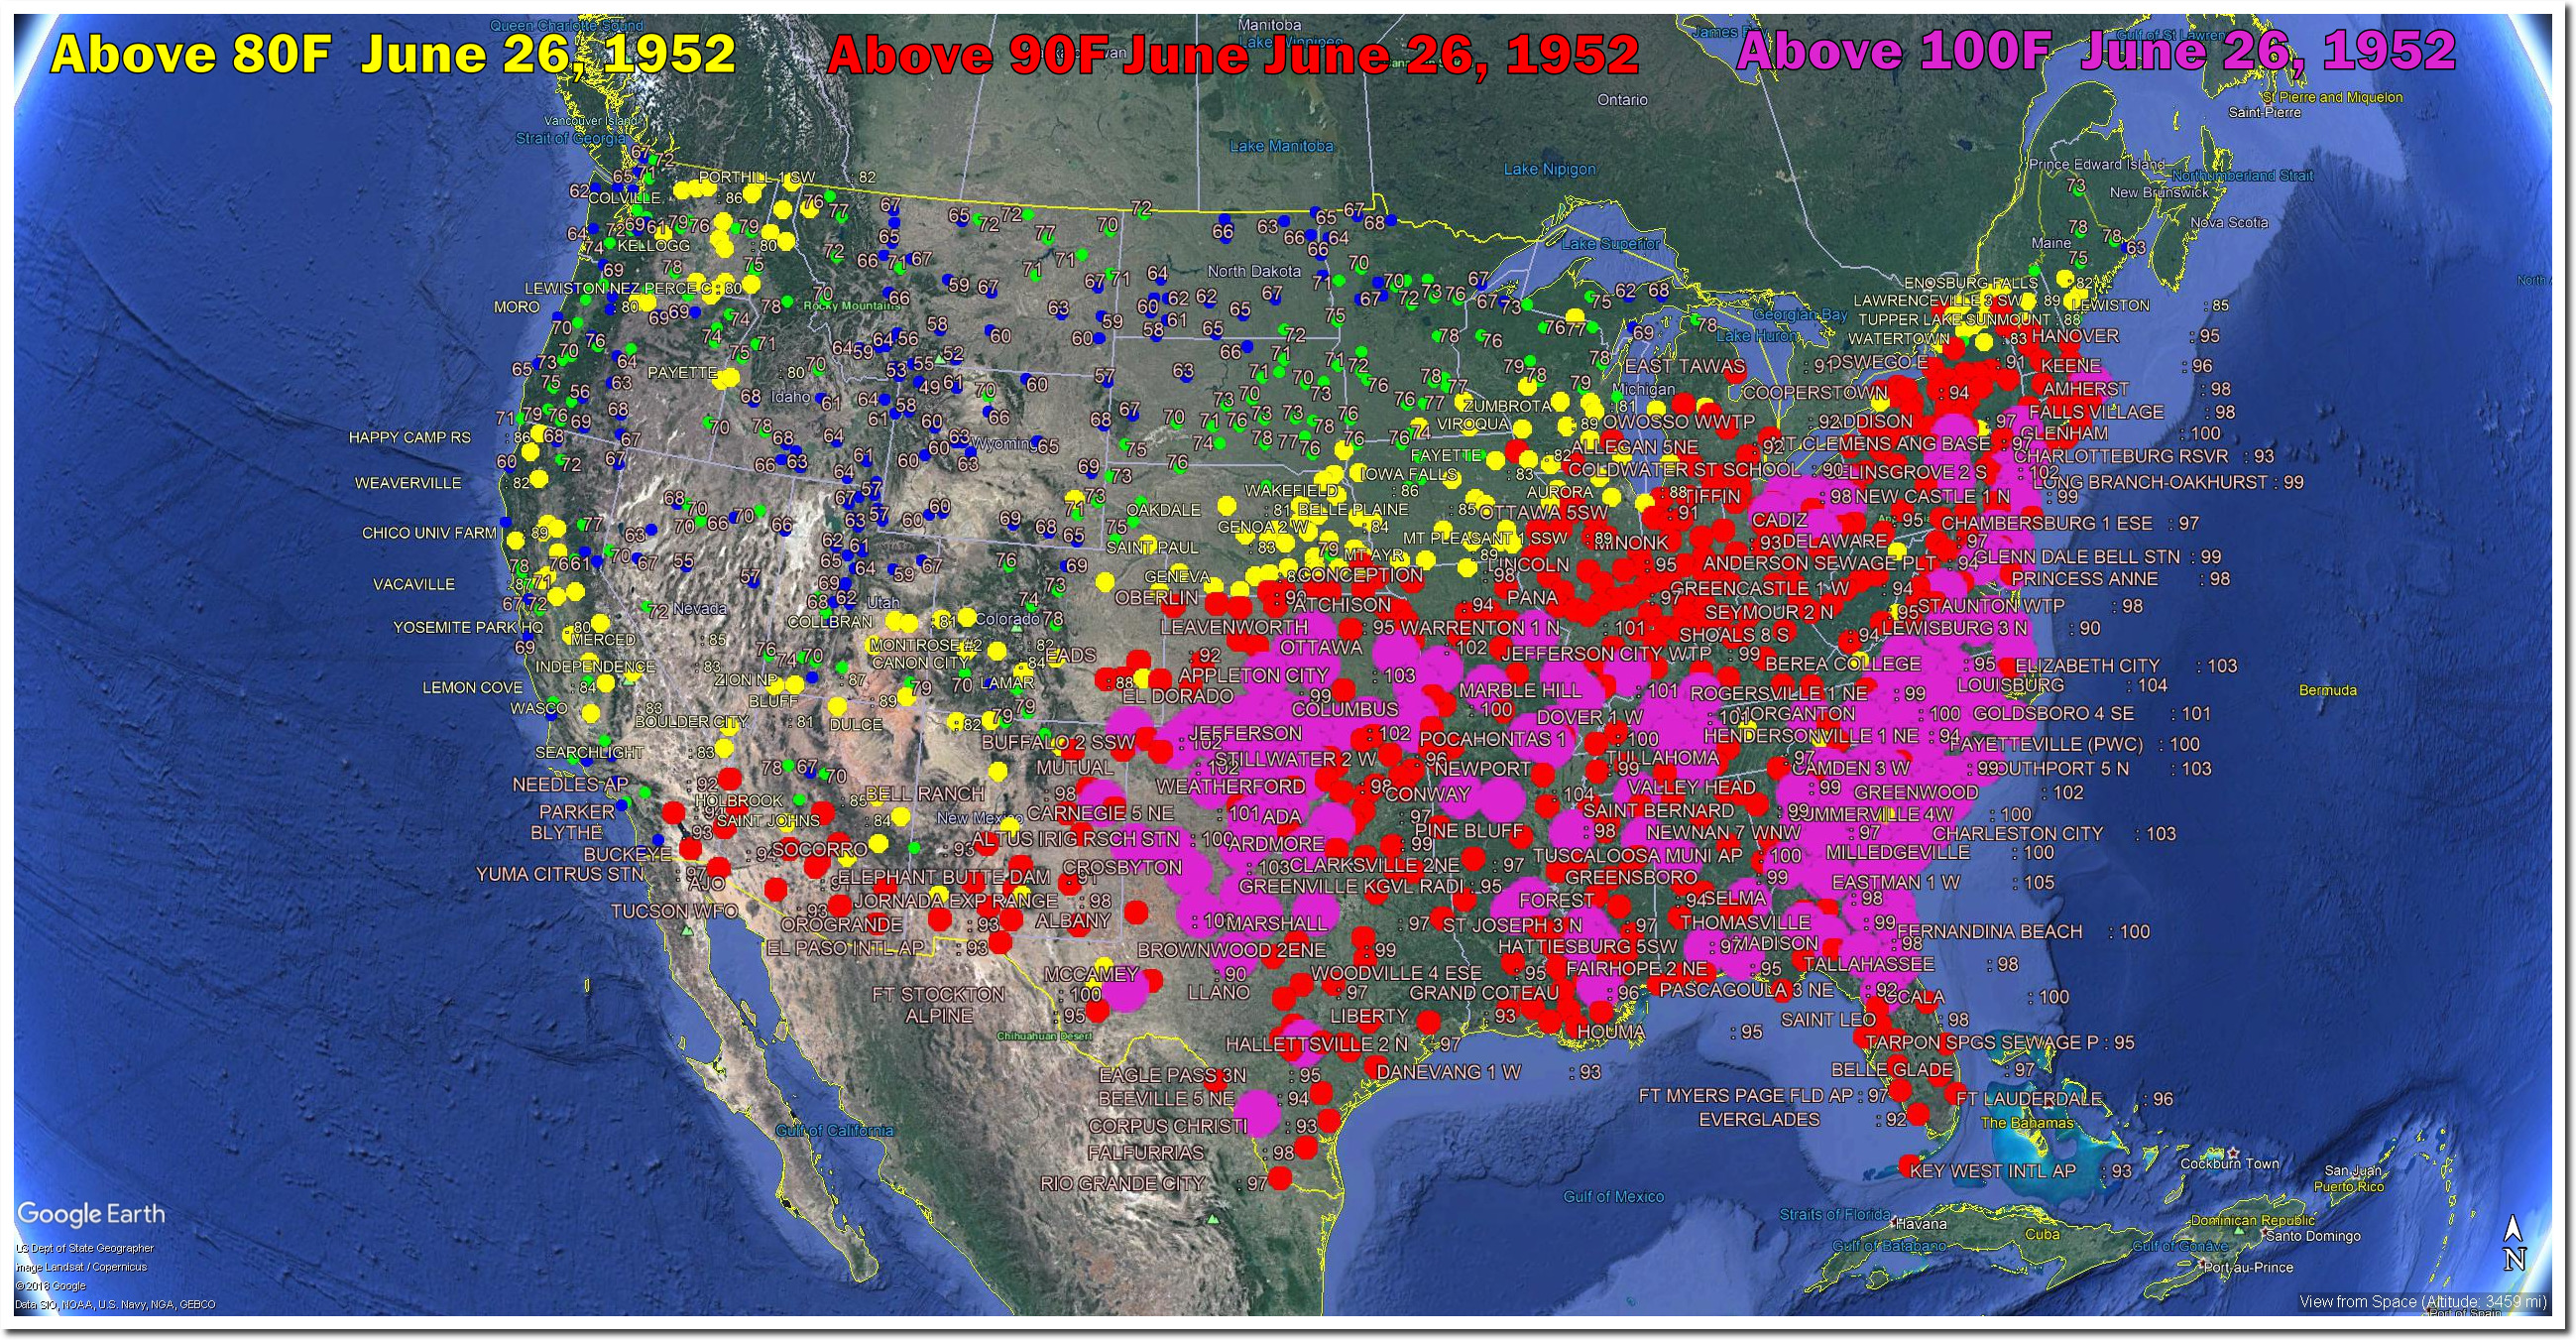
On this date in 1952, most of the eastern half of the US was over 100 degrees.
This date in 1887 was the hottest day on record in Ireland.
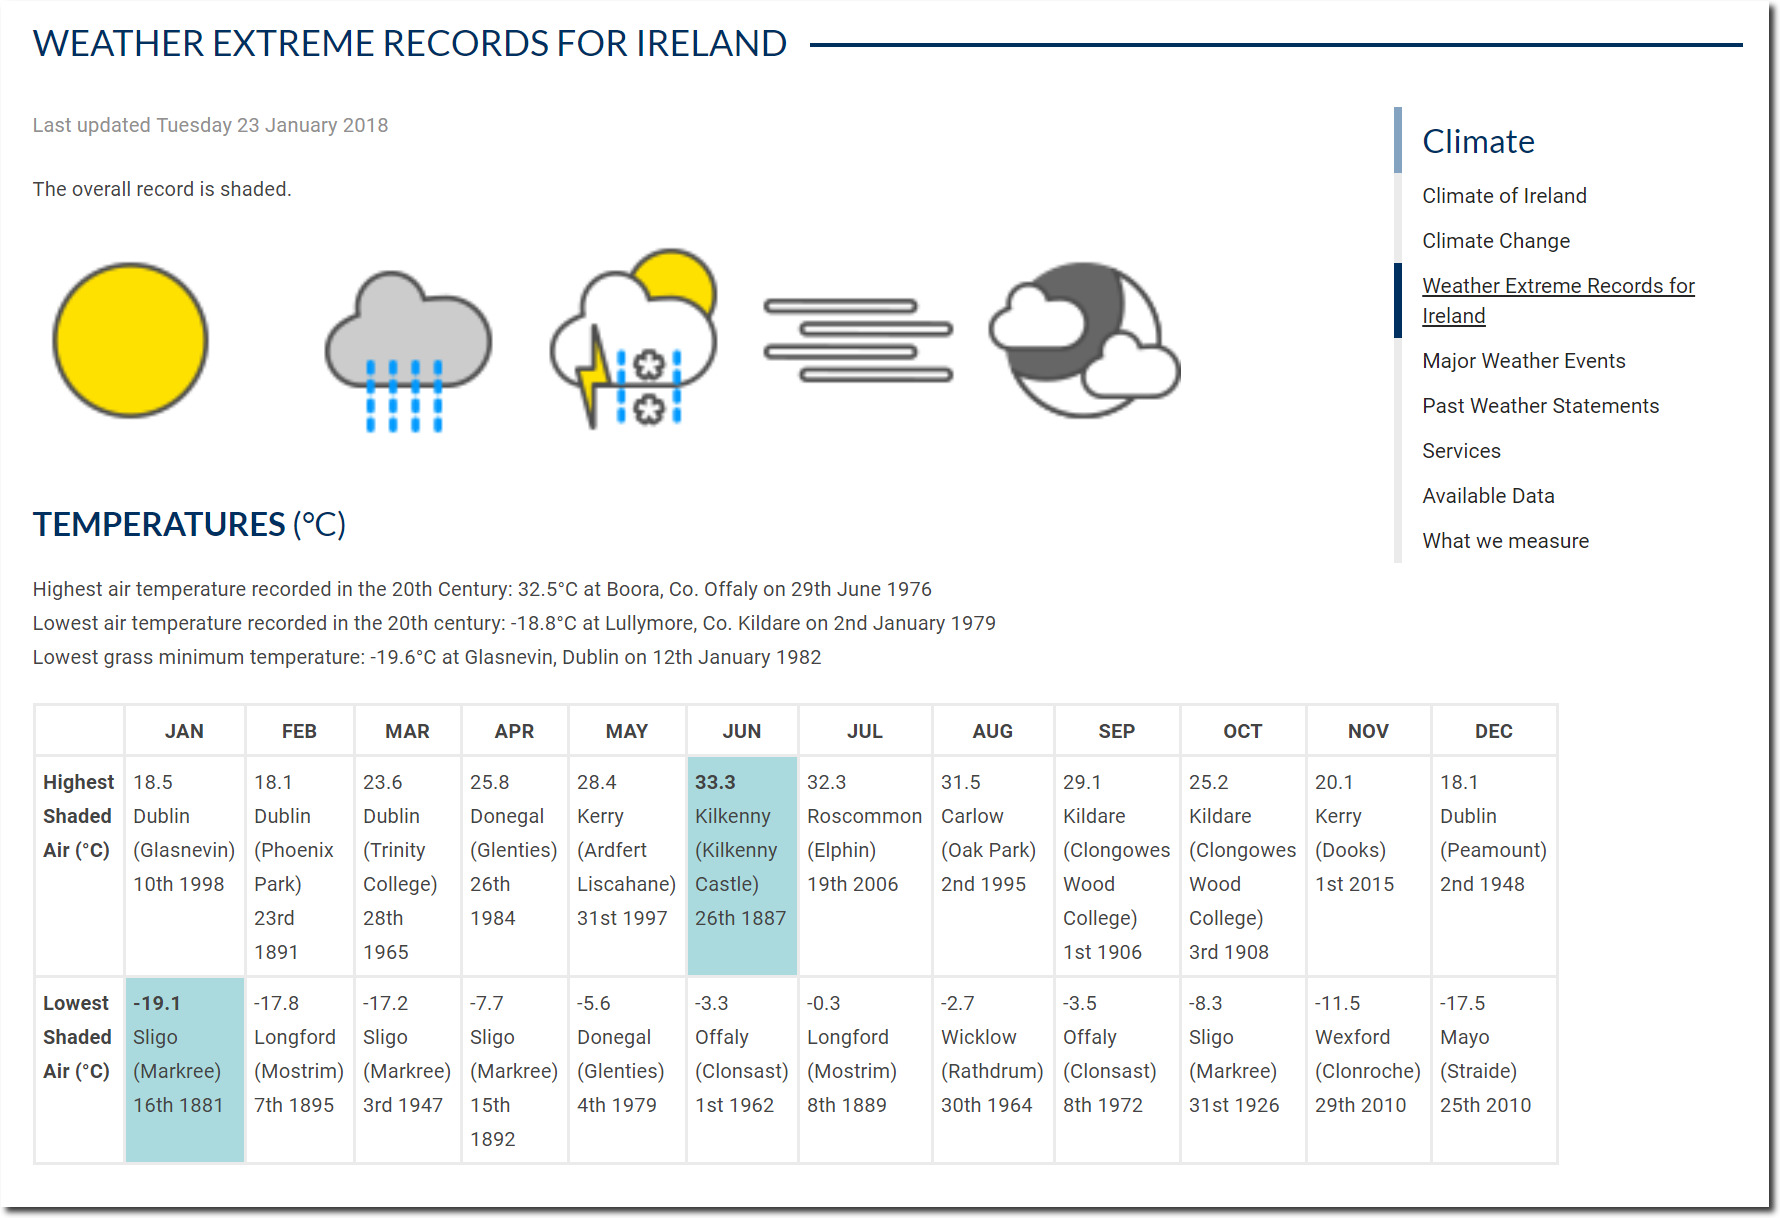
Weather Extreme Records for Ireland – Met Éireann – The Irish Meteorological Service
But propagandists have no need for actual data. Never mind that National Climate Assessment says summers are getting cooler – the New York Times says it is just your imagination.

It’s Not Your Imagination. Summers Are Getting Hotter. – The New York Times
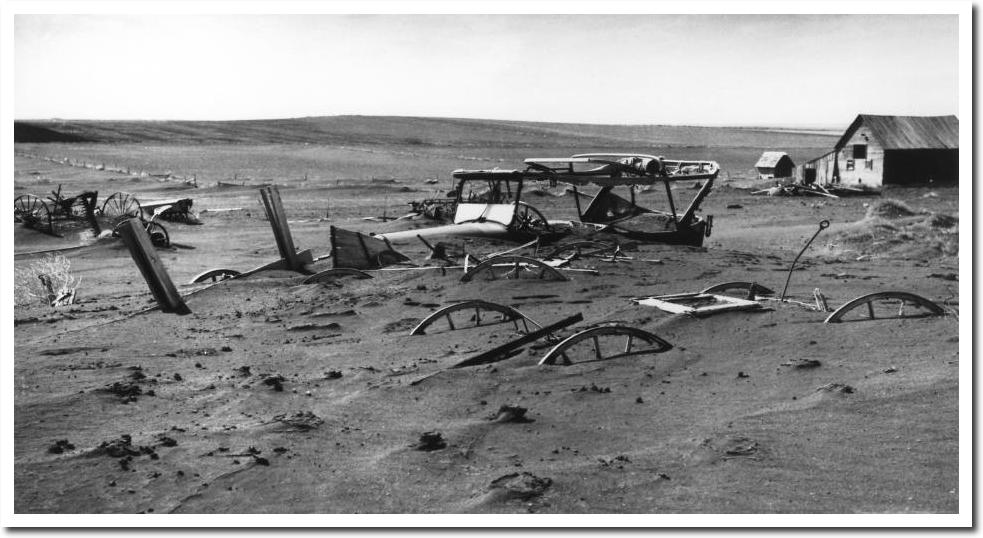
In the 1930s we had an actual climate crisis. That needed to be erased.
Last week I called out the Washington Post and Fox News for lying about Arctic sea ice and Greenland glacial ice, which they said were melting at a record rate. The exact opposite is happening. Arctic sea ice is the highest for the date in years, and melting slowly.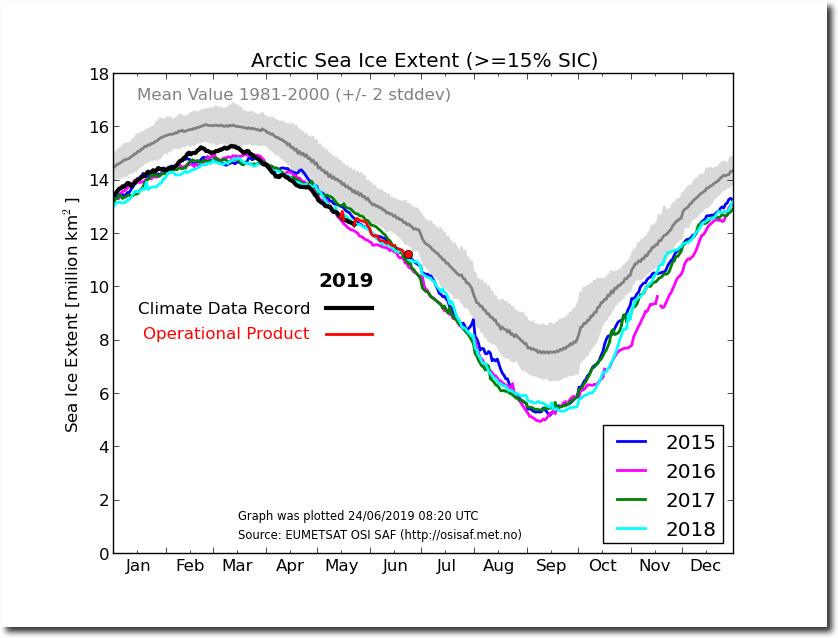
Ocean and Ice Services | Danmarks Meteorologiske Institut
Greenland is also melting very slowly – and has actually gained mass over the last few days.
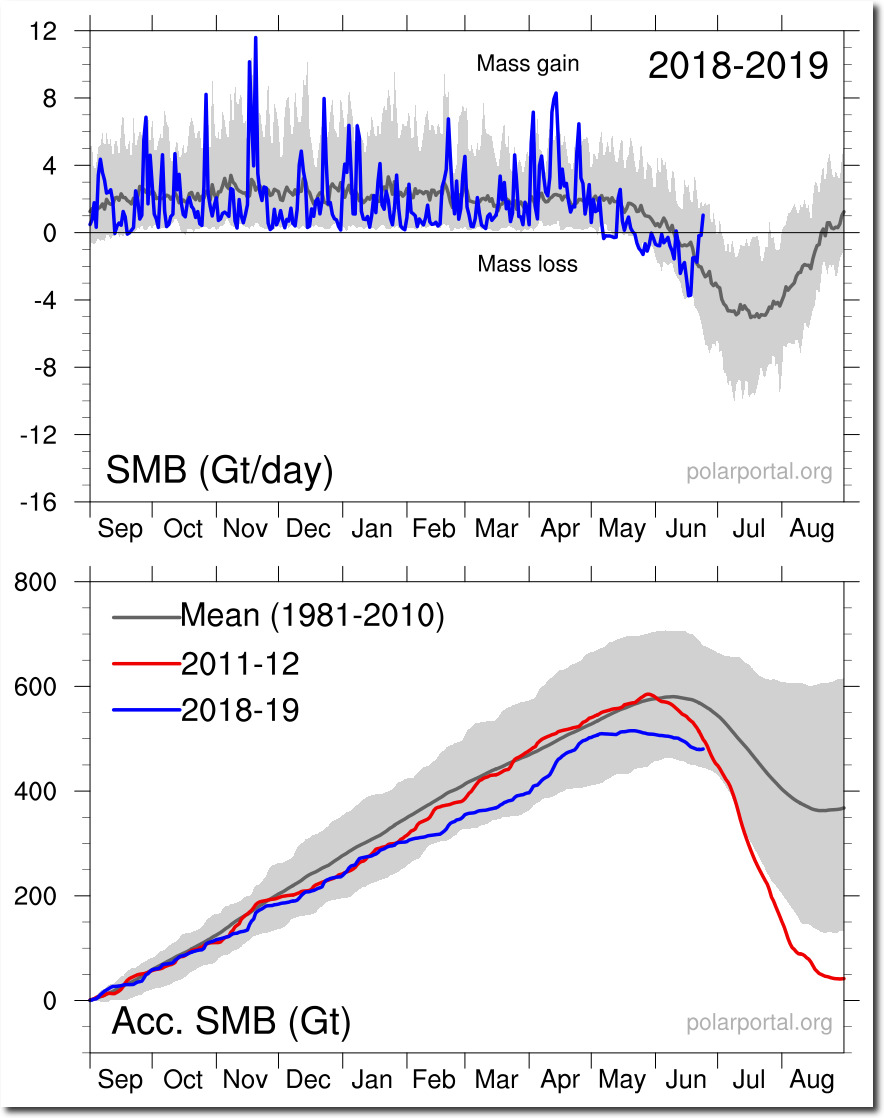
Surface Conditions: Polar Portal
It is -11C and snowing in the center of the Greenland ice sheet. Not exactly a meltdown.
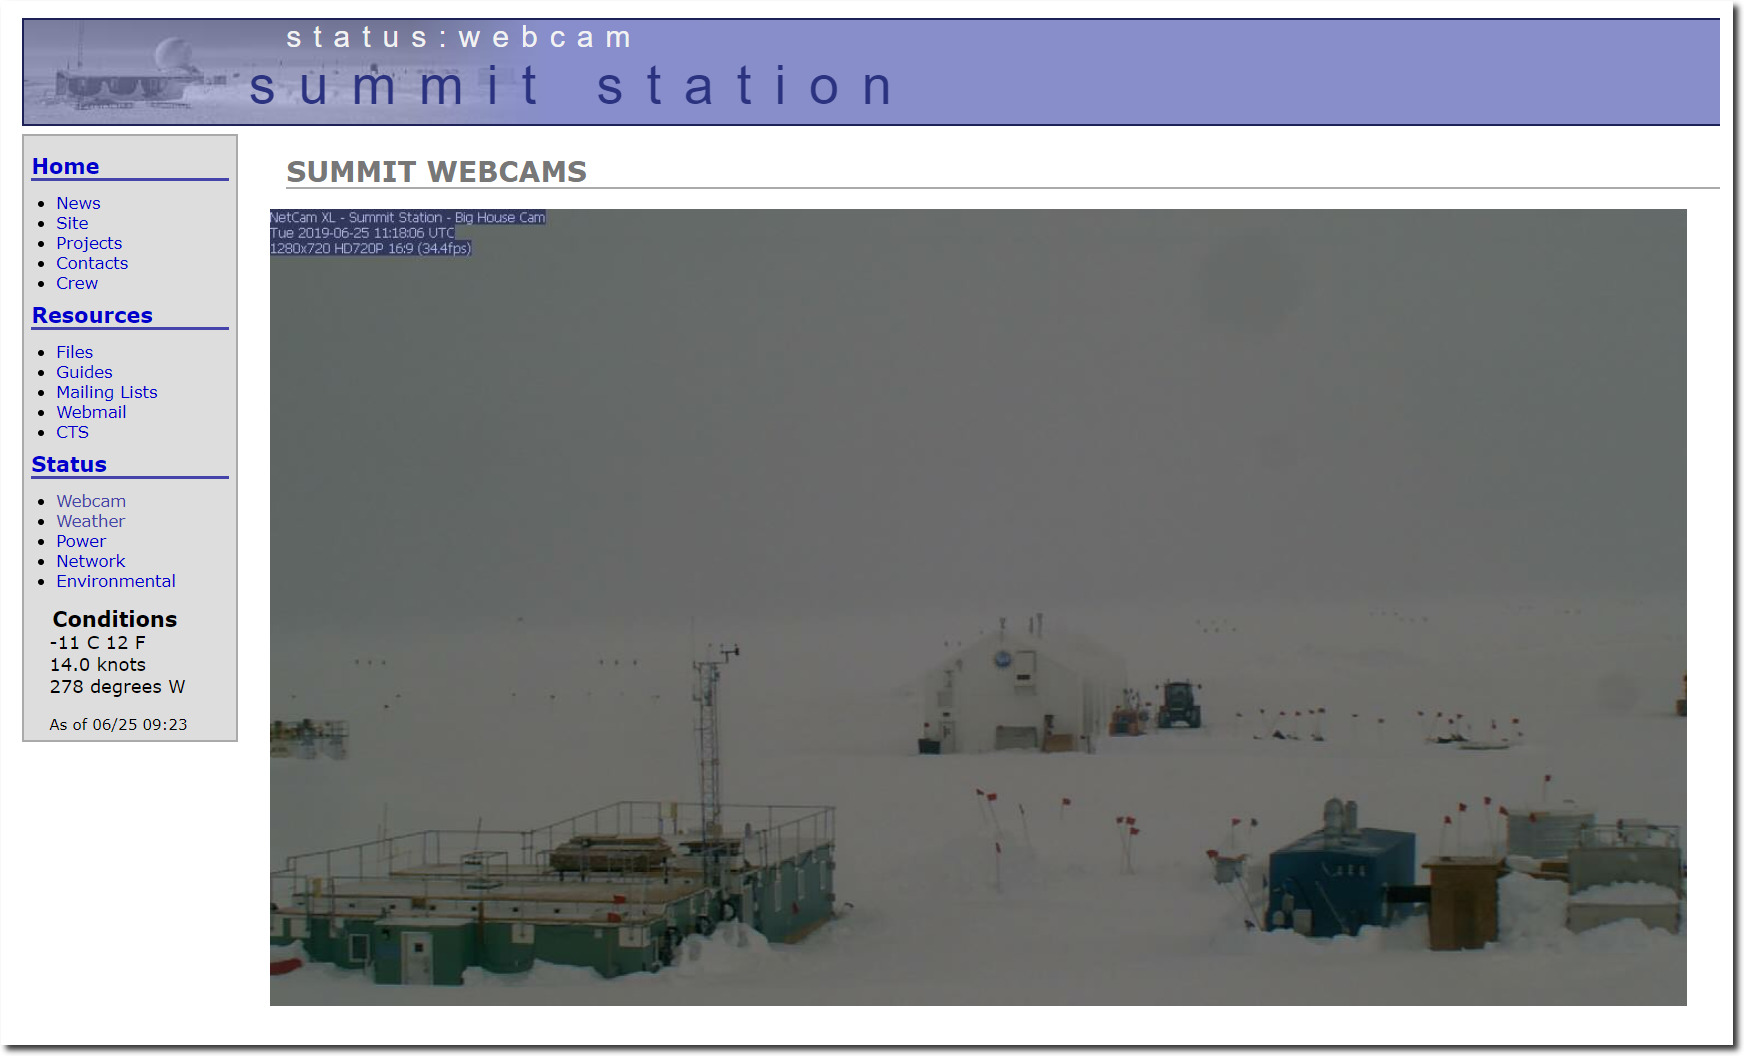
Quite different from 80 years ago, when Greenland was facing “catastrophic collapse.”
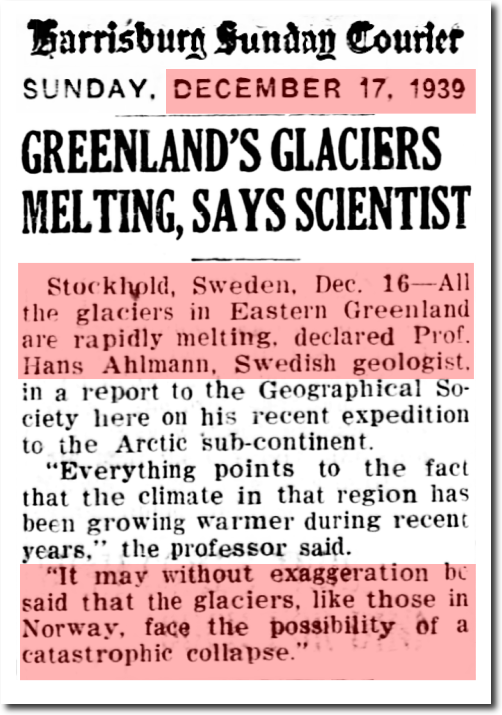
17 Dec 1939, Page 15 – Harrisburg Sunday Courier at Newspapers.com
There is no accountability in journalism. They know they can say anything they want and get away with it, and then refuse to report when they are called out.
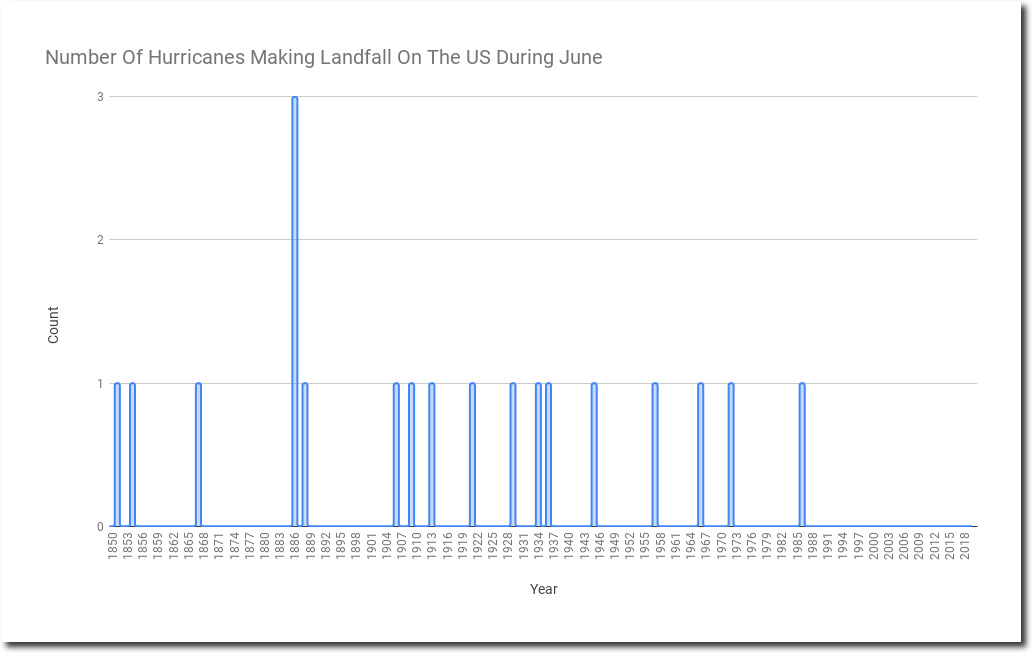
June hurricanes used to be fairly common in the US when CO2 was below 350 PPM, but there have been none since CO2 reached the 350 PPM threshold. In 1886 the US was hit by seven hurricanes, including three category two hurricanes in June. That year was the most active hurricane season on record in the US, with CO2 below 300 PPM.
The reason we don’t get June hurricanes is because the water is now too cold. Hurricanes can’t form until the water temperature reaches 79F.
The first condition is that ocean waters must be above 26 degrees Celsius (79 degrees Fahrenheit). Below this threshold temperature, hurricanes will not form or will weaken rapidly once they move over water below this threshold.
June sea surface temperatures must have been warmer in the past, when CO2 levels were lower. These were the three category two hurricanes which hit the US during June, 1886.
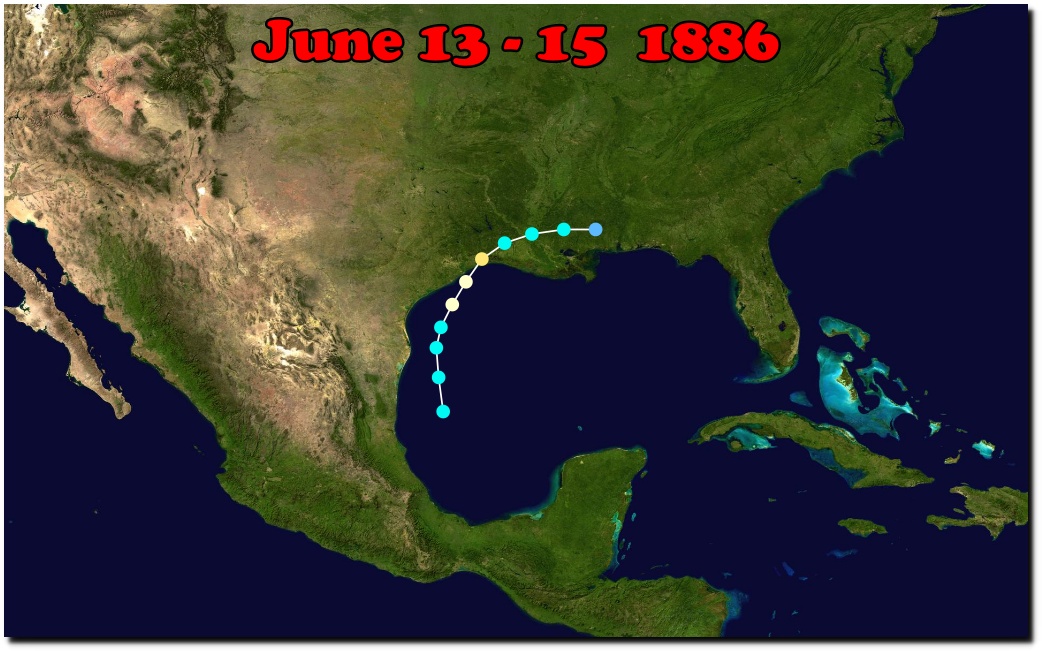
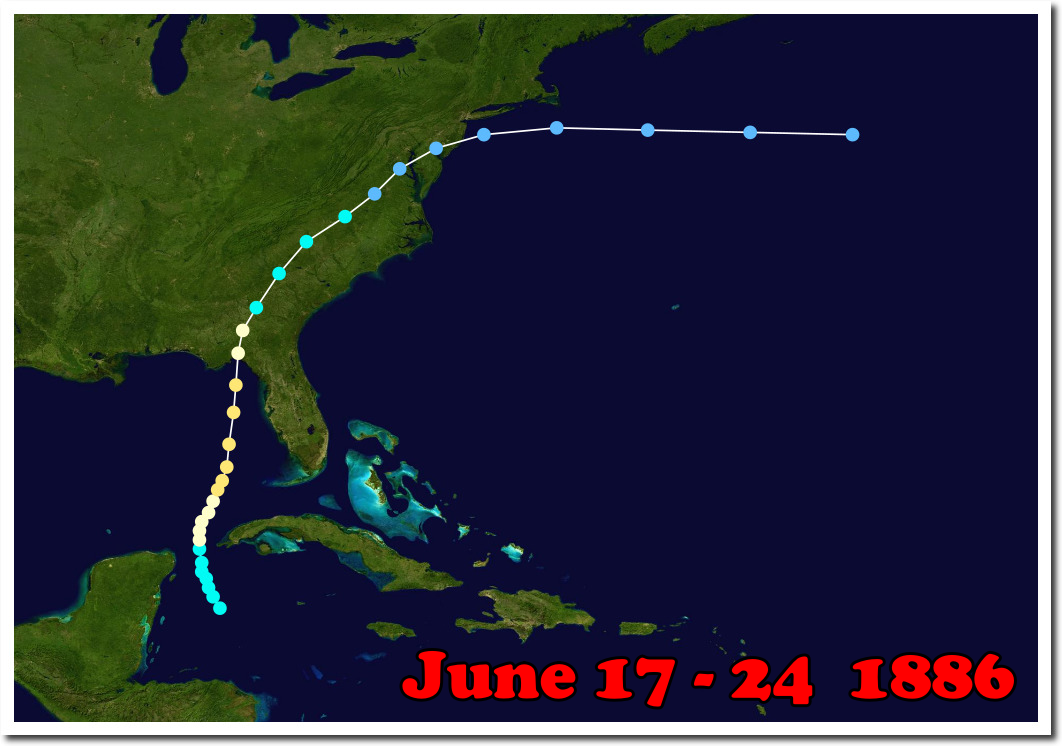
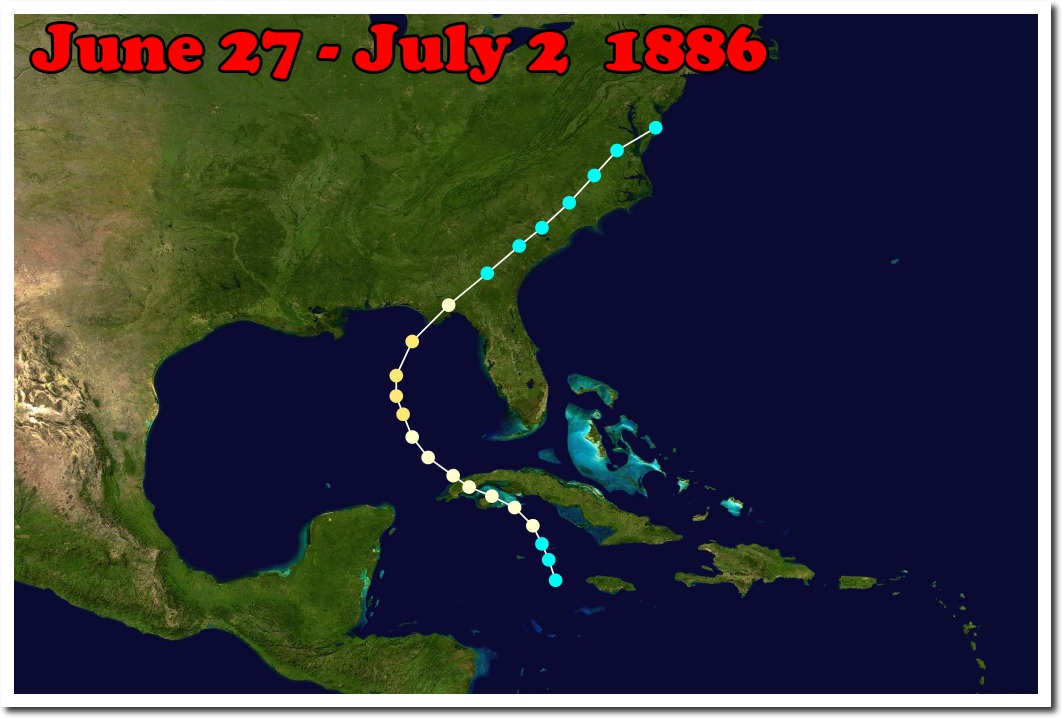
1886 Atlantic hurricane season – Wikipedia
So we know water must have been well above normal temperature in the Gulf of Mexico in June, 1886. Yet HadCrut shows Gulf of Mexico temperatures in June 1886 as being quite cold.

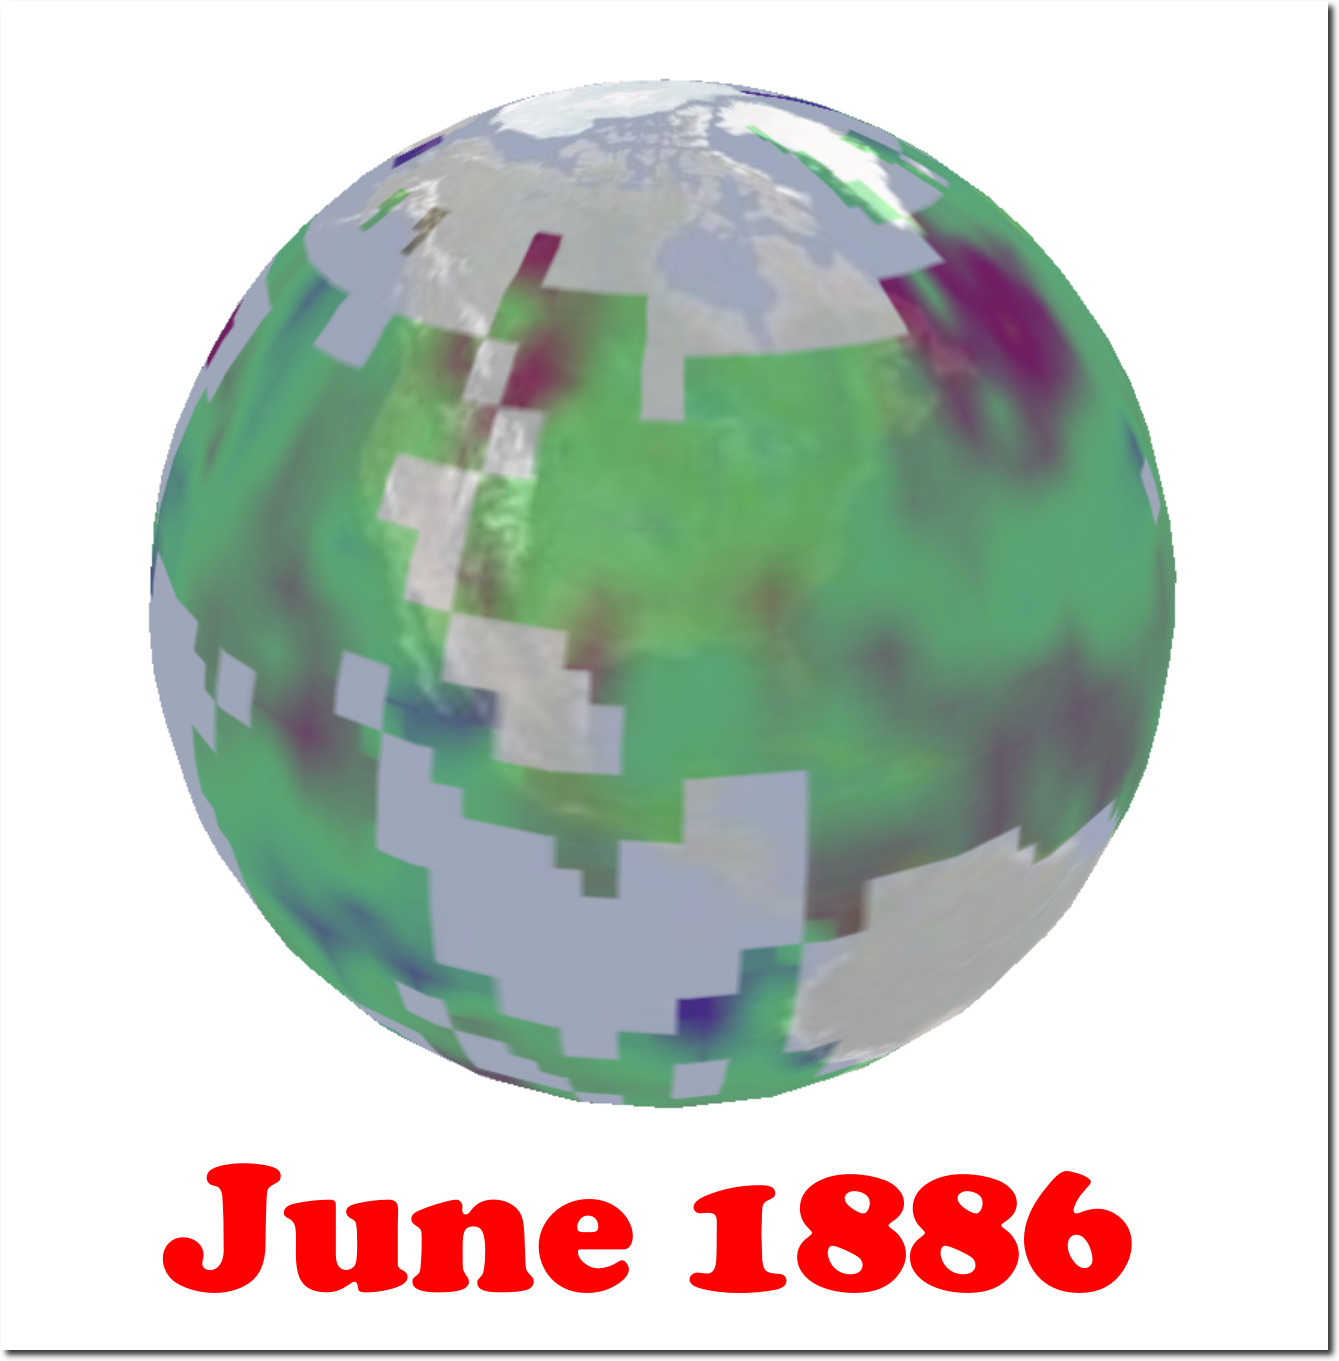
And they show last June as being much warmer, yet there were no hurricanes last June.

Prior to about fifteen years ago, few people pretended to know pre-1950 ocean temperatures. But now they simply make a lot of the data up.
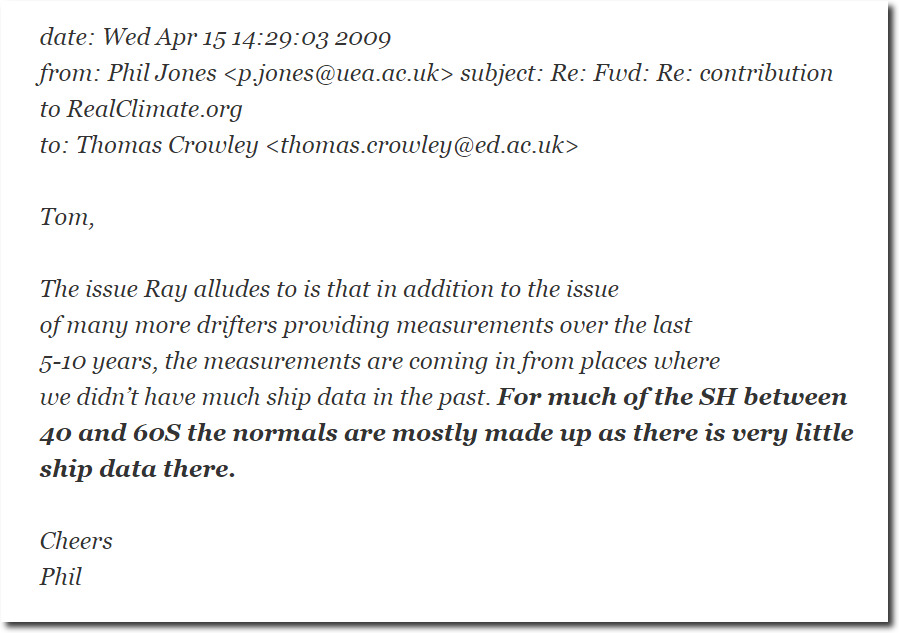
di2.nu/foia/foia2011/mail/2729.txt
The oceans make up two thirds of the global temperature record, and the data is completely unreliable. So basically the same as the land data.
NASA shows land temperatures rising sharply from 1880 to 1899, and they show ocean temperatures falling during that same twenty year period.
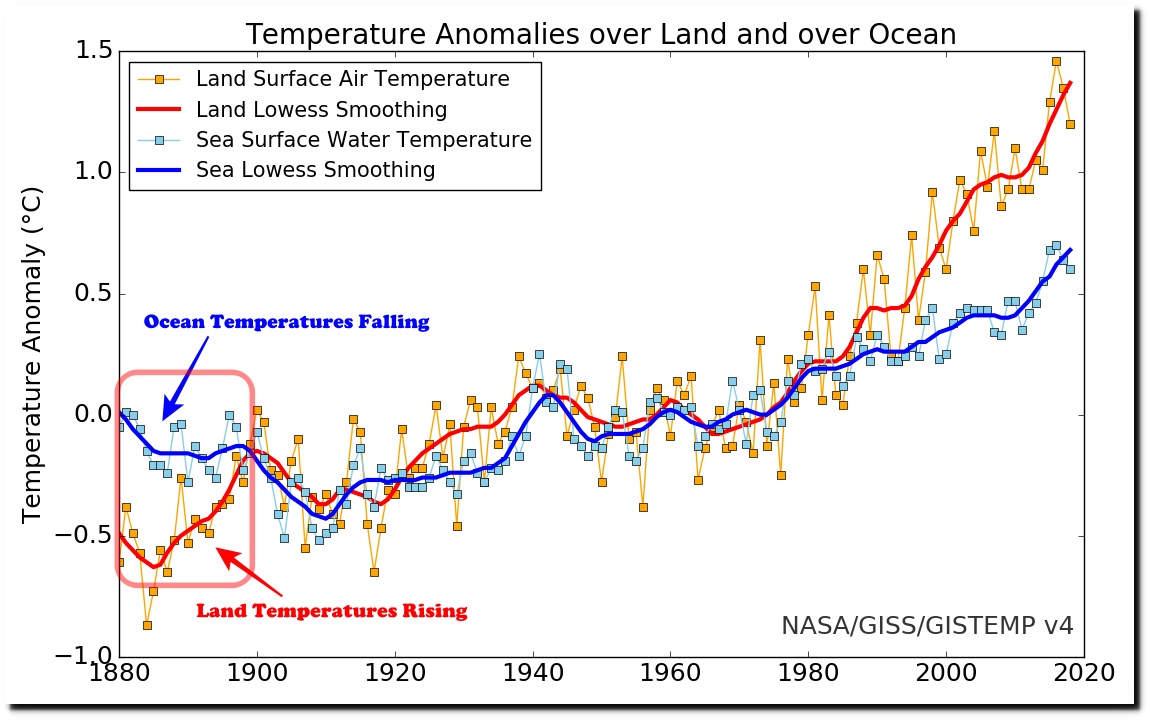
Does anyone actually believe there could be a divergence like that for two decades? But no worries, the ocean data is mostly made up.
di2.nu/foia/foia2011/mail/2729.txt
Prior to about 15 years ago, NASA didn’t even pretend to know pre-1950 ocean temperatures.


