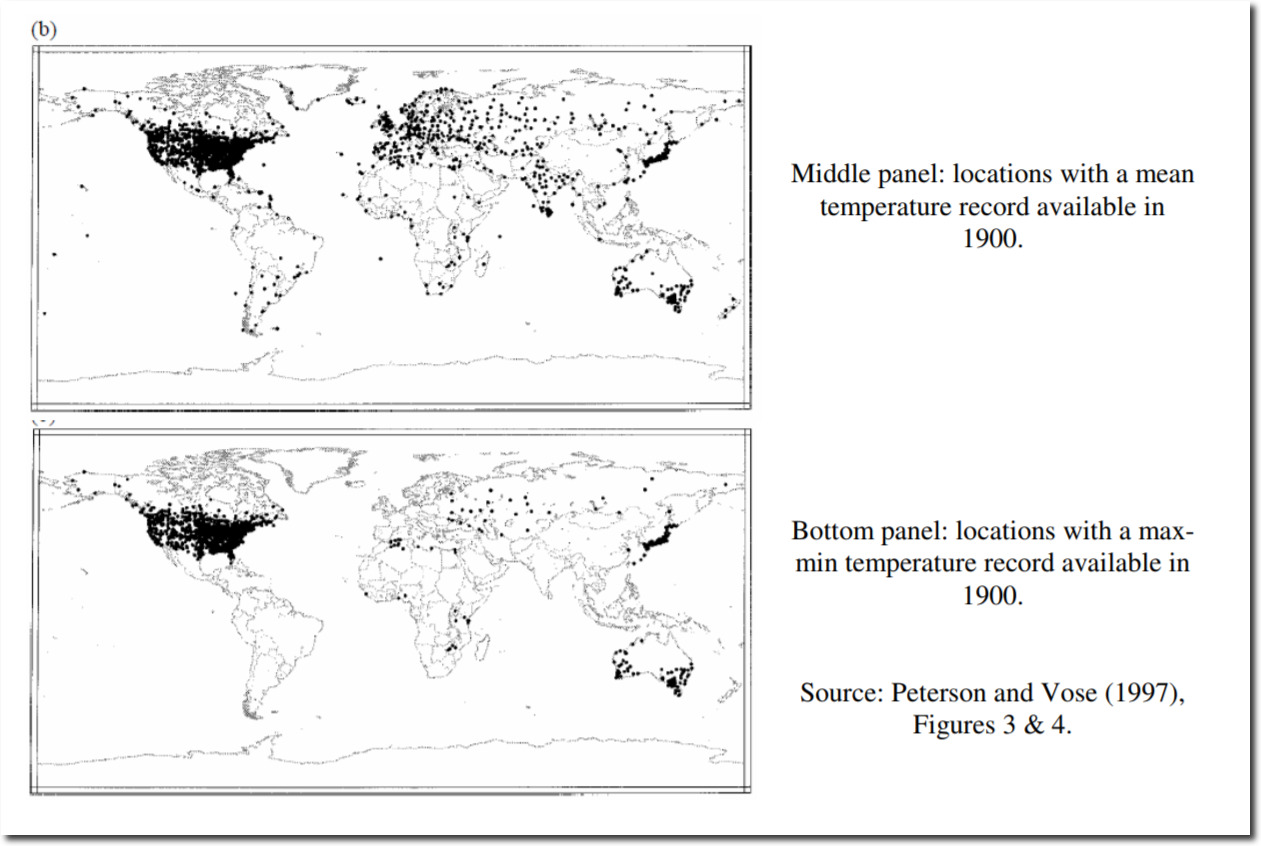
The vast majority of high quality long-term temperature data comes from the US, and in fact much of the planet has little or no long-term temperature data. Because of the poor coverage, it is doubtful that the published global temperature record has any scientific validity. The US is one of very few places with reliable temperature data.
A Critical Review of Global Surface Temperature Data Products by Ross McKitrick :: SSRN
In 1986, NASA’s top climate scientist James Hansen predicted the US would heat up 4-6 degrees by 2020 (next year.)
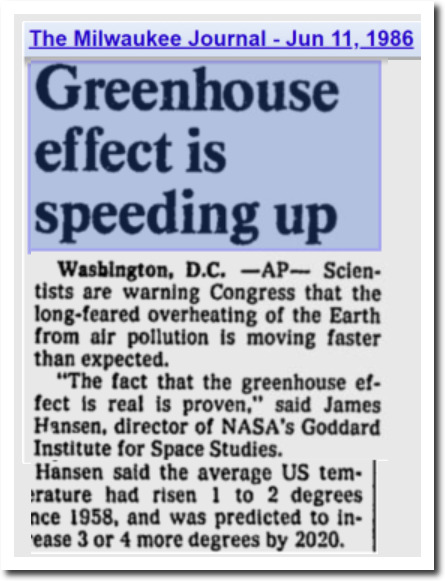
The Milwaukee Journal – Google News Archive Search
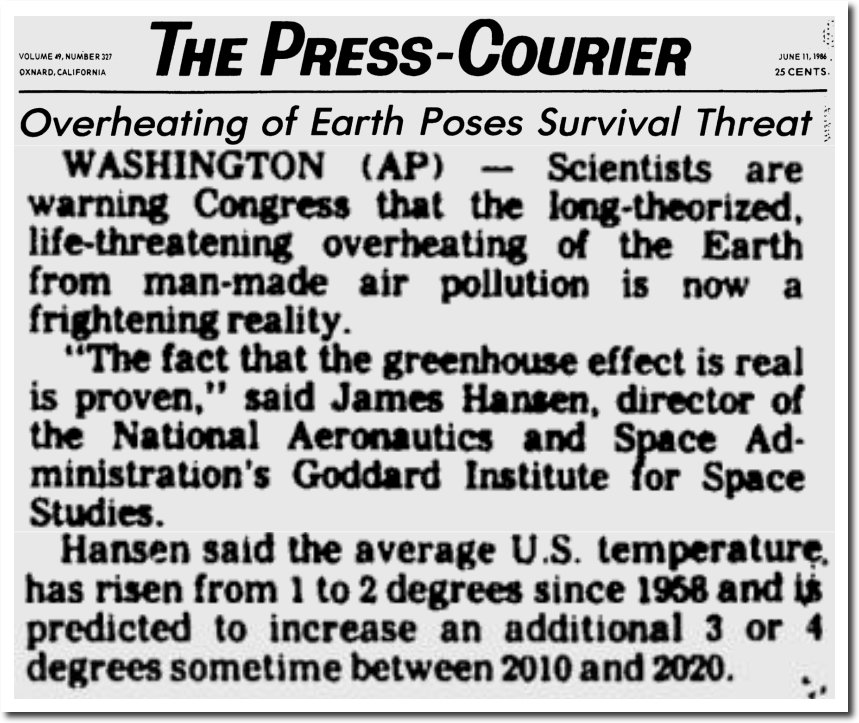
The Press-Courier – Google News Archive Search
But three years later, NOAA reported that there had been no warming in the US over the past century
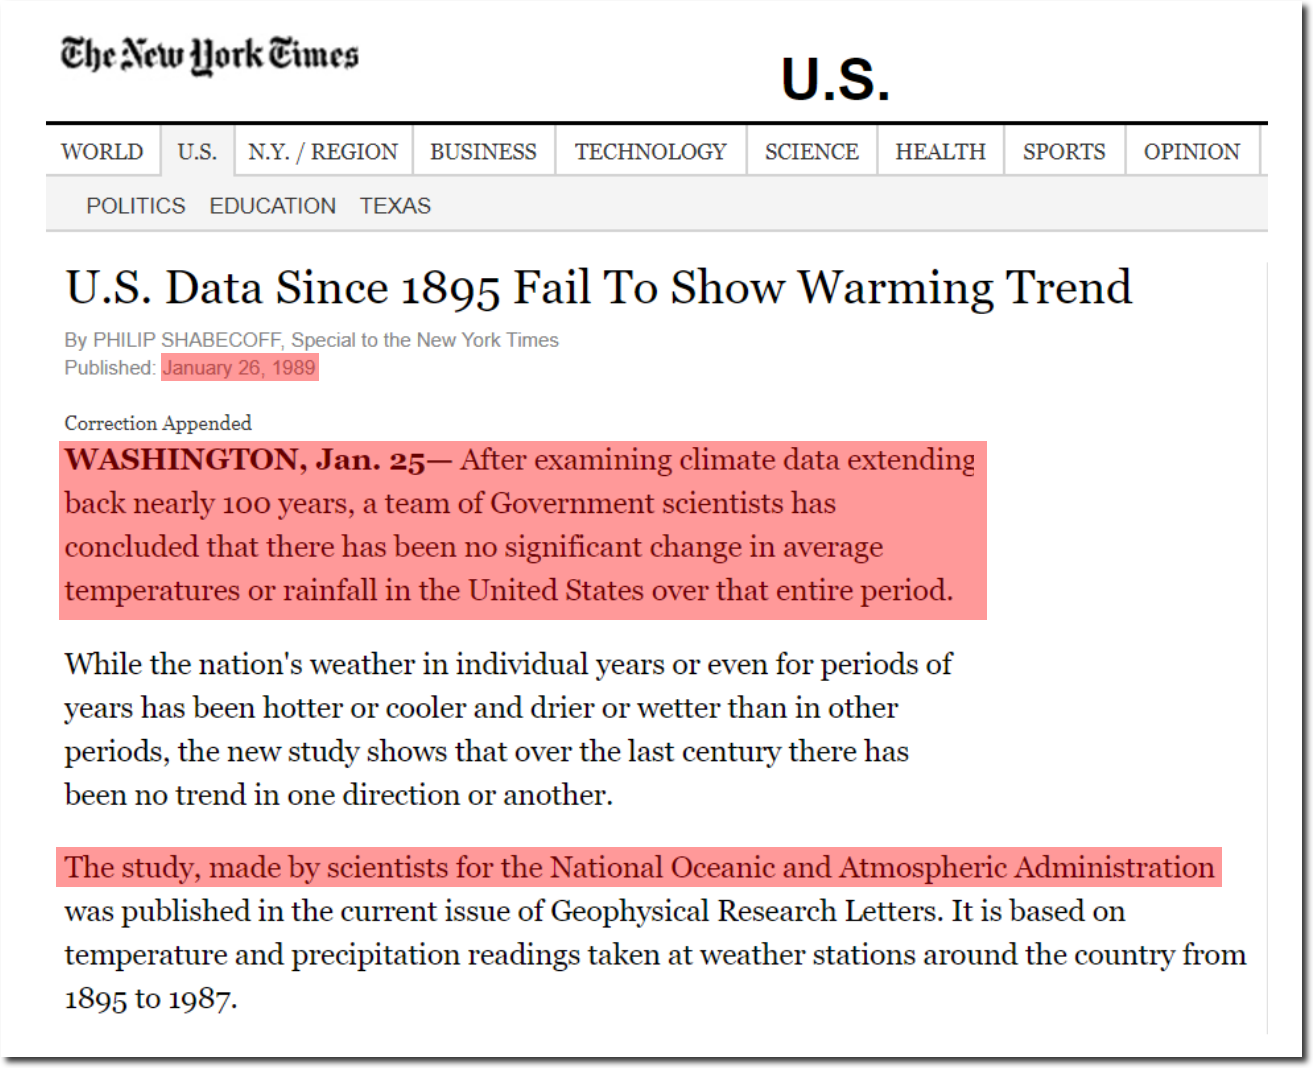
U.S. Data Since 1895 Fail To Show Warming Trend – NYTimes.com
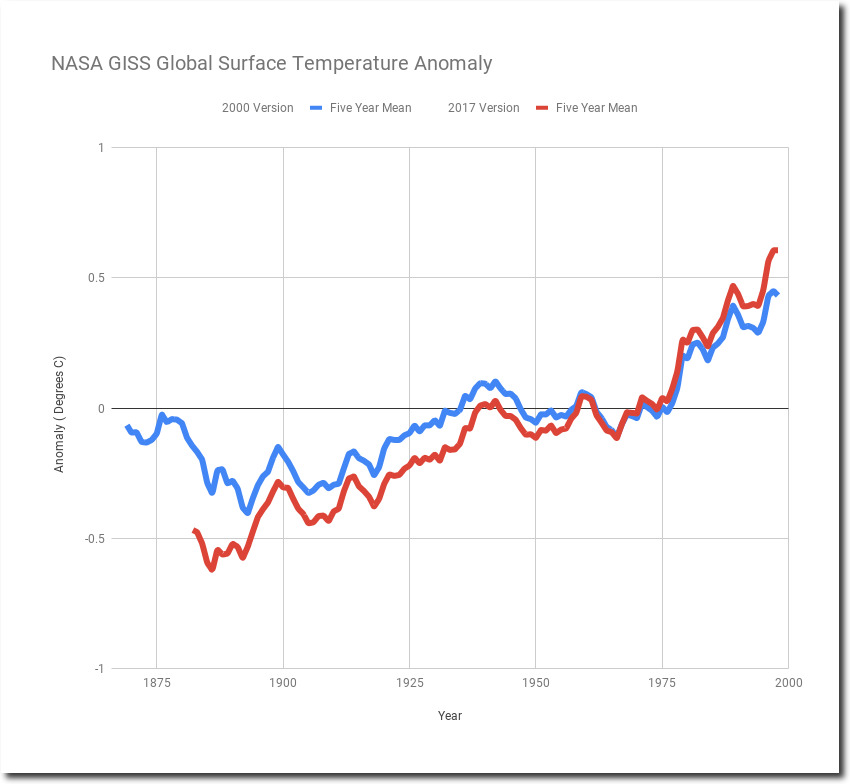
And by 1999, Hansen’s US temperature data (left graph below) showed cooling since the 1940s.
in the U.S. there has been little temperature change in the past 50 years, the time of rapidly increasing greenhouse gases — in fact, there was a slight cooling throughout much of the country
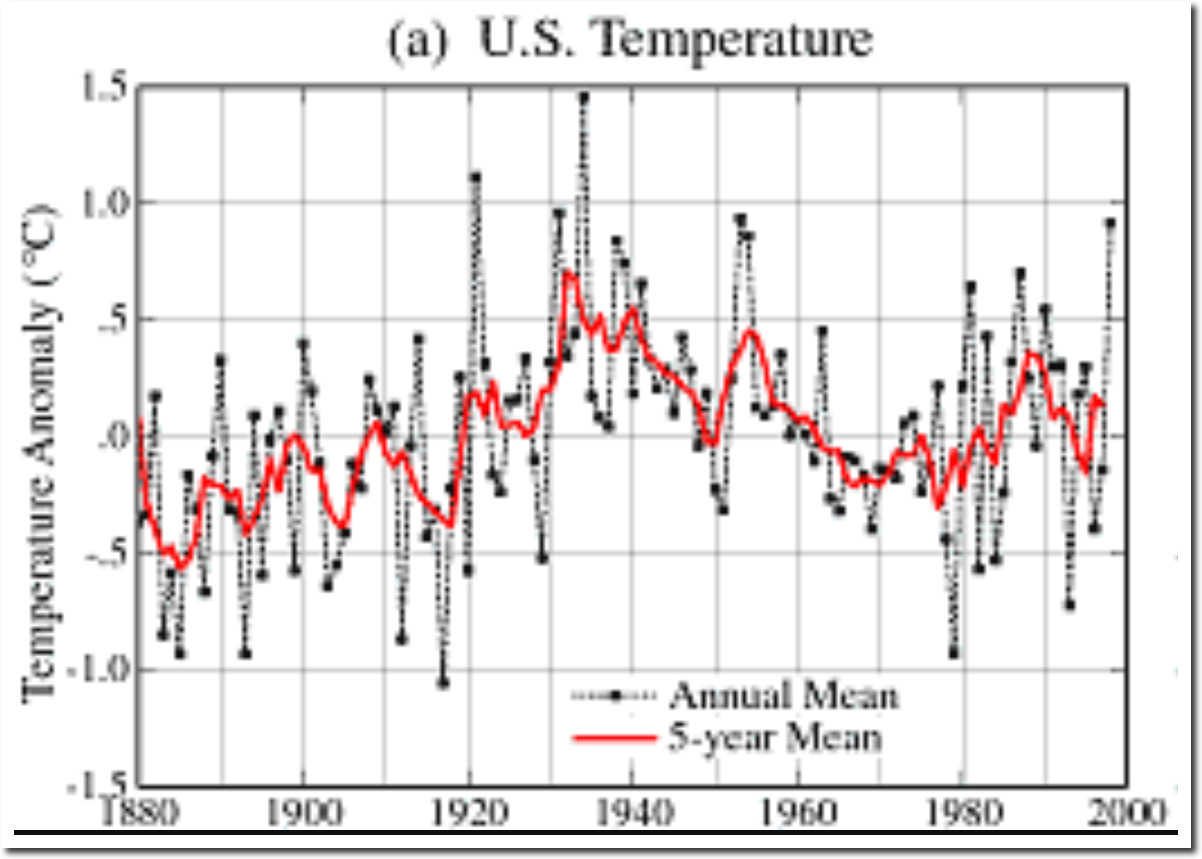
NASA GISS: Science Briefs: Whither U.S. Climate?
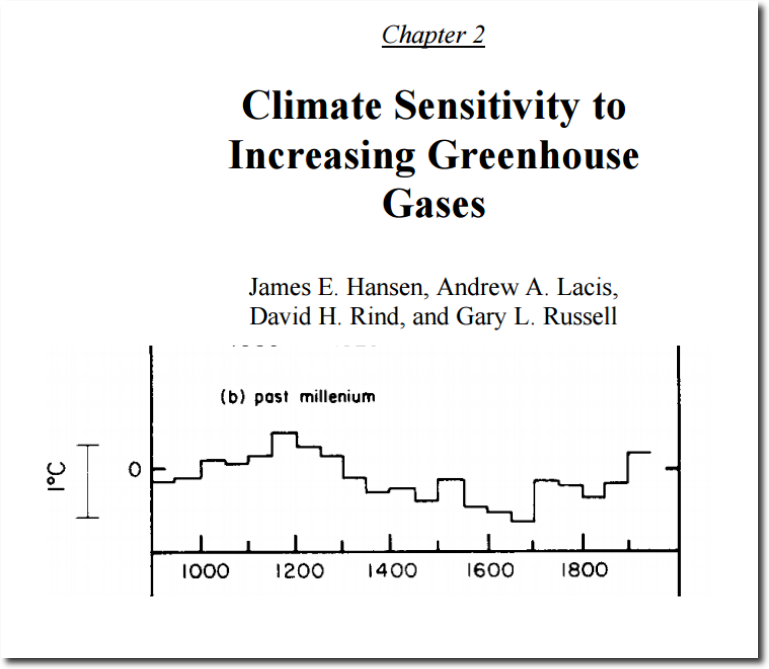
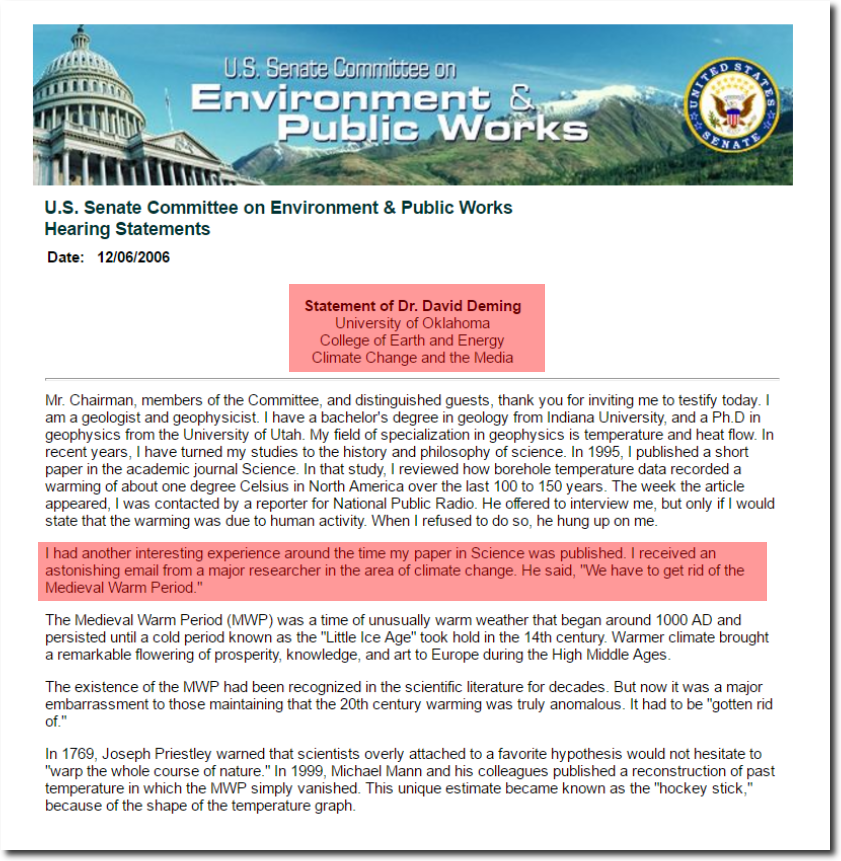
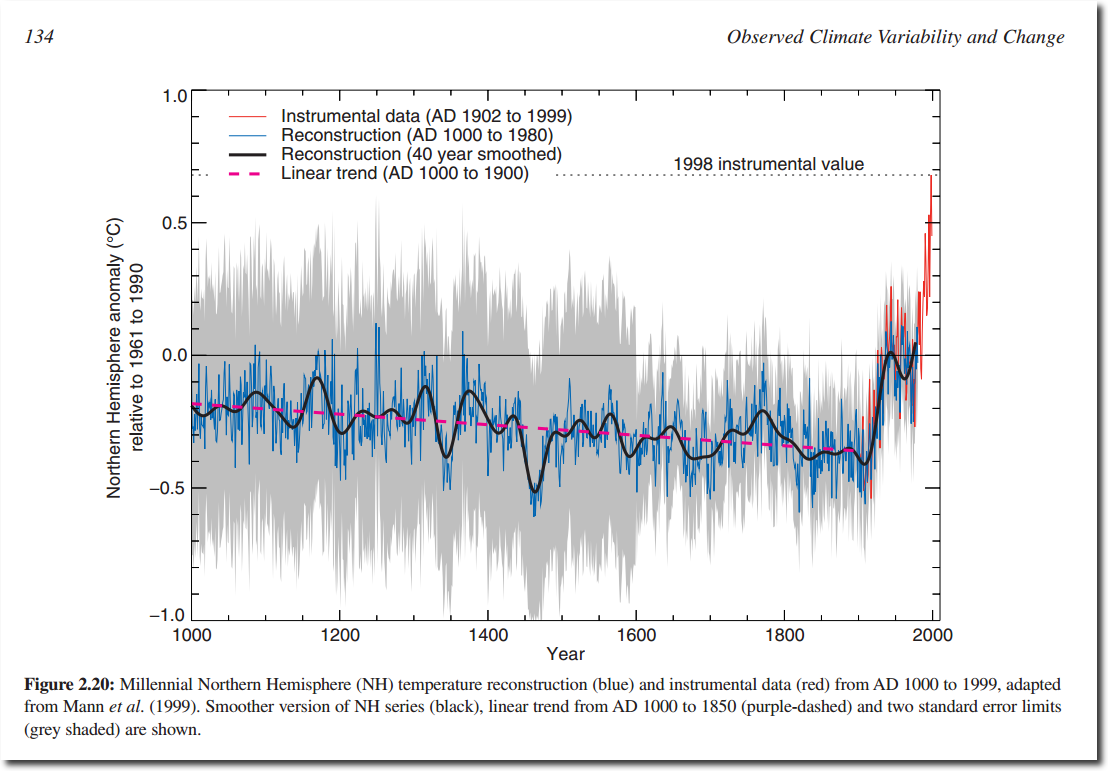
This was very disturbing to both NASA and NOAA. Their CO2 warming theory was failing badly, so they simply changed the data, turning cooling into warming. This happened at the same time Michael Mann was erasing the Medieval Warm Period.
NASA 1999 NASA 2016
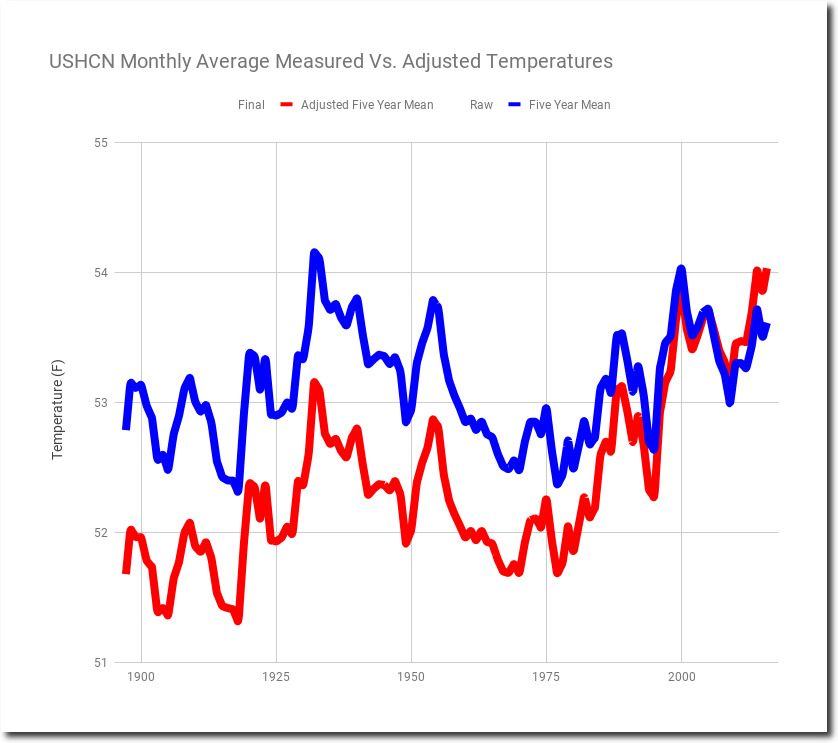
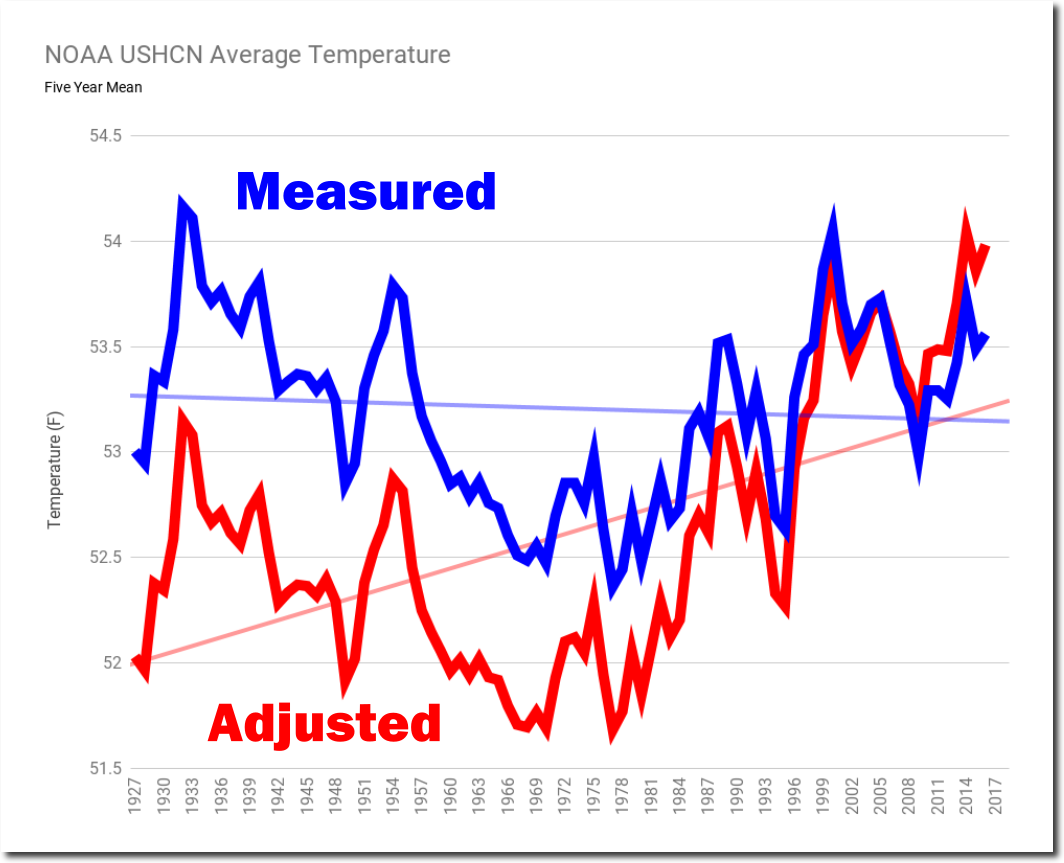
The blue line below shows the five year mean of the average annual temperature at all NOAA United States Historical Climatology Network Stations. The red line shows the graph they release to the public, and has been highly altered to create the appearance of warming – which does not exist in the thermometer data.
Spreadsheet Data
If they believe there is error in the data, the correct way to handle it is to leave the data intact, and put error bars on it. Not alter the data and pass it to the public as if it represents the actual thermometer data.
The next graph shows the adjustments they are making, which creates a spectacular hockey stick of data tampering since the 1960s.
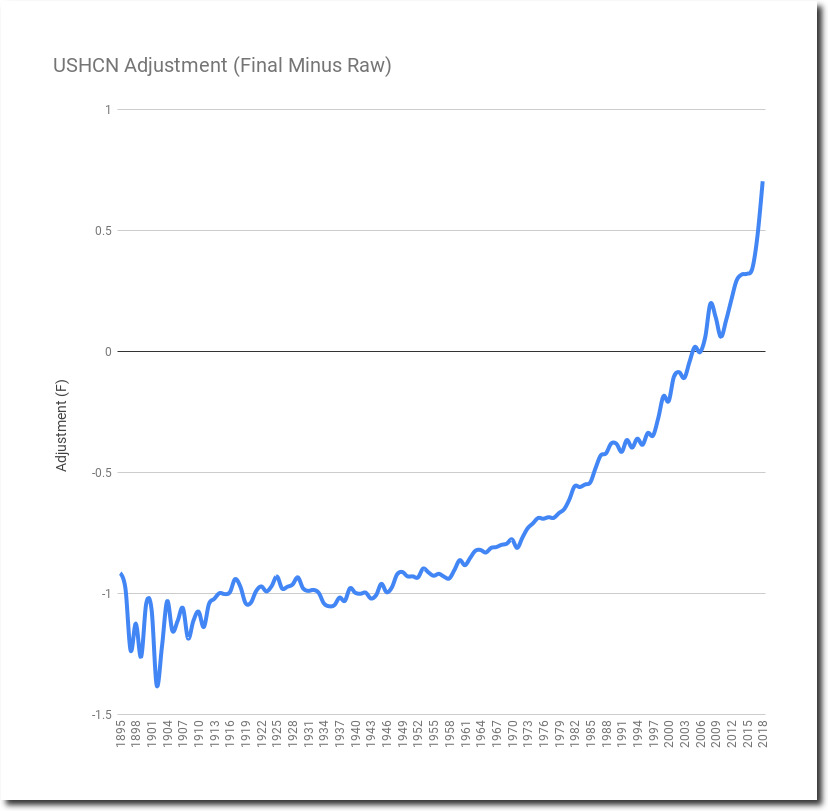
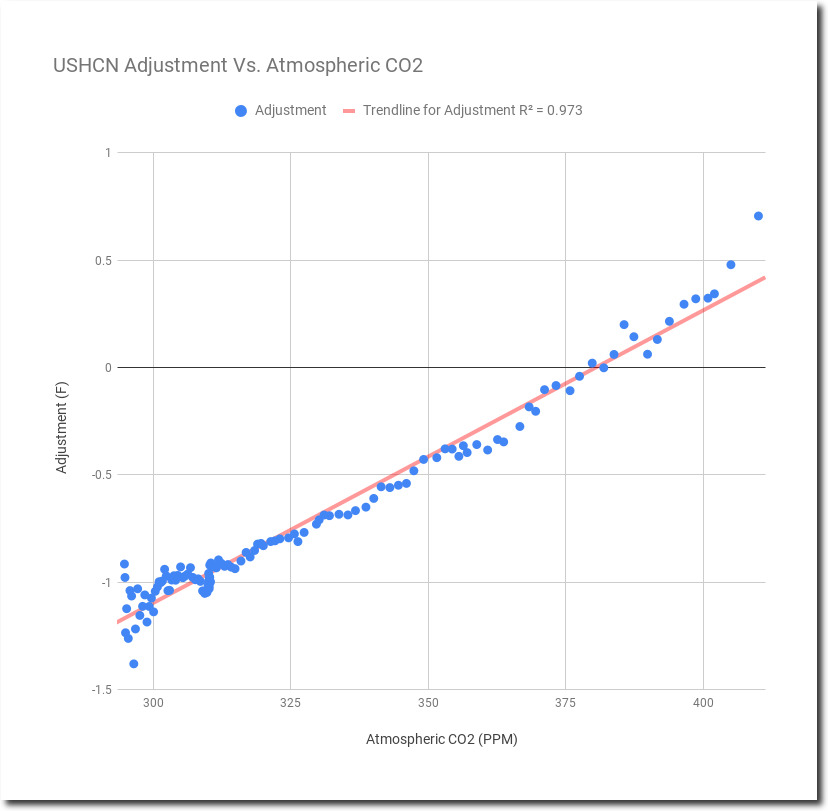
Plotted with atmospheric CO2 on the X-axis instead of time, it becomes apparent that the data is being altered precisely (R² = 0.97) to match global warming theory. The ultimate junk science.
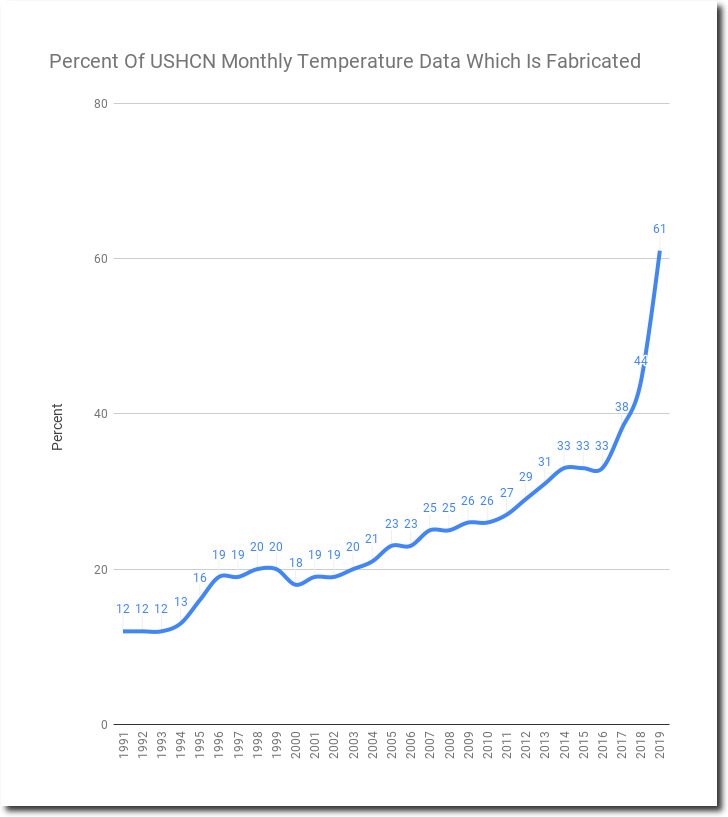
Most of the recent data tampering has been due to simply making data up. In their monthly temperature data, they mark estimated (as opposed to measured) temperatures with a capital “E.” So far in 2019, sixty-one percent of the monthly temperature data is now estimated by a computer model, rather than actual measured thermometer data. The amount of fake data is up 500% since 30 years ago.
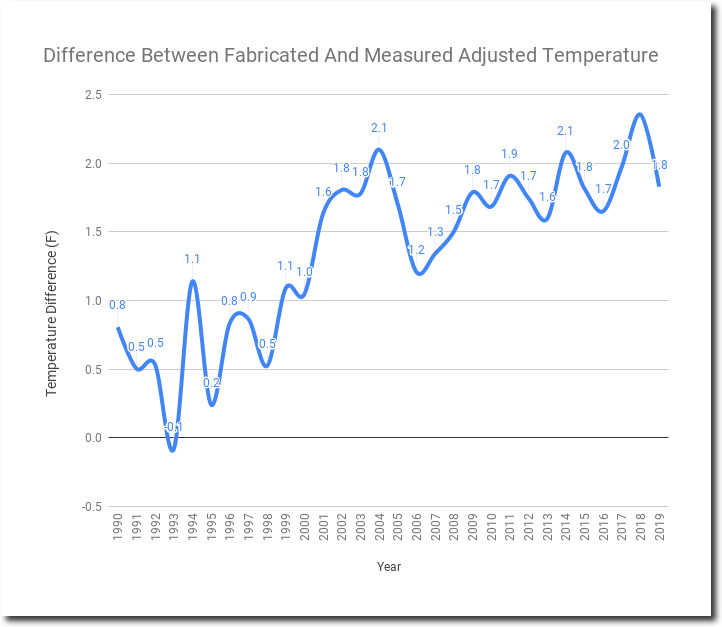
I grouped the NOAA adjusted temperatures into two groups:
- Measured and adjusted (blue)
- Estimated (red)
Almost all of the US warming since 1990 is due to fake data from computer models, which now makes up 60% of the data.
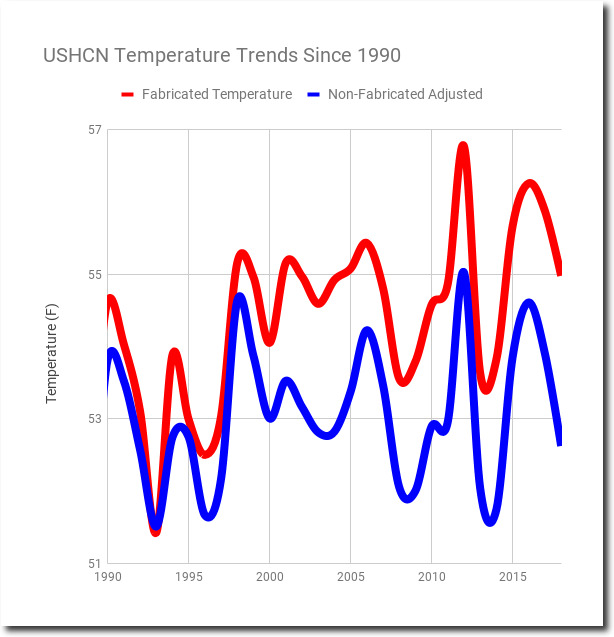
The fake data is running two degrees warmer than the measured adjusted data. Not hard to create warming when you are simply making the data up.
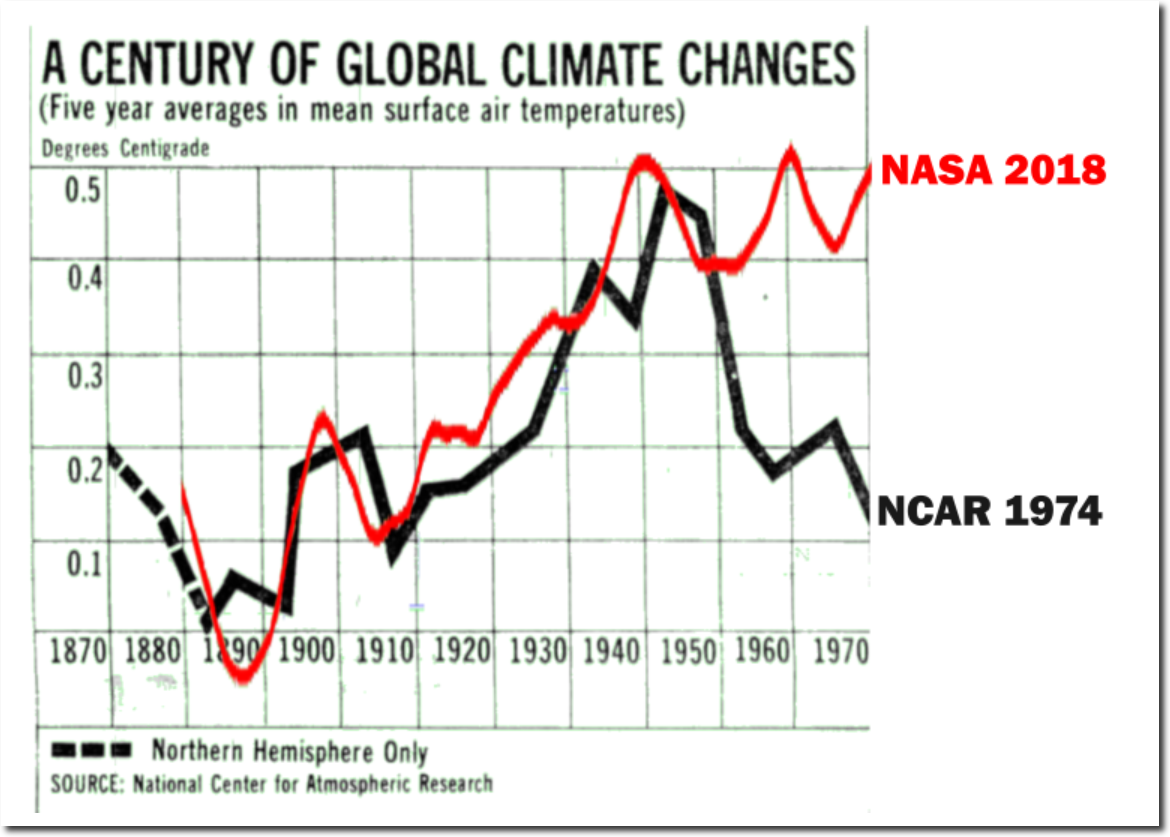
Climate scientists openly discussed getting rid of the 1940s warmth, and they did just that.

di2.nu/foia/1254108338.txt
But even with all their data tampering, the fraudsters couldn’t come close to to Hansen’s six degrees warming by 2020. Of course they still has a few more months to heat the US up six degrees.
The Press-Courier – Google News Archive Search
They may be having some success tonight. All the hot air from the “Green New Deal” seems to be melting the snow around Washington DC.
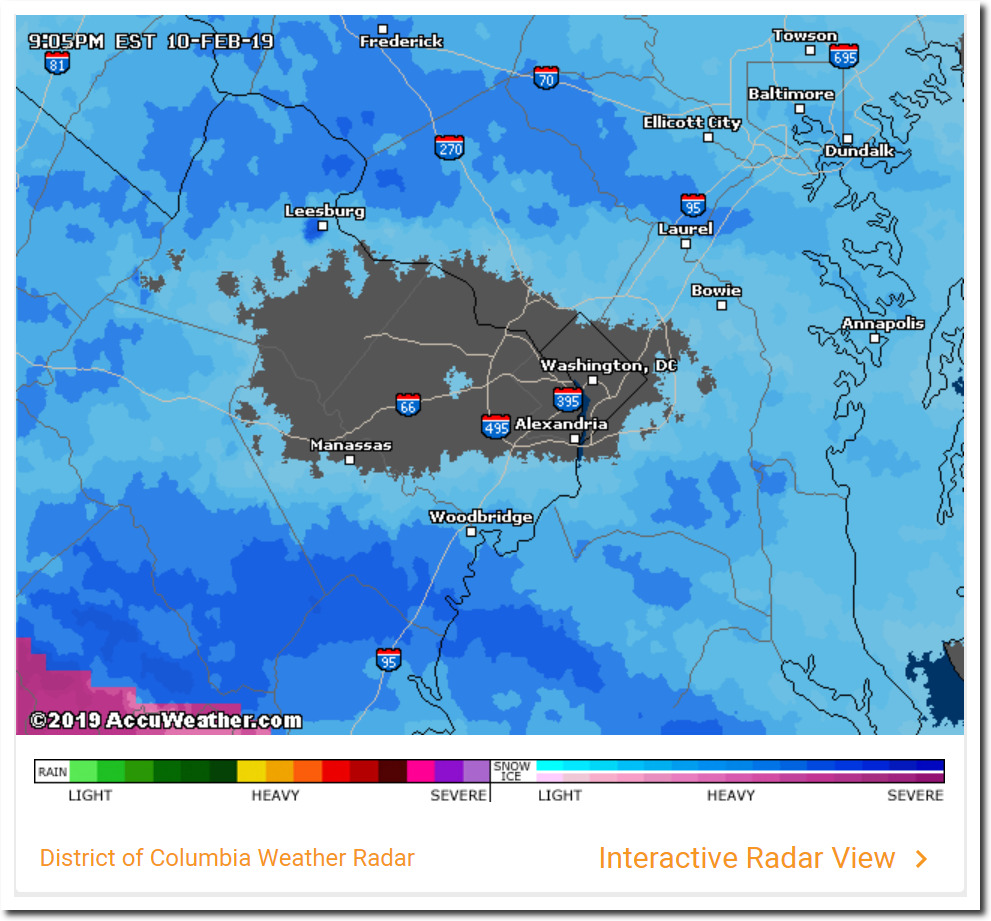
District of Columbia Doppler Weather Radar Map – AccuWeather.com
There is overwhelming evidence of fraud in NOAA and NASA’s handling of climate data, and it is very important they are held to account.


