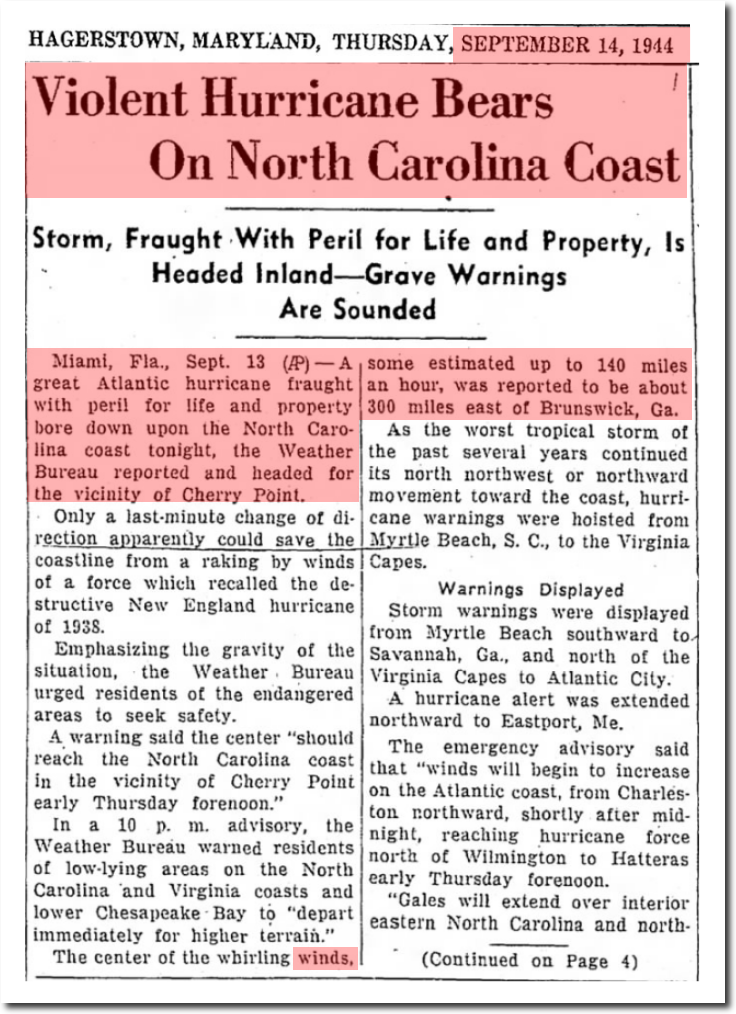
Your task is to identify which one was caused by President Trump.
Your task is to identify which one was caused by President Trump.


Oriental, NC US OrientalNCnc4cbCAM1 | Weather Underground
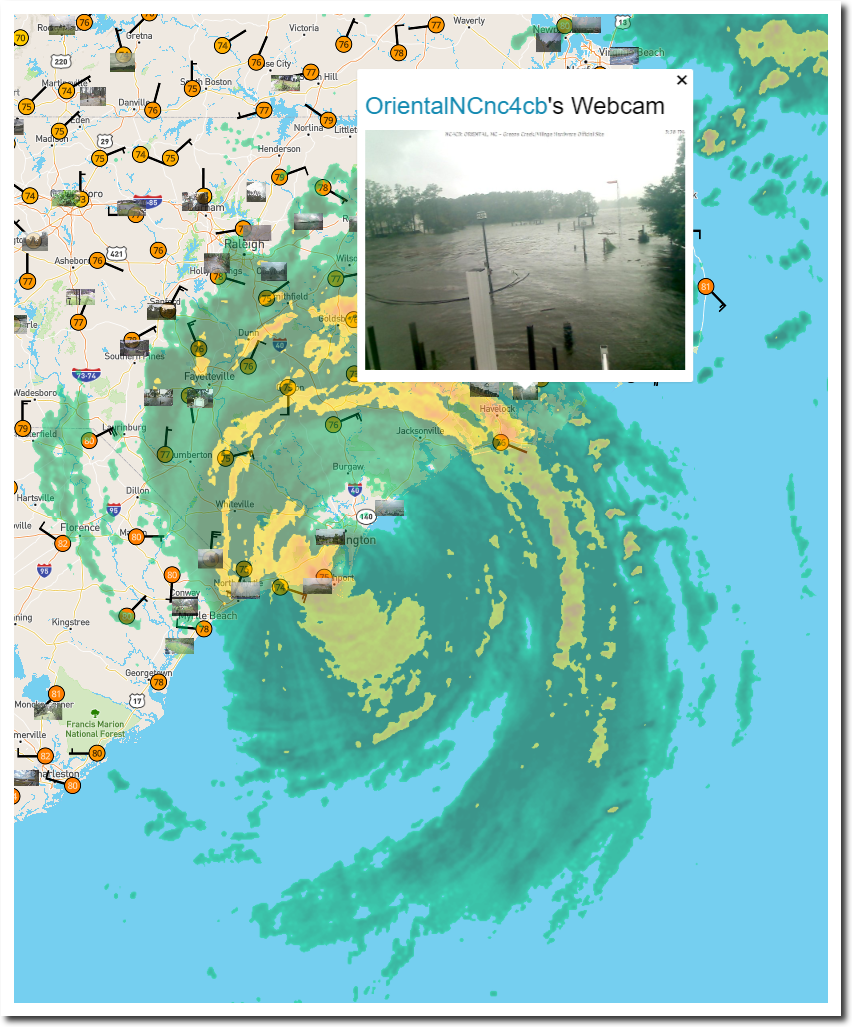
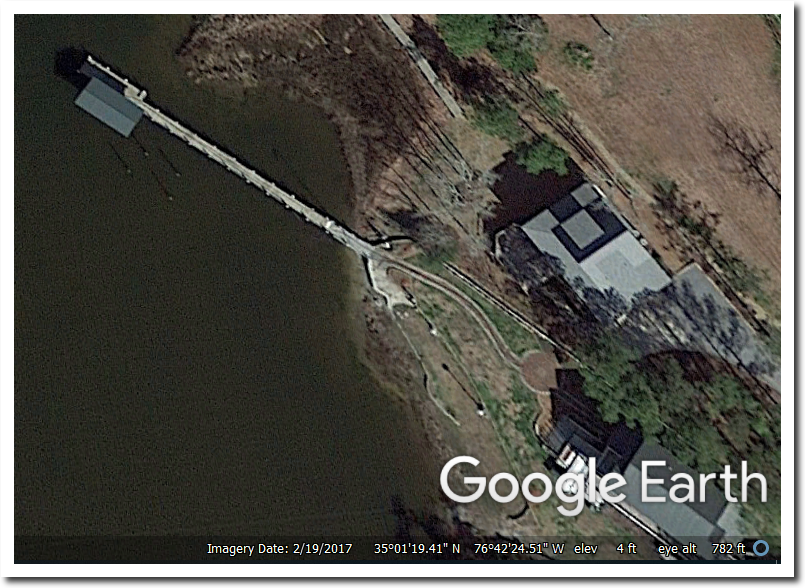
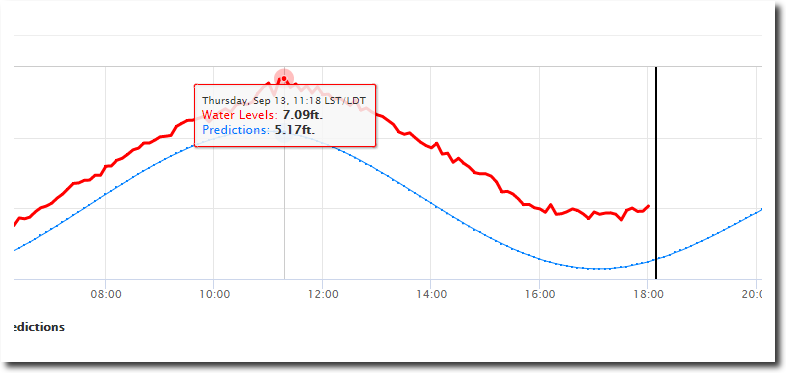
The circle on the path is at 4 feet elevation.
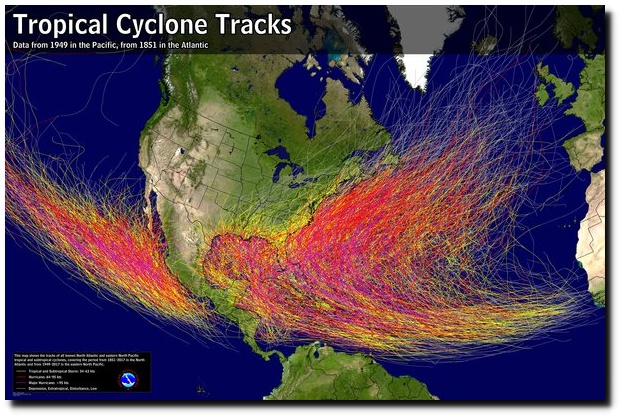
North Carolina has been hit by 56 hurricanes since 1851, including six from 1953 to 1955 – but according to the Washington Post, the next one is President Trump’s fault.
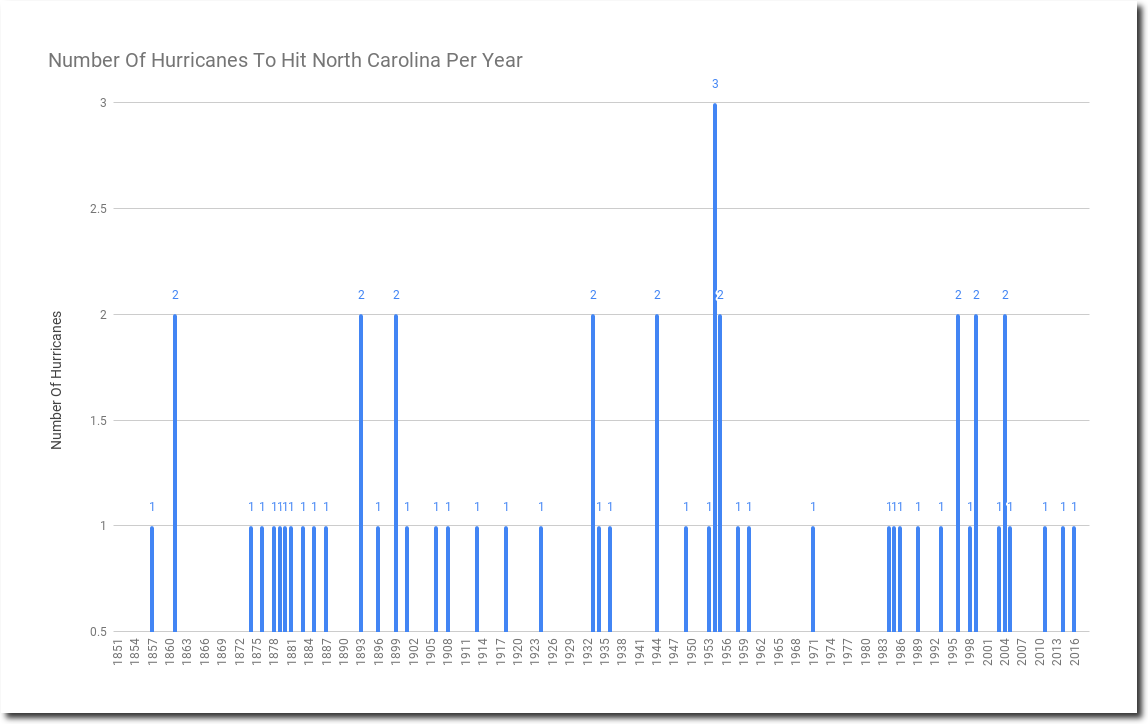
http://www.aoml.noaa.gov/hrd/hurdat/All_U.S._Hurricanes.html
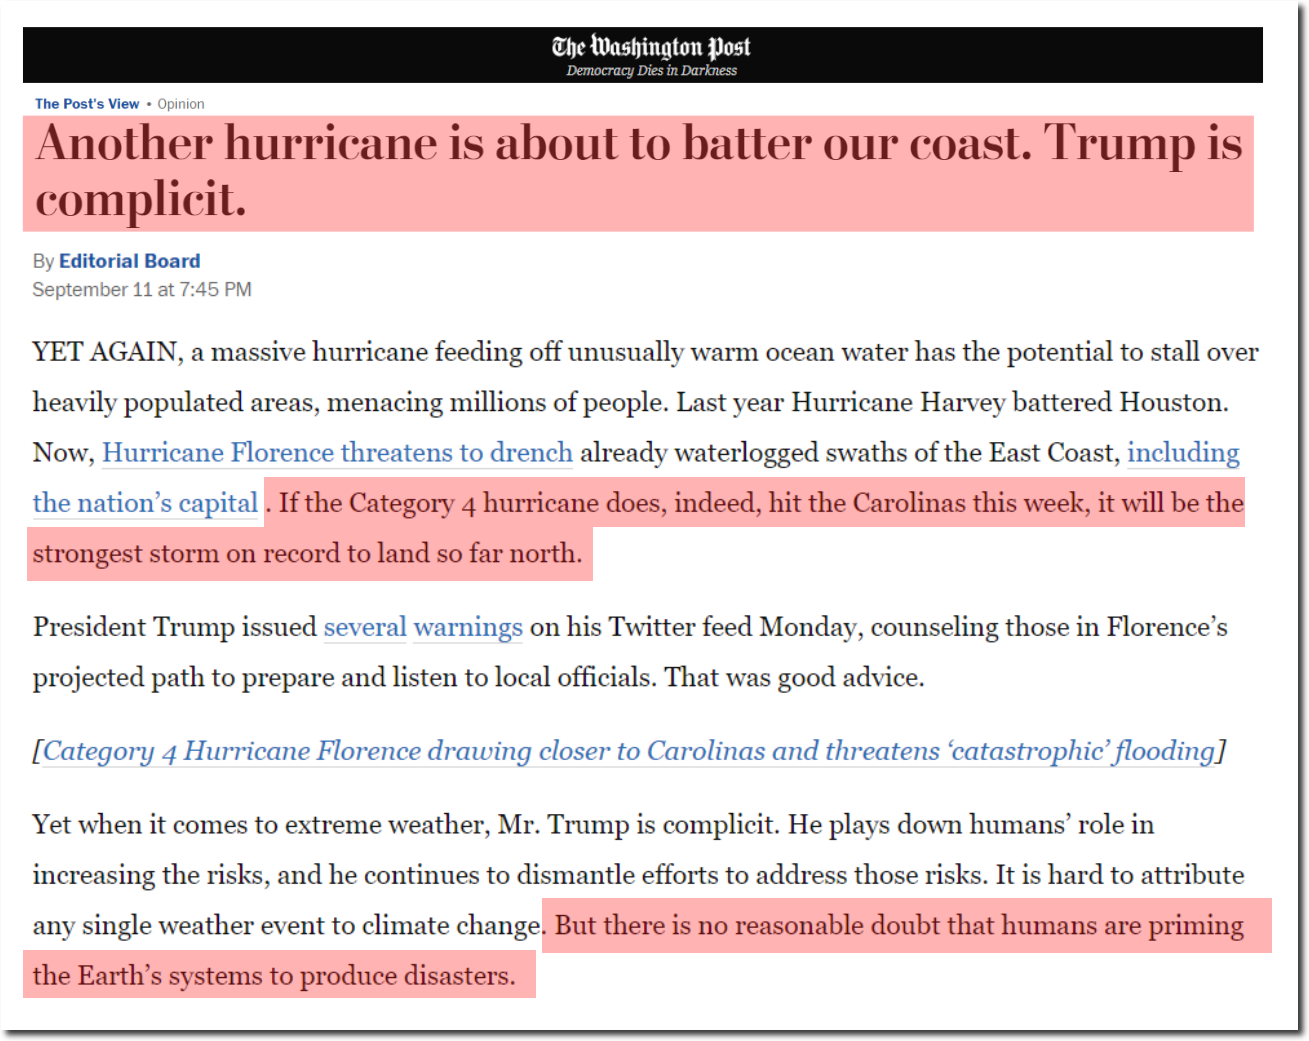
If Trump cares about Hurricane Florence, his policies don’t show it – The Washington Post
Who controls the past controls the future. Who controls the present controls the past.
George Orwell “1984”
NOAA claims the past summer in the US was fourth hottest on record, and tied with 1934.
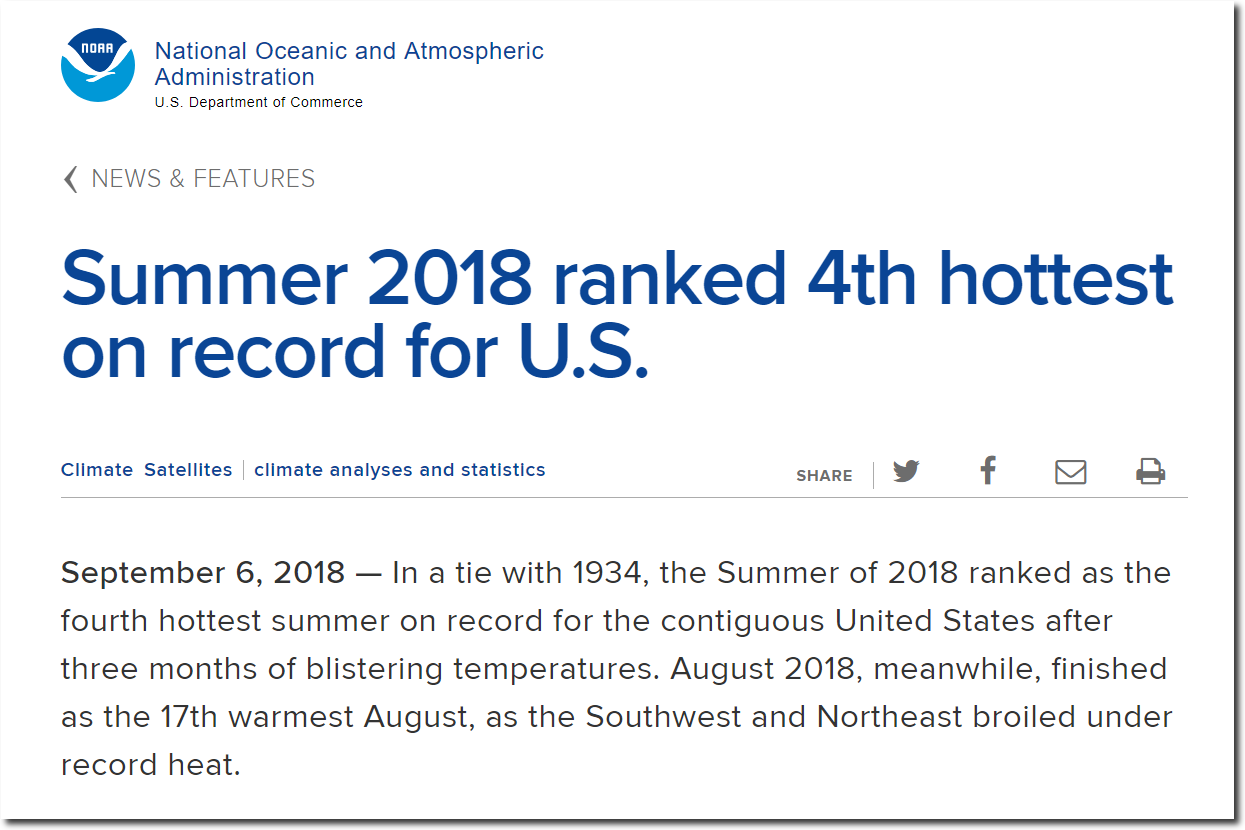
Summer 2018 ranked 4th hottest on record for U.S. | National Oceanic and Atmospheric Administration
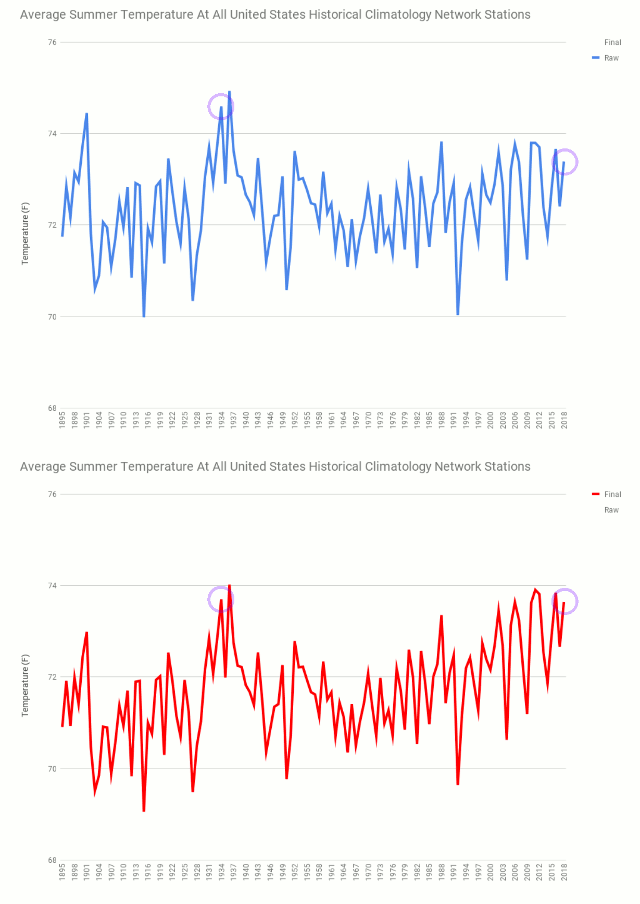
The NOAA claims are not even remotely credible. The animation below shows the spectacular data tampering being committed by the National Oceanic and Atmospheric Administration to create this fake news. They turn a long term summer cooling trend into a warming trend, by altering the data. NOAA massively cooled 1934, while warming 2018 to bring them to parity.
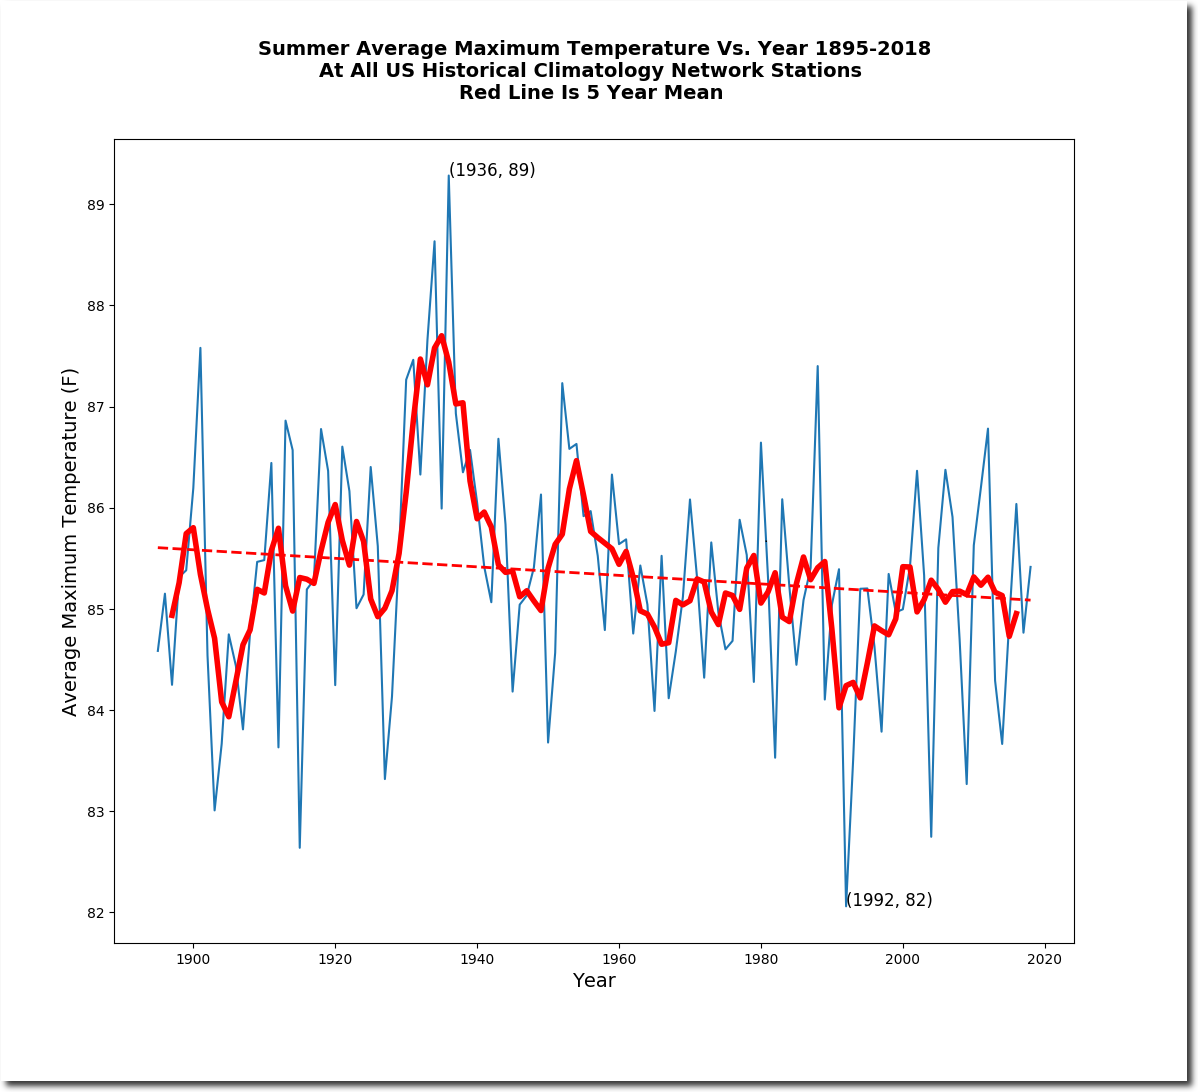
The average maximum temperature this summer at all 1,218 NOAA USHCN stations was 56th warmest since 1895.
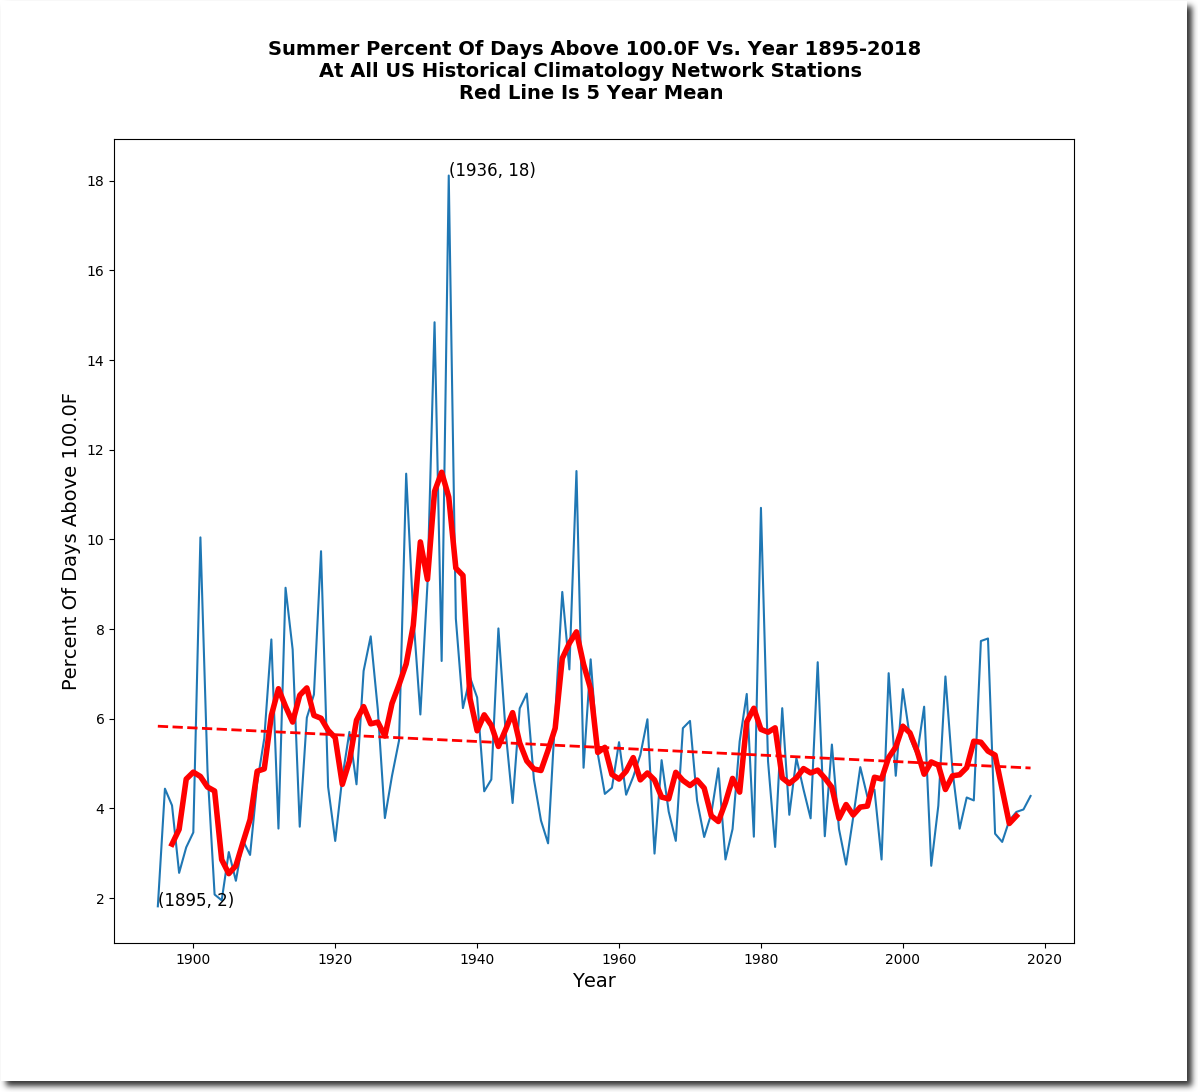
The percent of days over 100 degrees this summer was 78th highest since 1895.
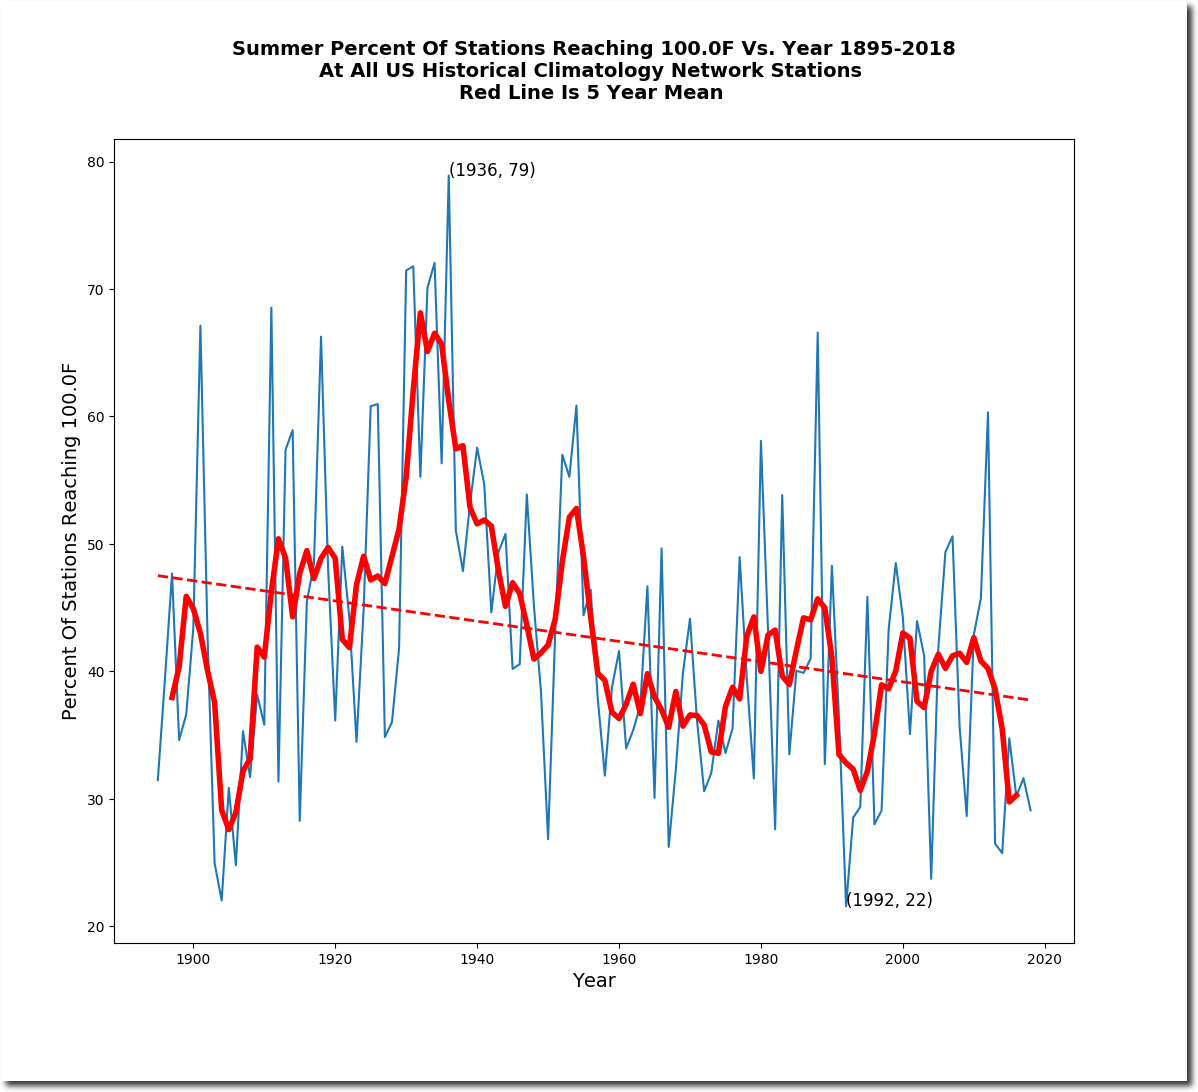
The percent of stations to reach 100 degrees sometime during the summer was close to the lowest on record.
The percent of days over 95 degrees this summer was 85th highest since 1895.

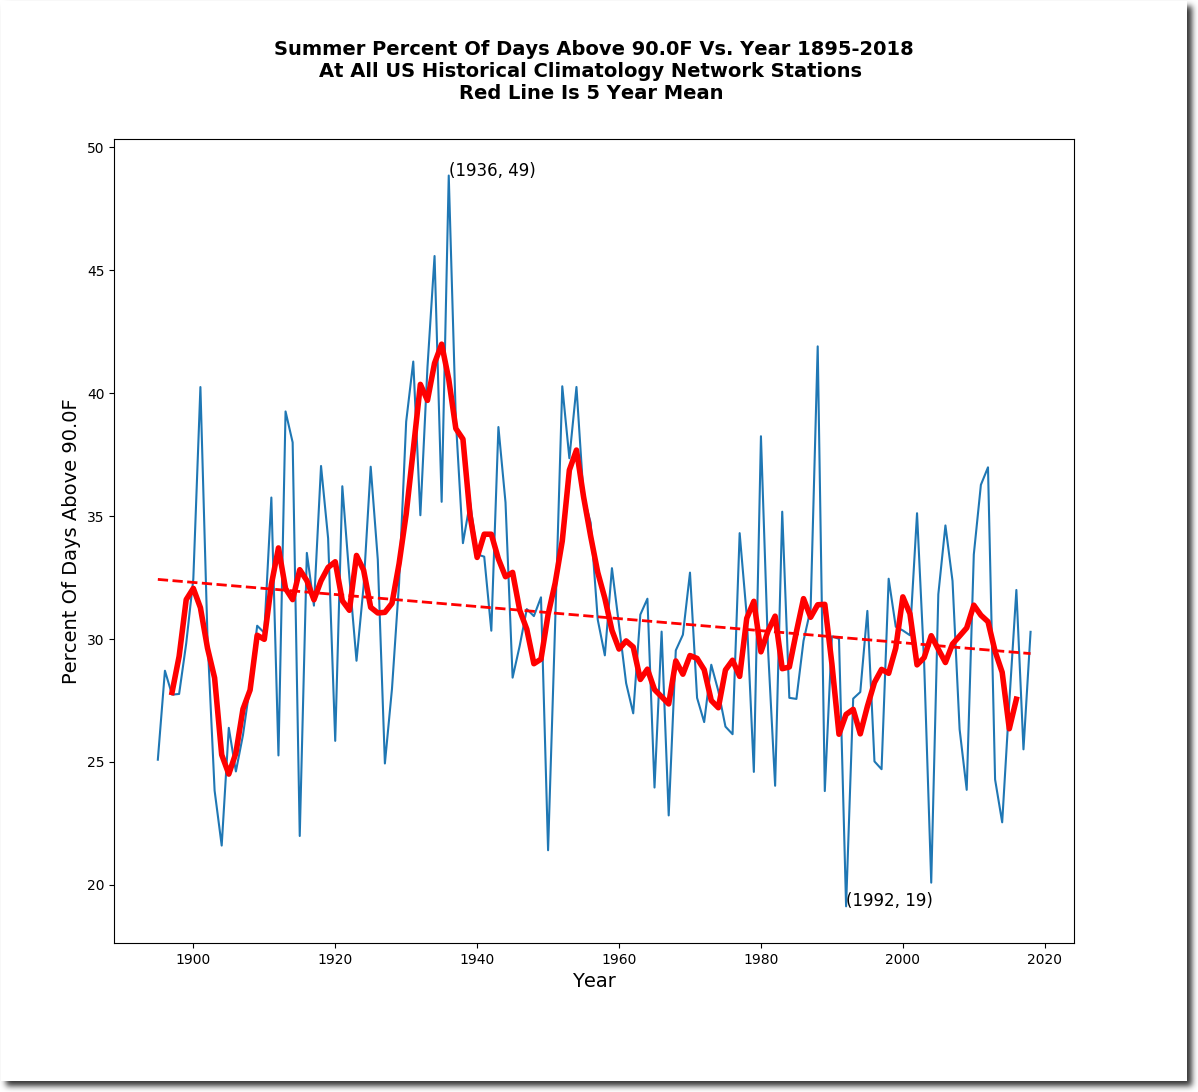
The percent of days over 90 degrees this summer was 66th highest since 1895.
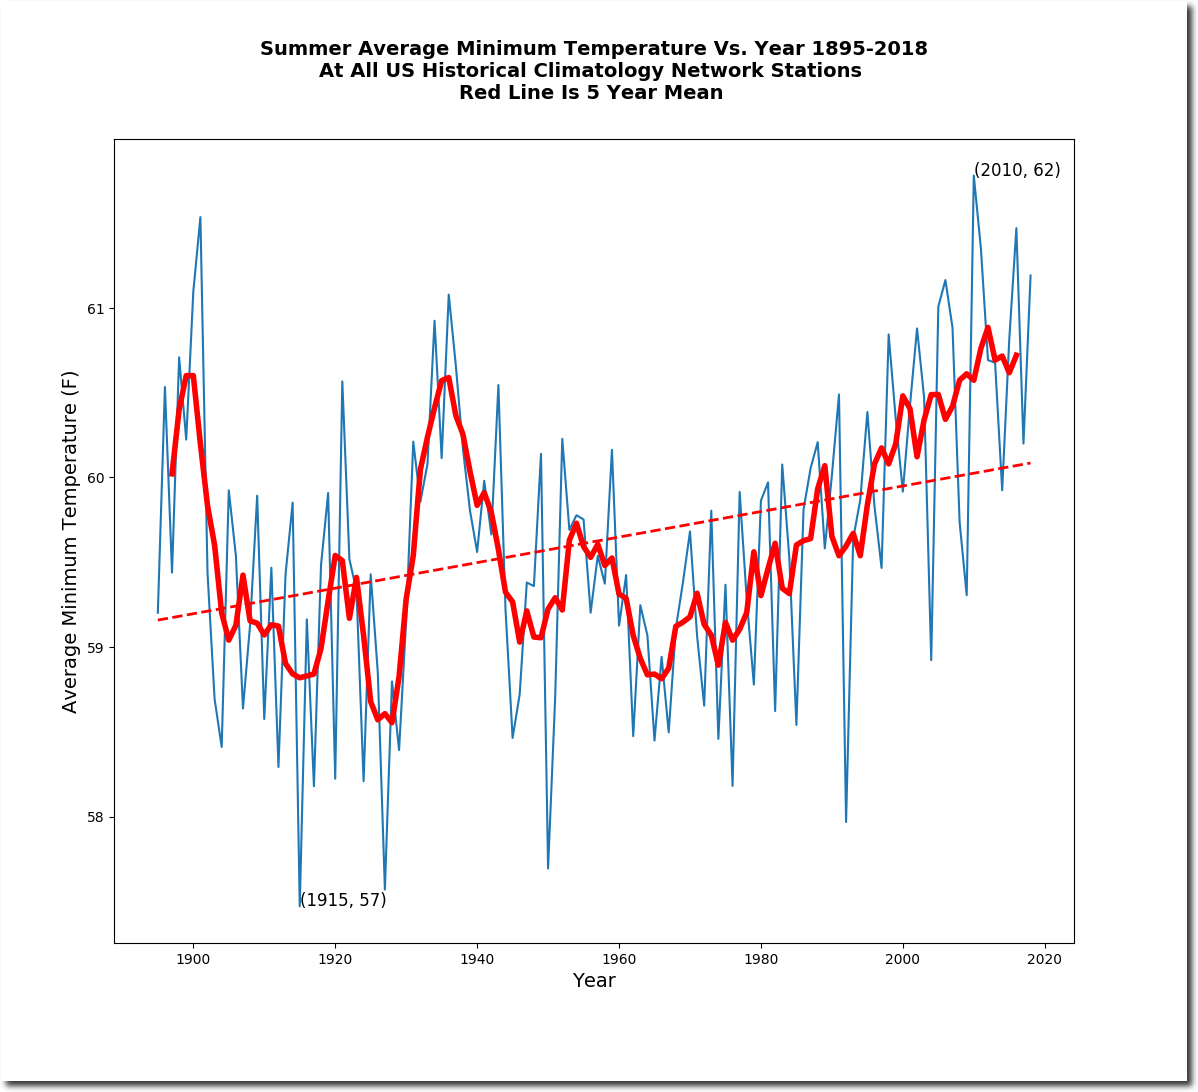
The average minimum temperature was fourth highest, at a blistering 61 degrees. Most people don’t consider 61 degrees to be hot.
The average mean temperature wasn’t in the top ten.

NOAA created the imaginary heat by tampering with the data. The measured average (minimum and maximum temperature) was much cooler than 1934.
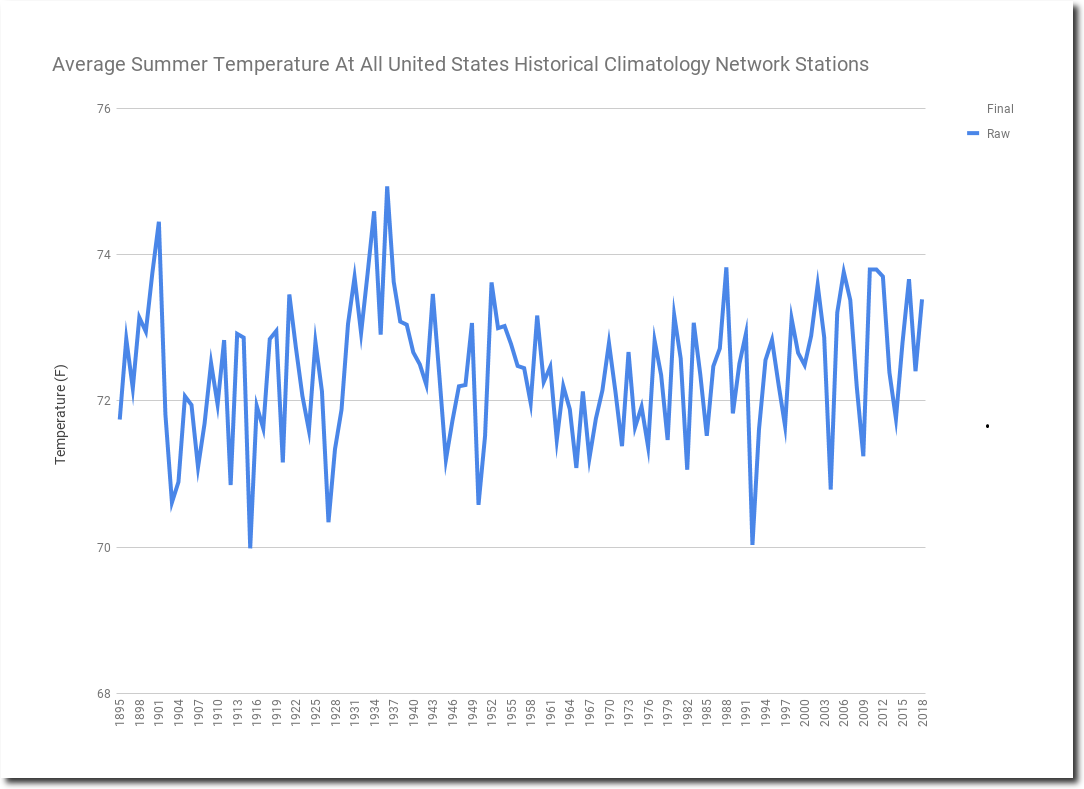
ftp://ftp.ncdc.noaa.gov/pub/data/ushcn/v2.5/ushcn.tavg.latest.raw.tar.gz
But NOAA tampered with the data to make 2018 just as warm.
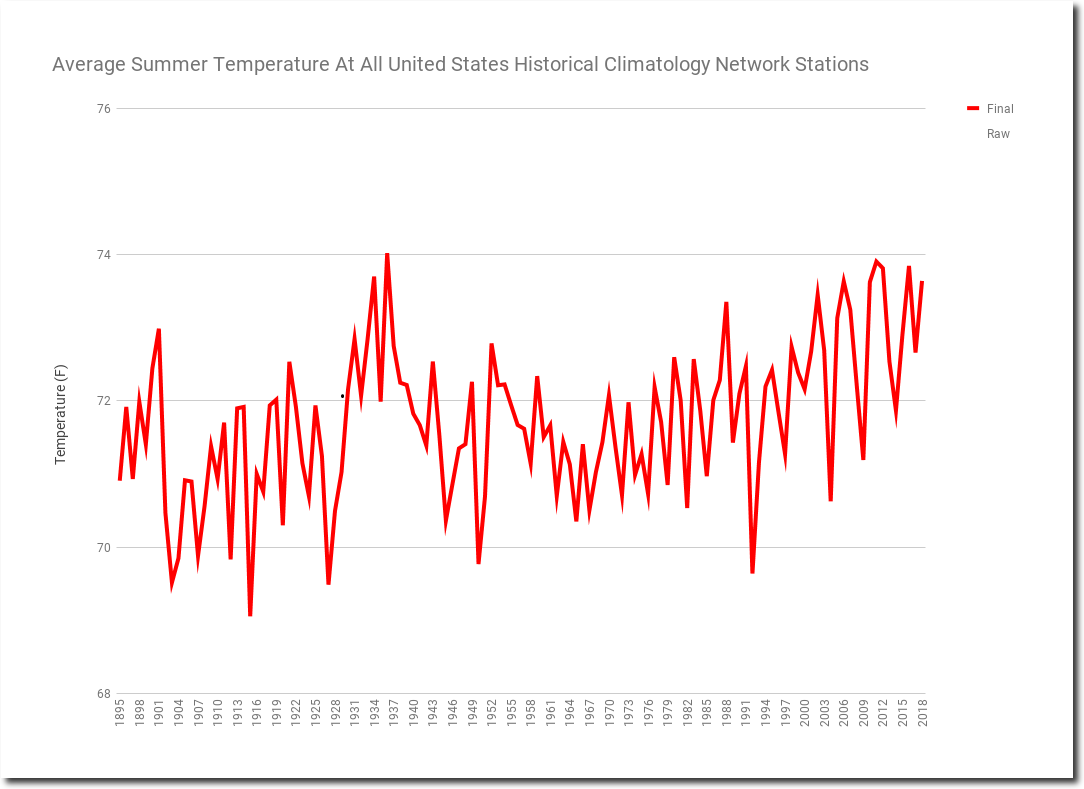
ftp://ftp.ncdc.noaa.gov/pub/data/ushcn/v2.5/ushcn.tavg.latest.FLs.52j.tar.gz
This graph shows the magnitude of the tampering. Older years are made progressively cooler, and recent years are made progressively warmer.
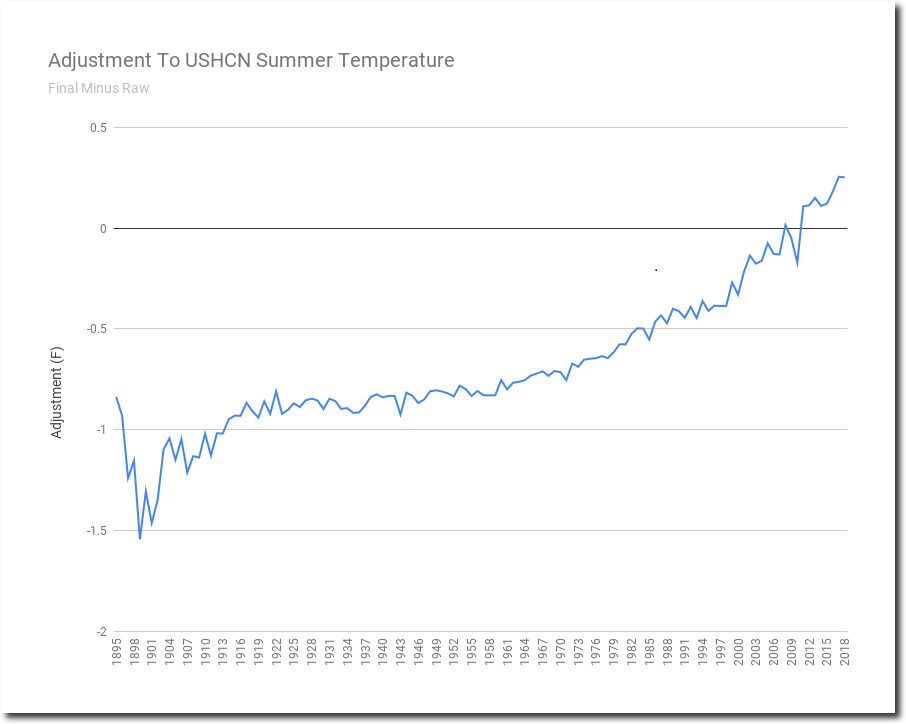
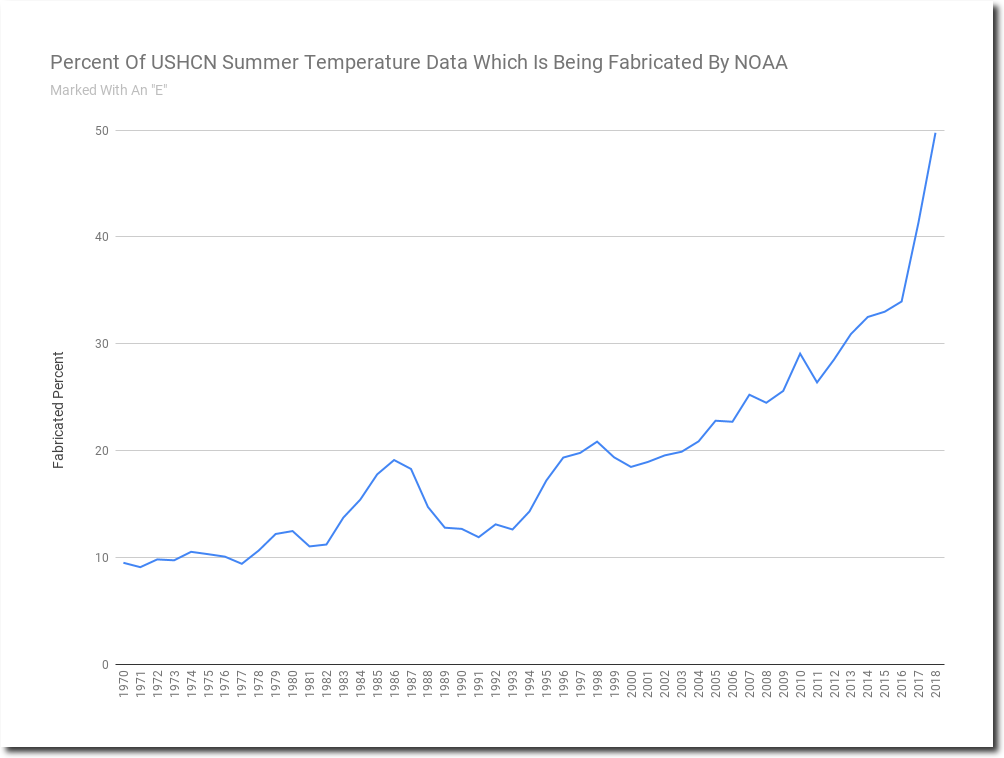
Most of this data tampering is accomplished by simply making data up. NOAA marks monthly station data which is “estimated” rather than measured with an “E.” NOAA fabricates 50% of their current data, compared to about 10% of 1970 data. This allows them to produce whatever result is politically required.
According to NOAA, the Northeast “broiled under record heat” Actual temperature data for the northeast shows that this summer wasn’t hot at all by historical standards.
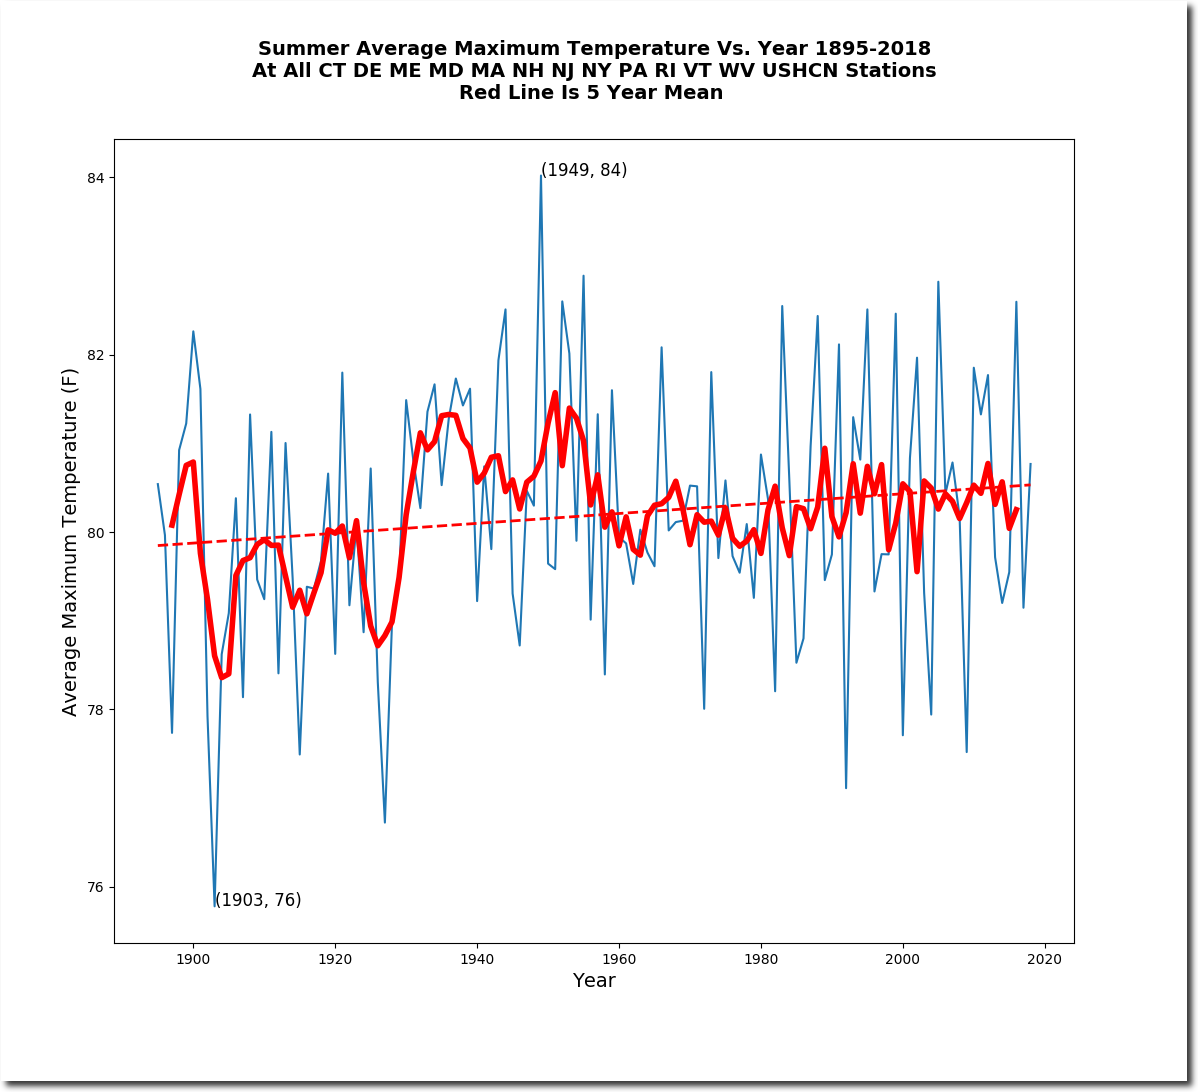
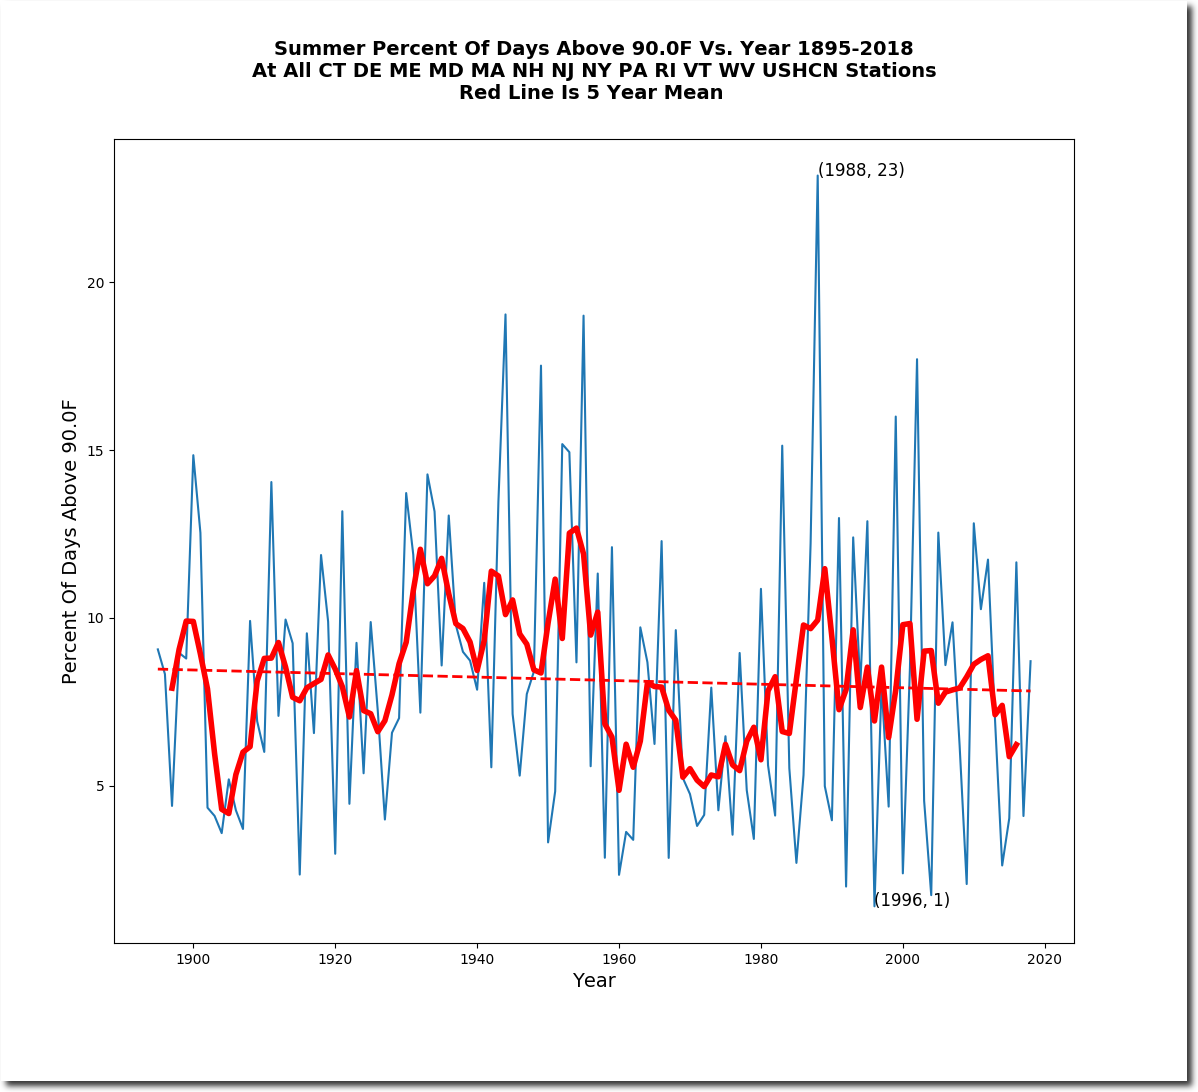
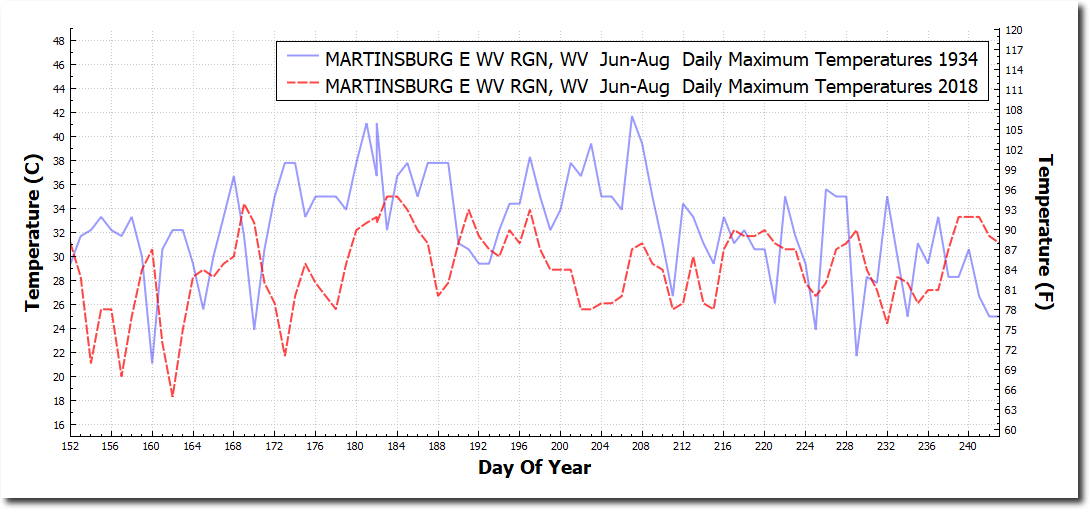
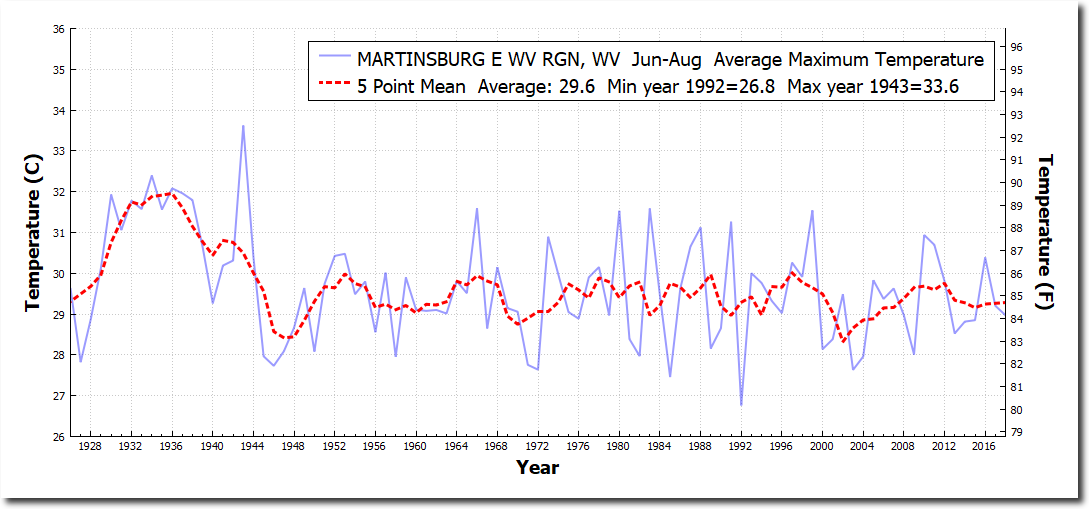
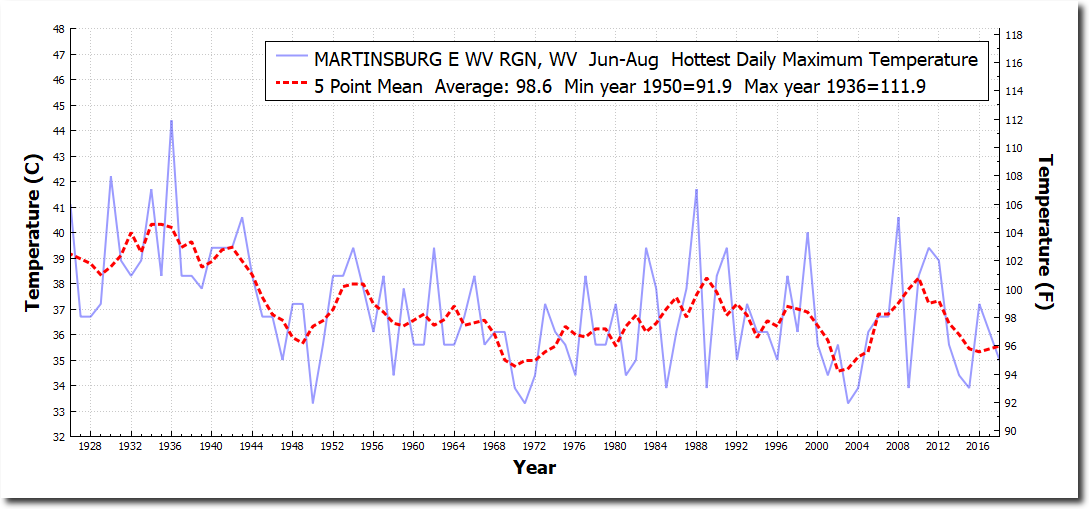
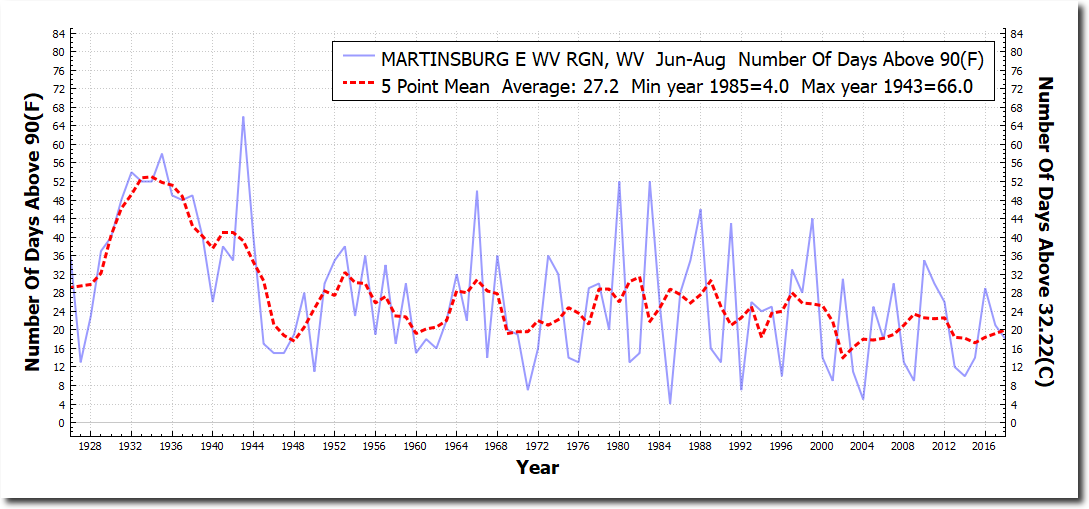
To get a feel how much hotter 1934 was, it is best to look at individual stations. Afternoon temperatures at Martinsburg, West Virginia averaged six degrees hotter in 1934 than this summer, with peak temperatures and frequency of hot days much hotter.
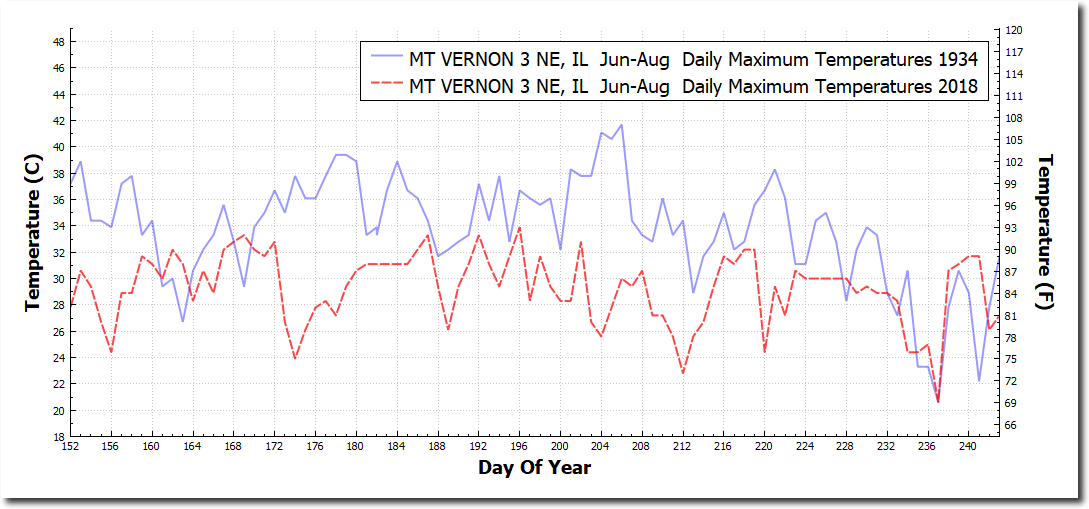
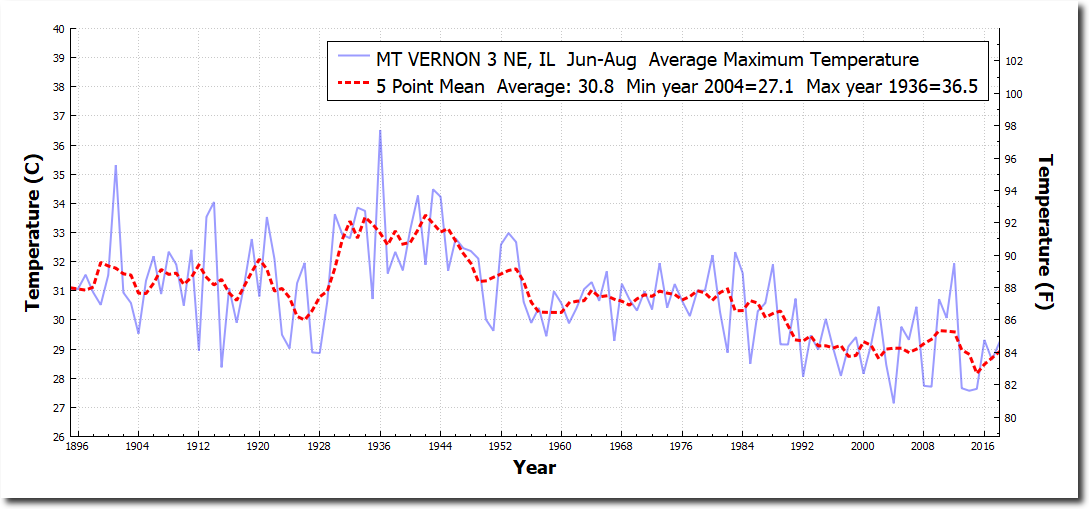
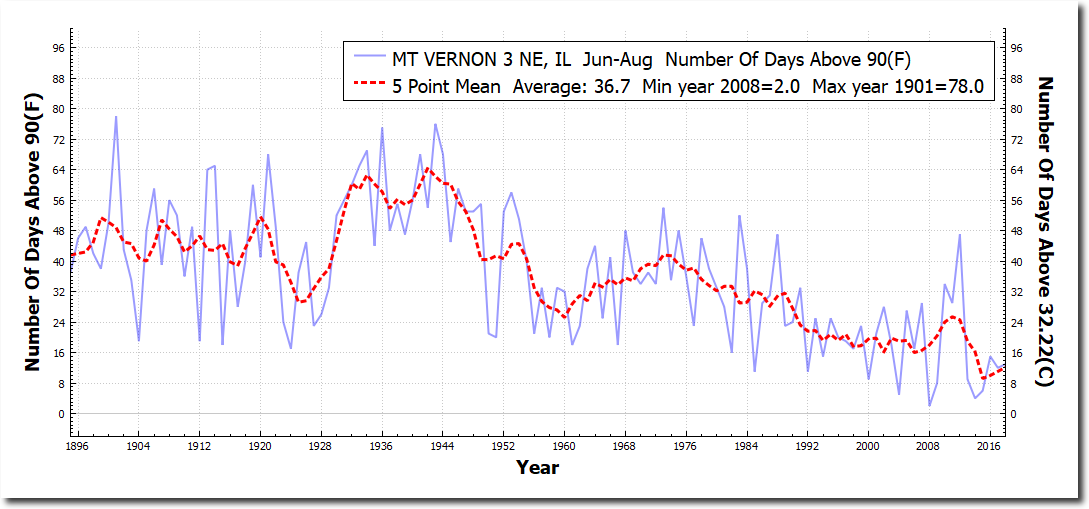
Mount Vernon, Illinois afternoon temperatures averaged eight degrees warmer in 1934 than 2018, with peak temperatures and the frequency of hot days in 1934 much higher.

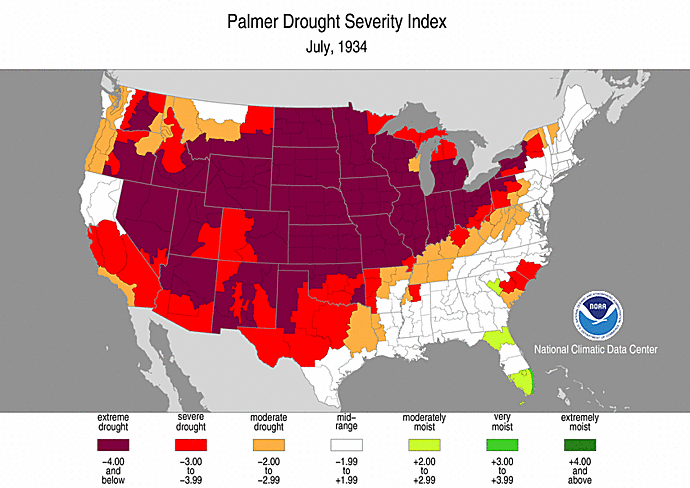
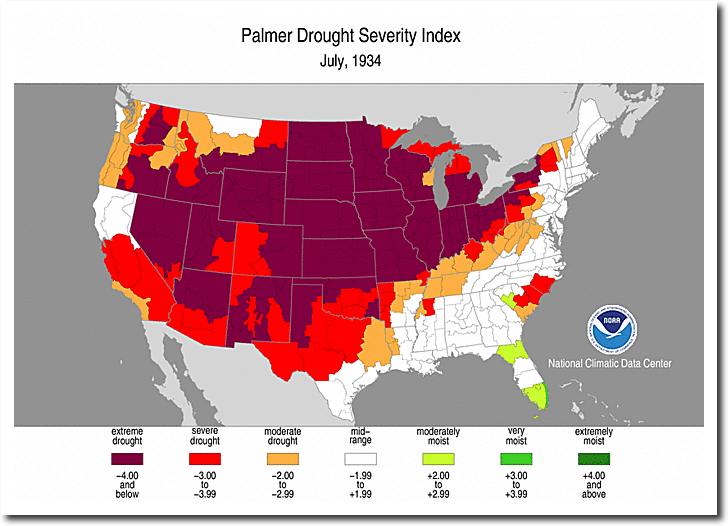
The summer of 1934 was the worst drought in US history, with 80% of the US in severe or extreme drought.
The heat was so extreme that hundreds of people were dropping dead in the streets.
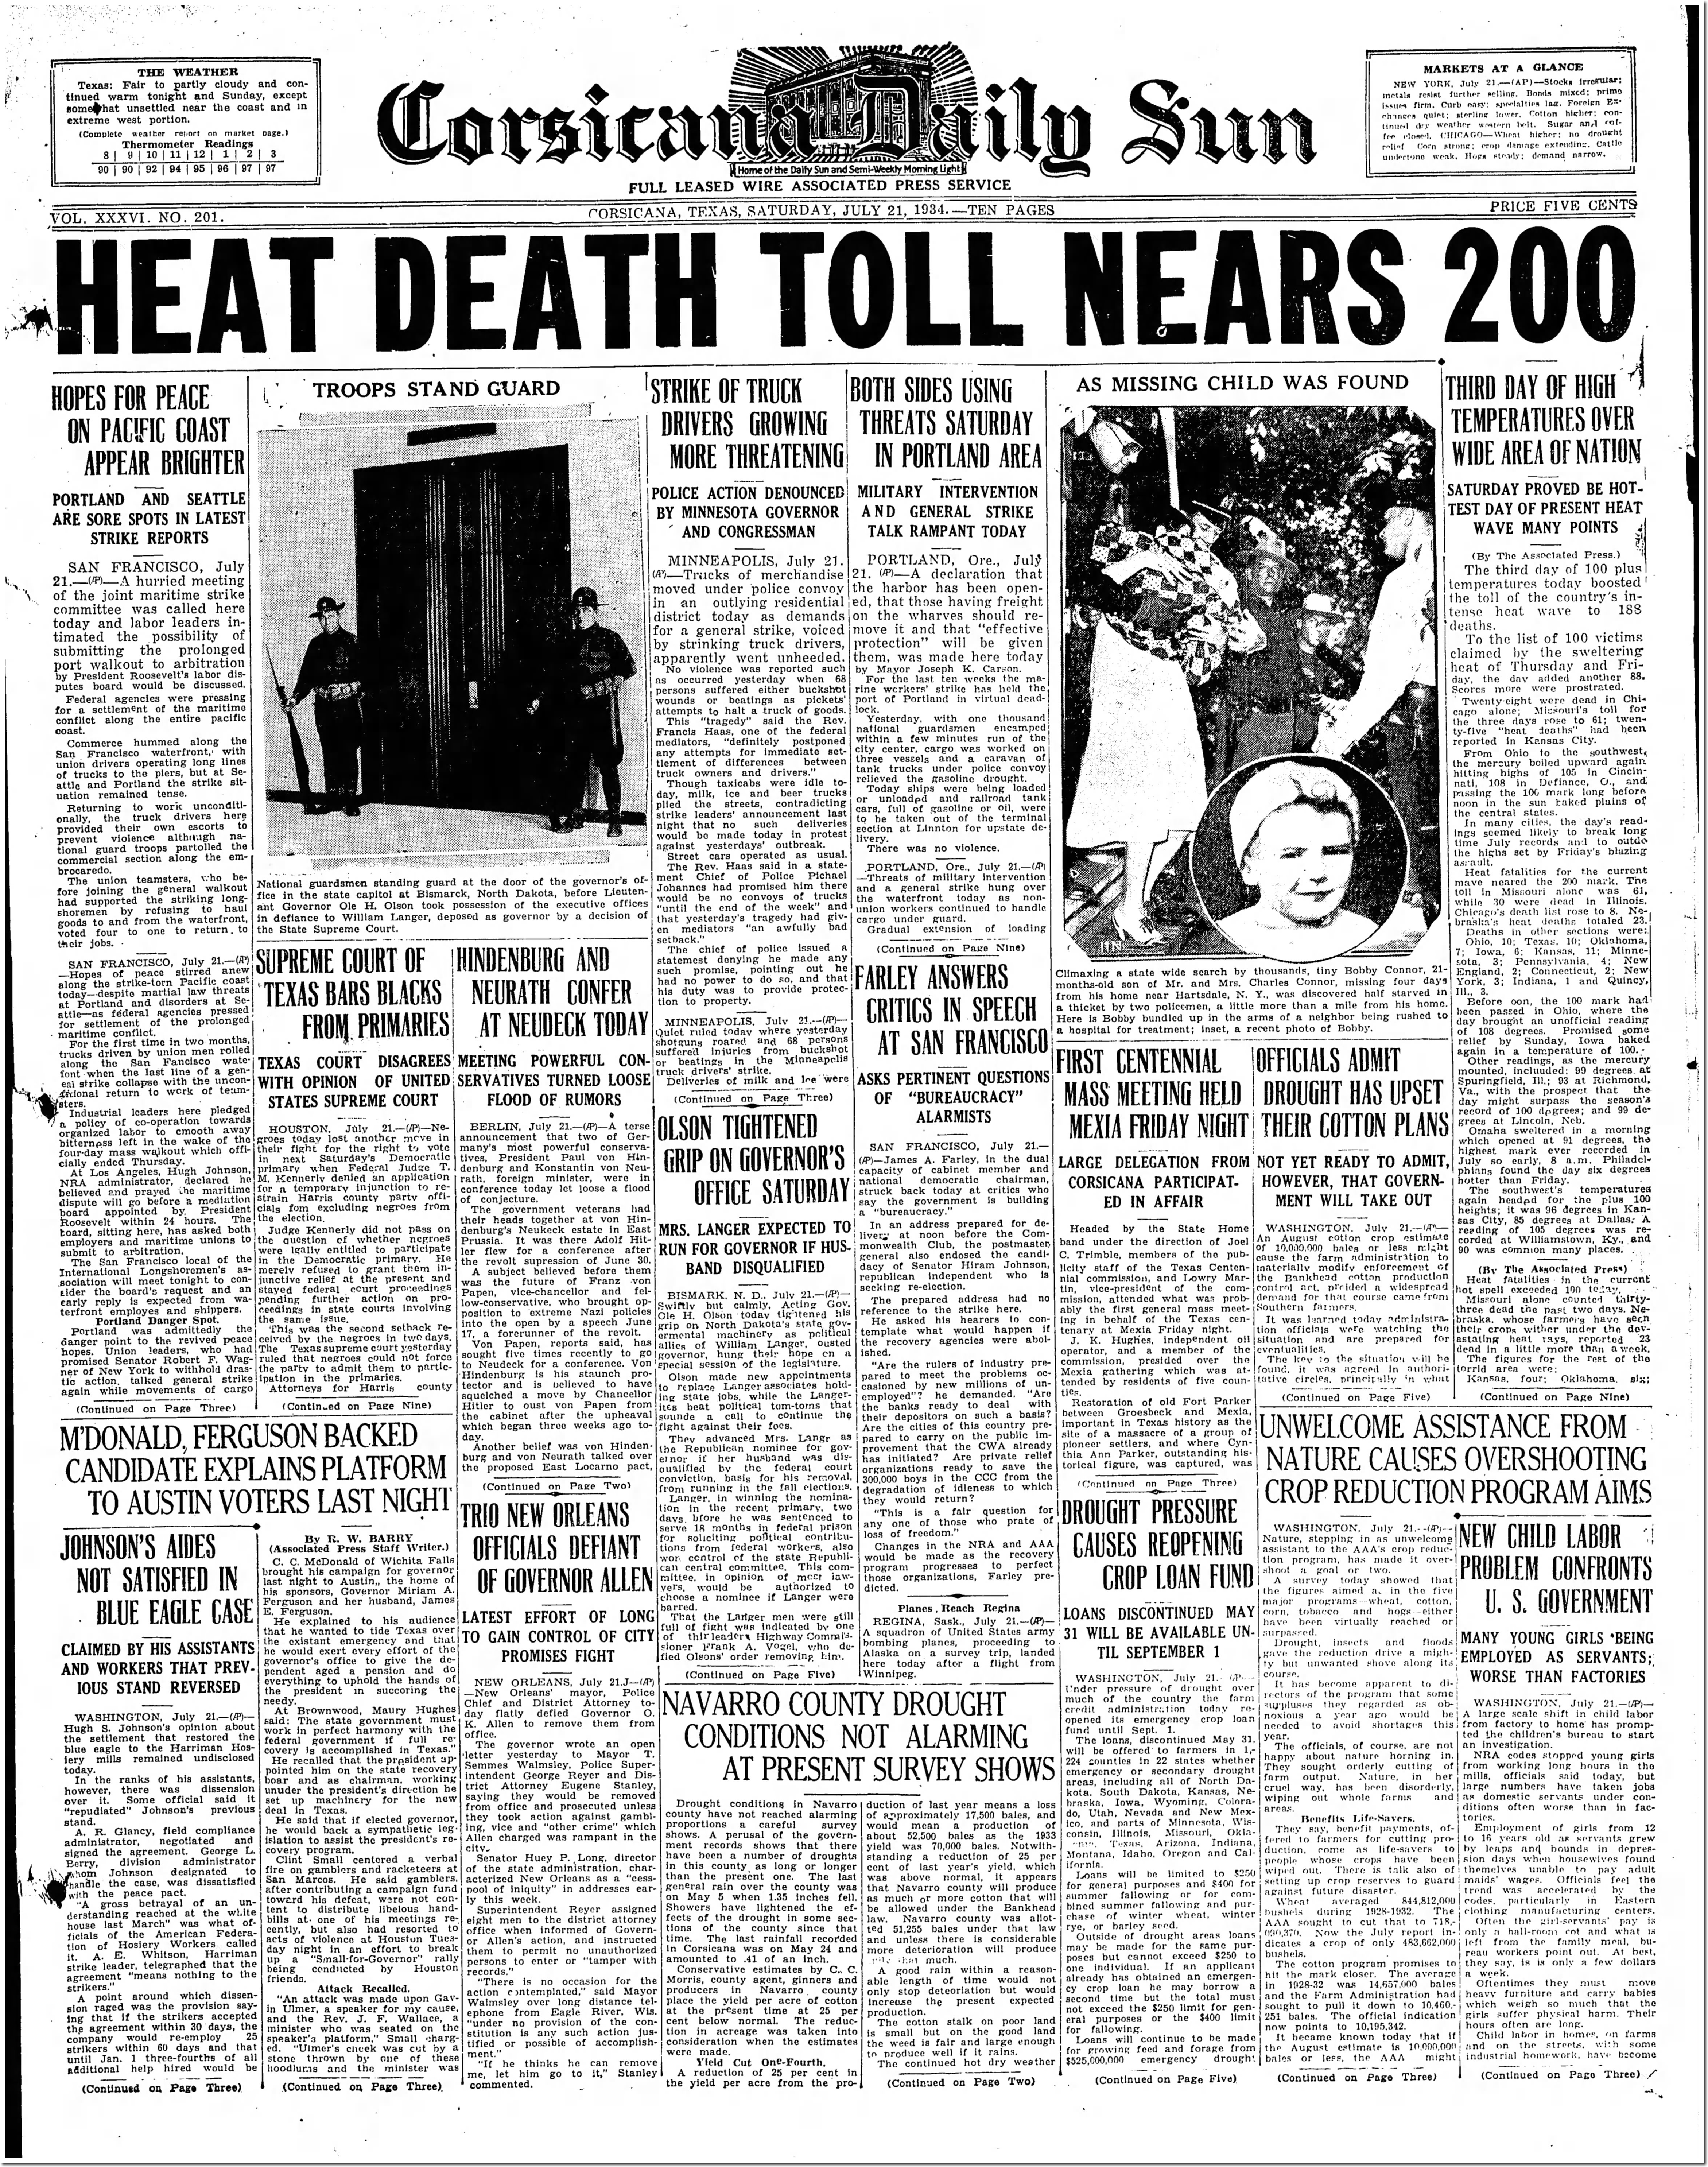
21 Jul 1934, Page 1 – Corsicana Daily Sun at Newspapers.com
The 1930’s was by far the hottest and driest decade in the US, and millions of people fled the Great Plains and moved to California.
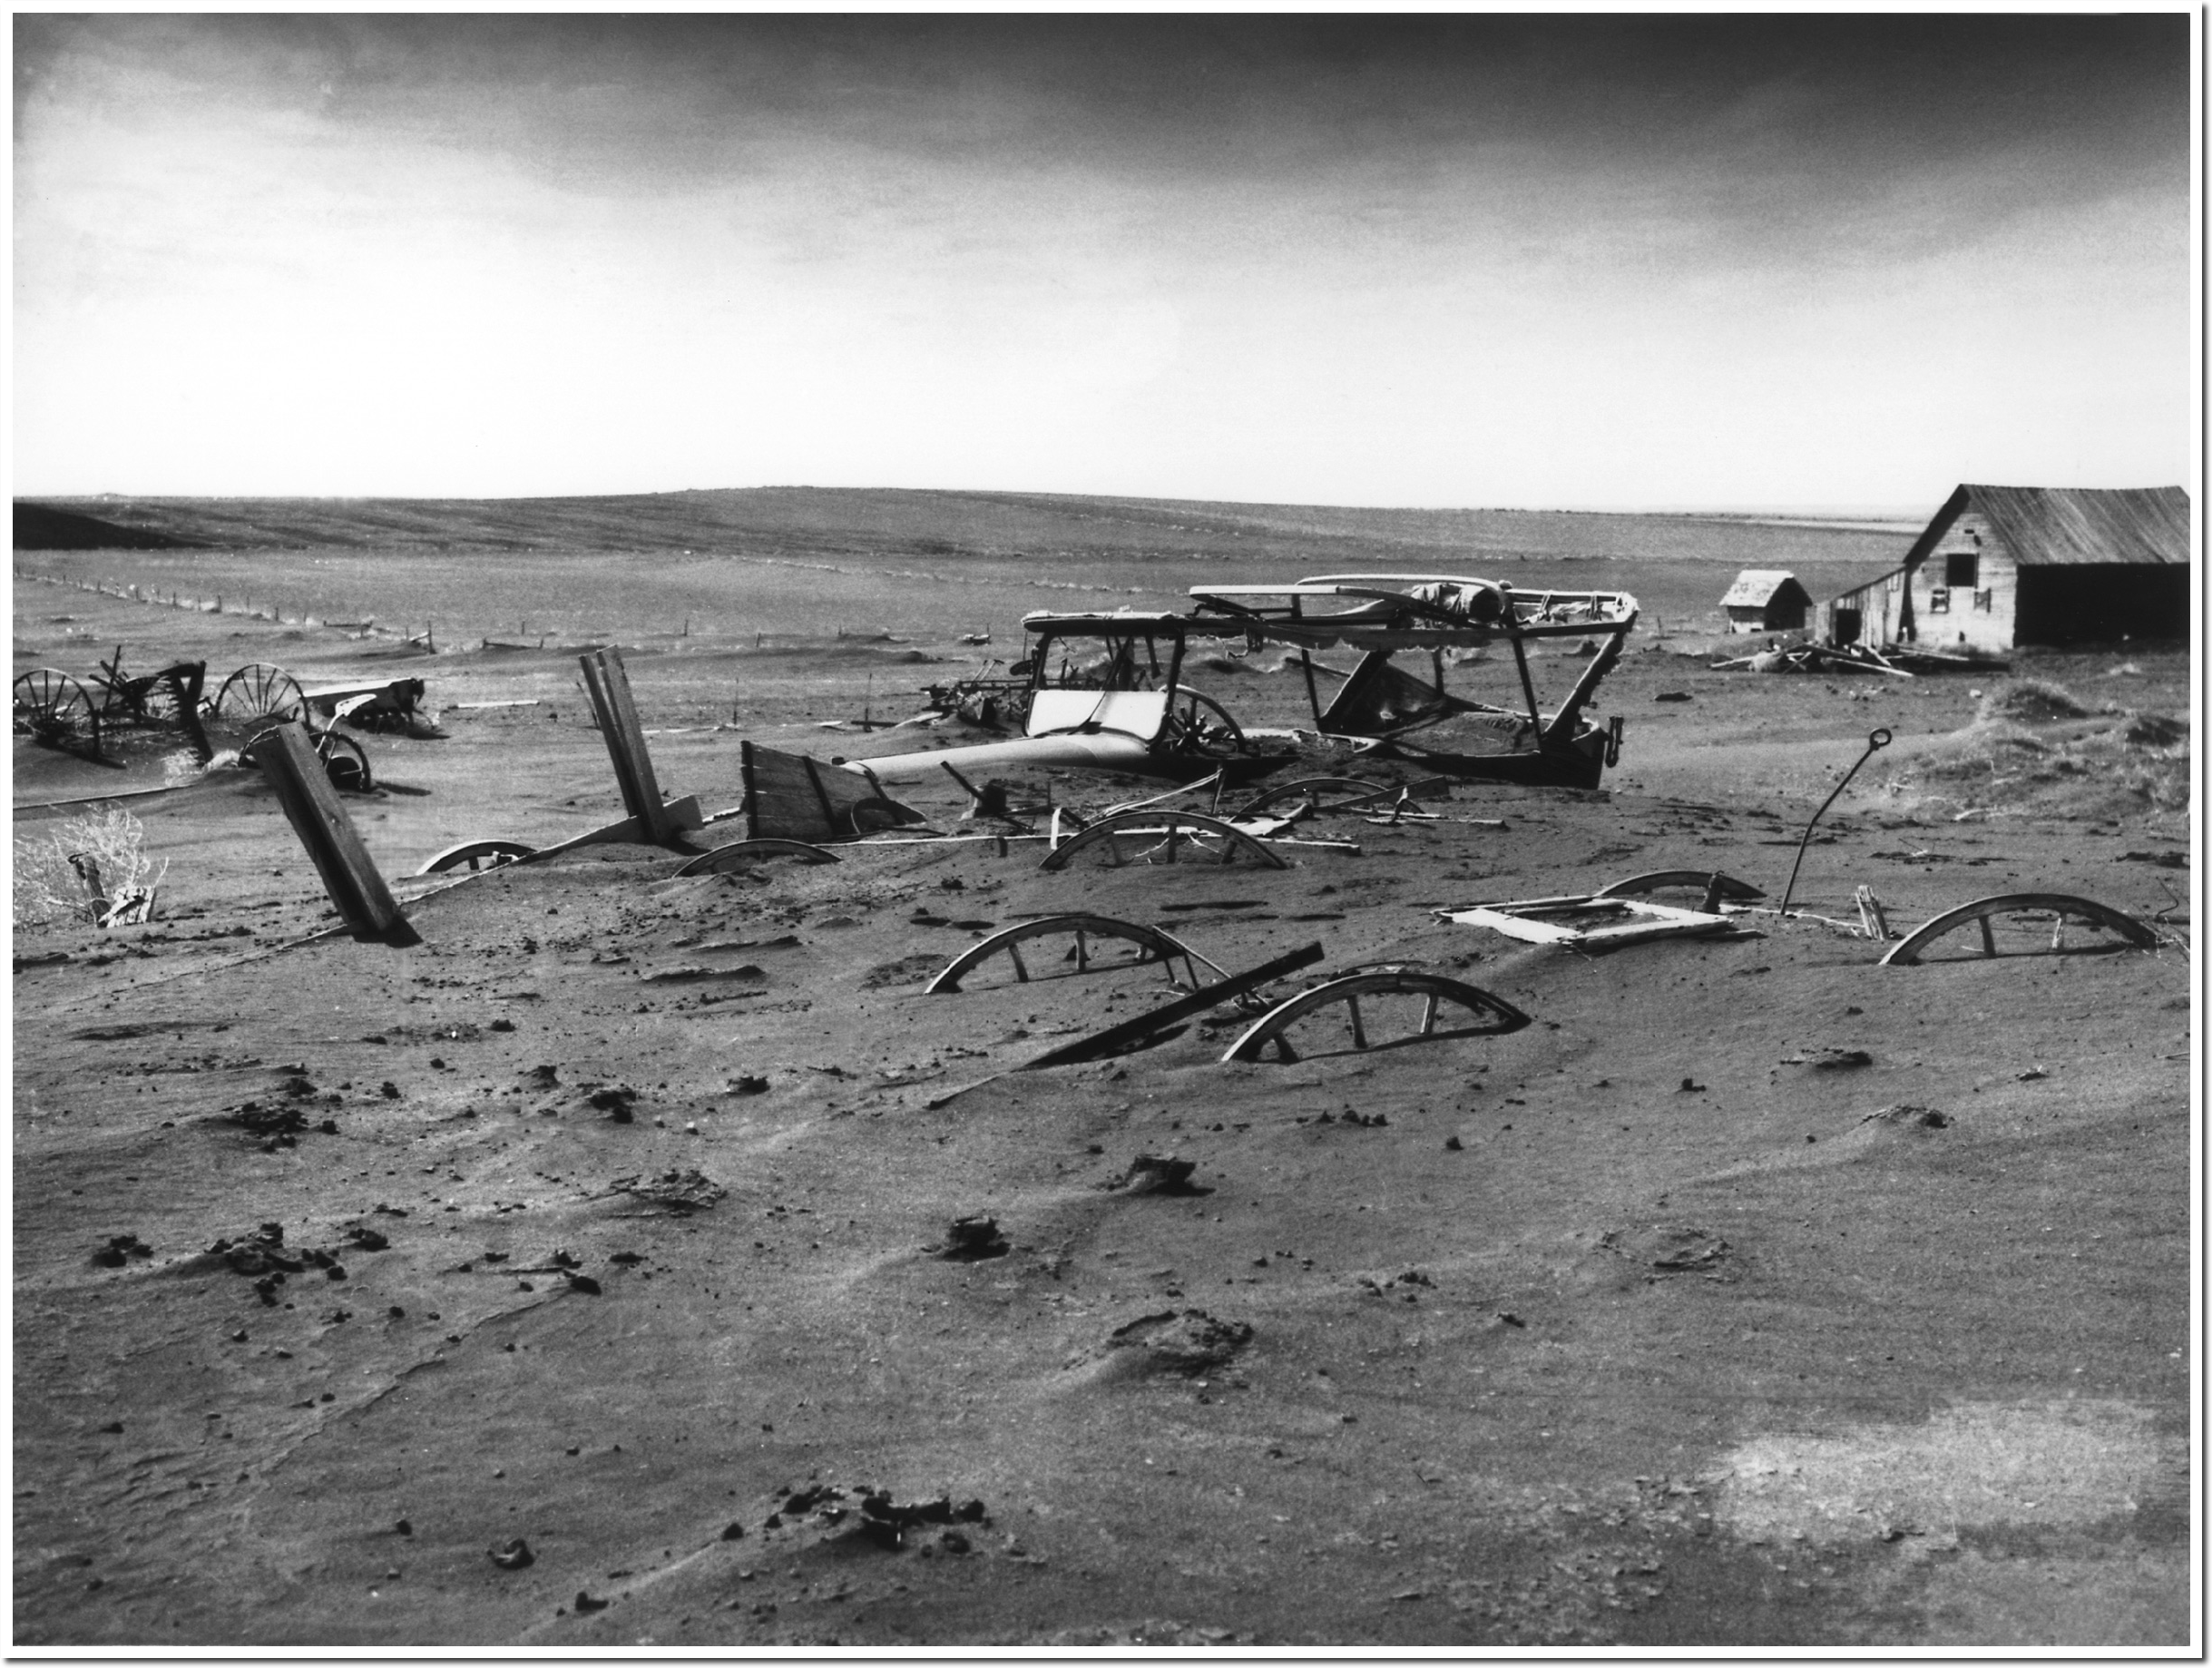
Steinbeck documented this in “The Grapes of Wrath.”

Even the EPA recognizes that the summer of 1934 was extremely hot.
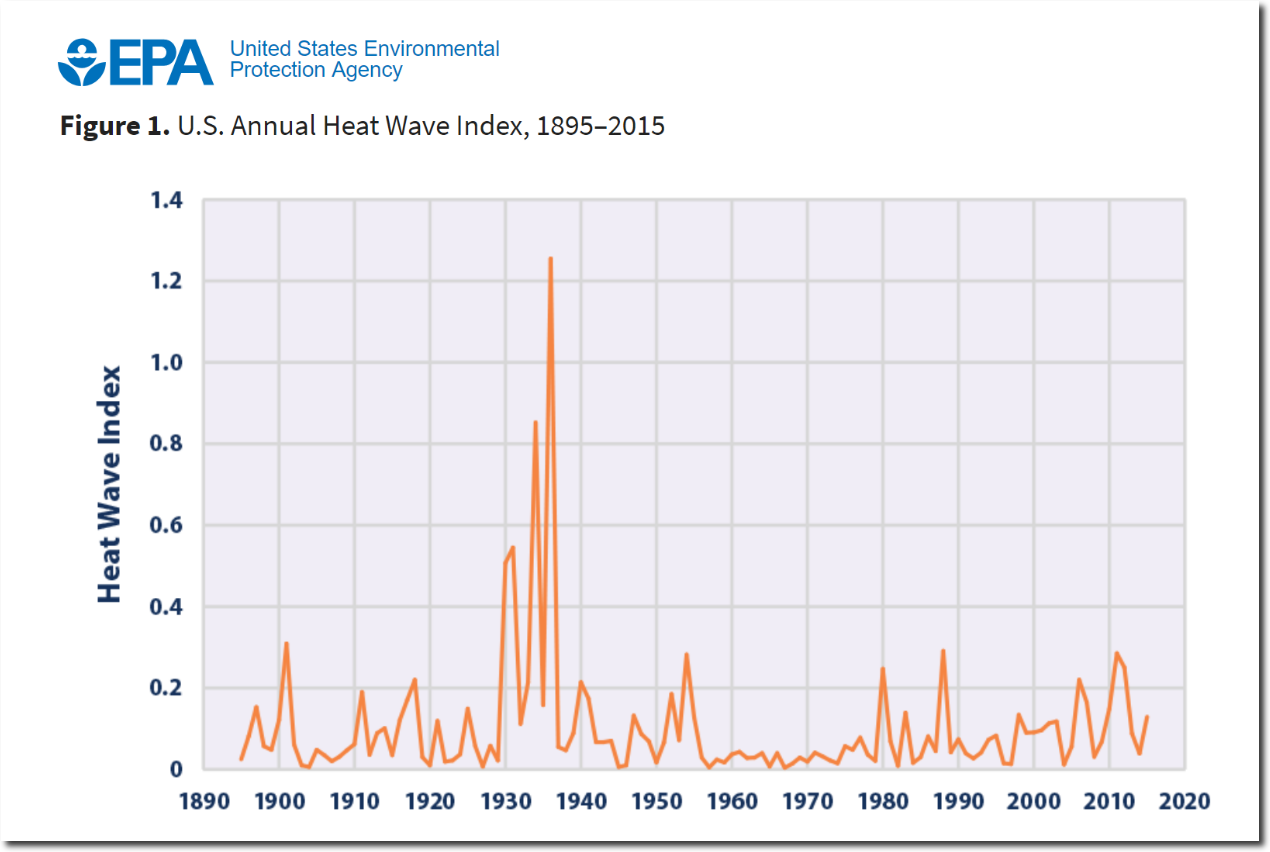
NOAA is no longer making any attempt to appear credible. They recognize that newspapers and politicians won’t call them out, and that they can get away with any level of fraud they consider necessary to keep their global warming narrative alive.

Democrats (who recently nominated the second biggest liar in US history for president) are desperately digging to find anything they can call dishonest in Judge Kavanaugh’s past.
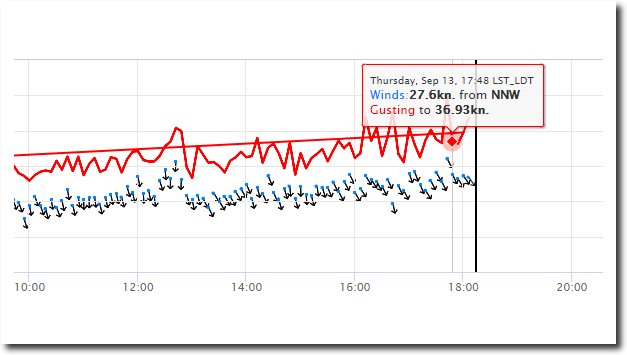
Will Wilmington, North Carolina be able to recover from the two foot storm surge and 32 MPH winds?

Wilmington, NC Forecast | Weather Underground
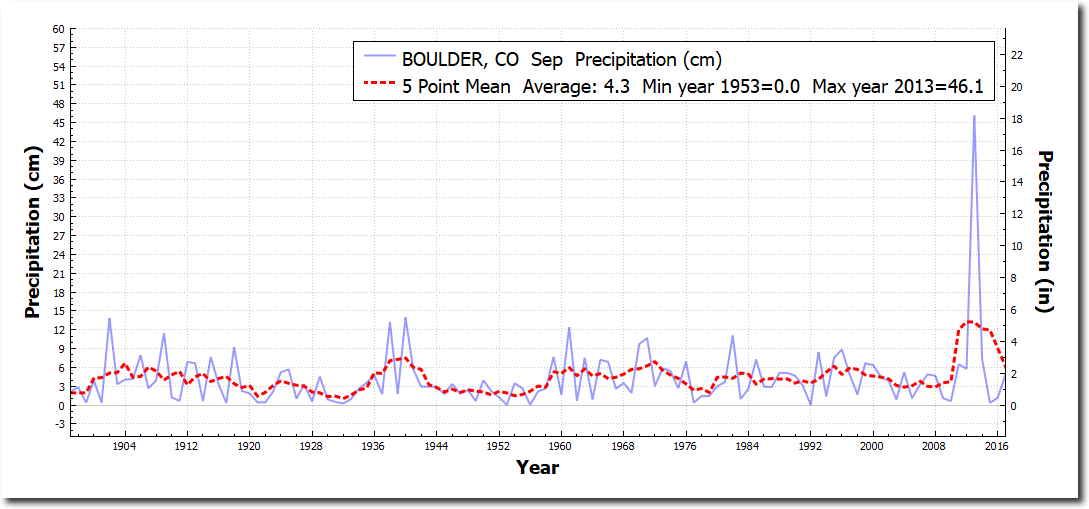
During this week five years ago, Boulder received 18 inches of rain.
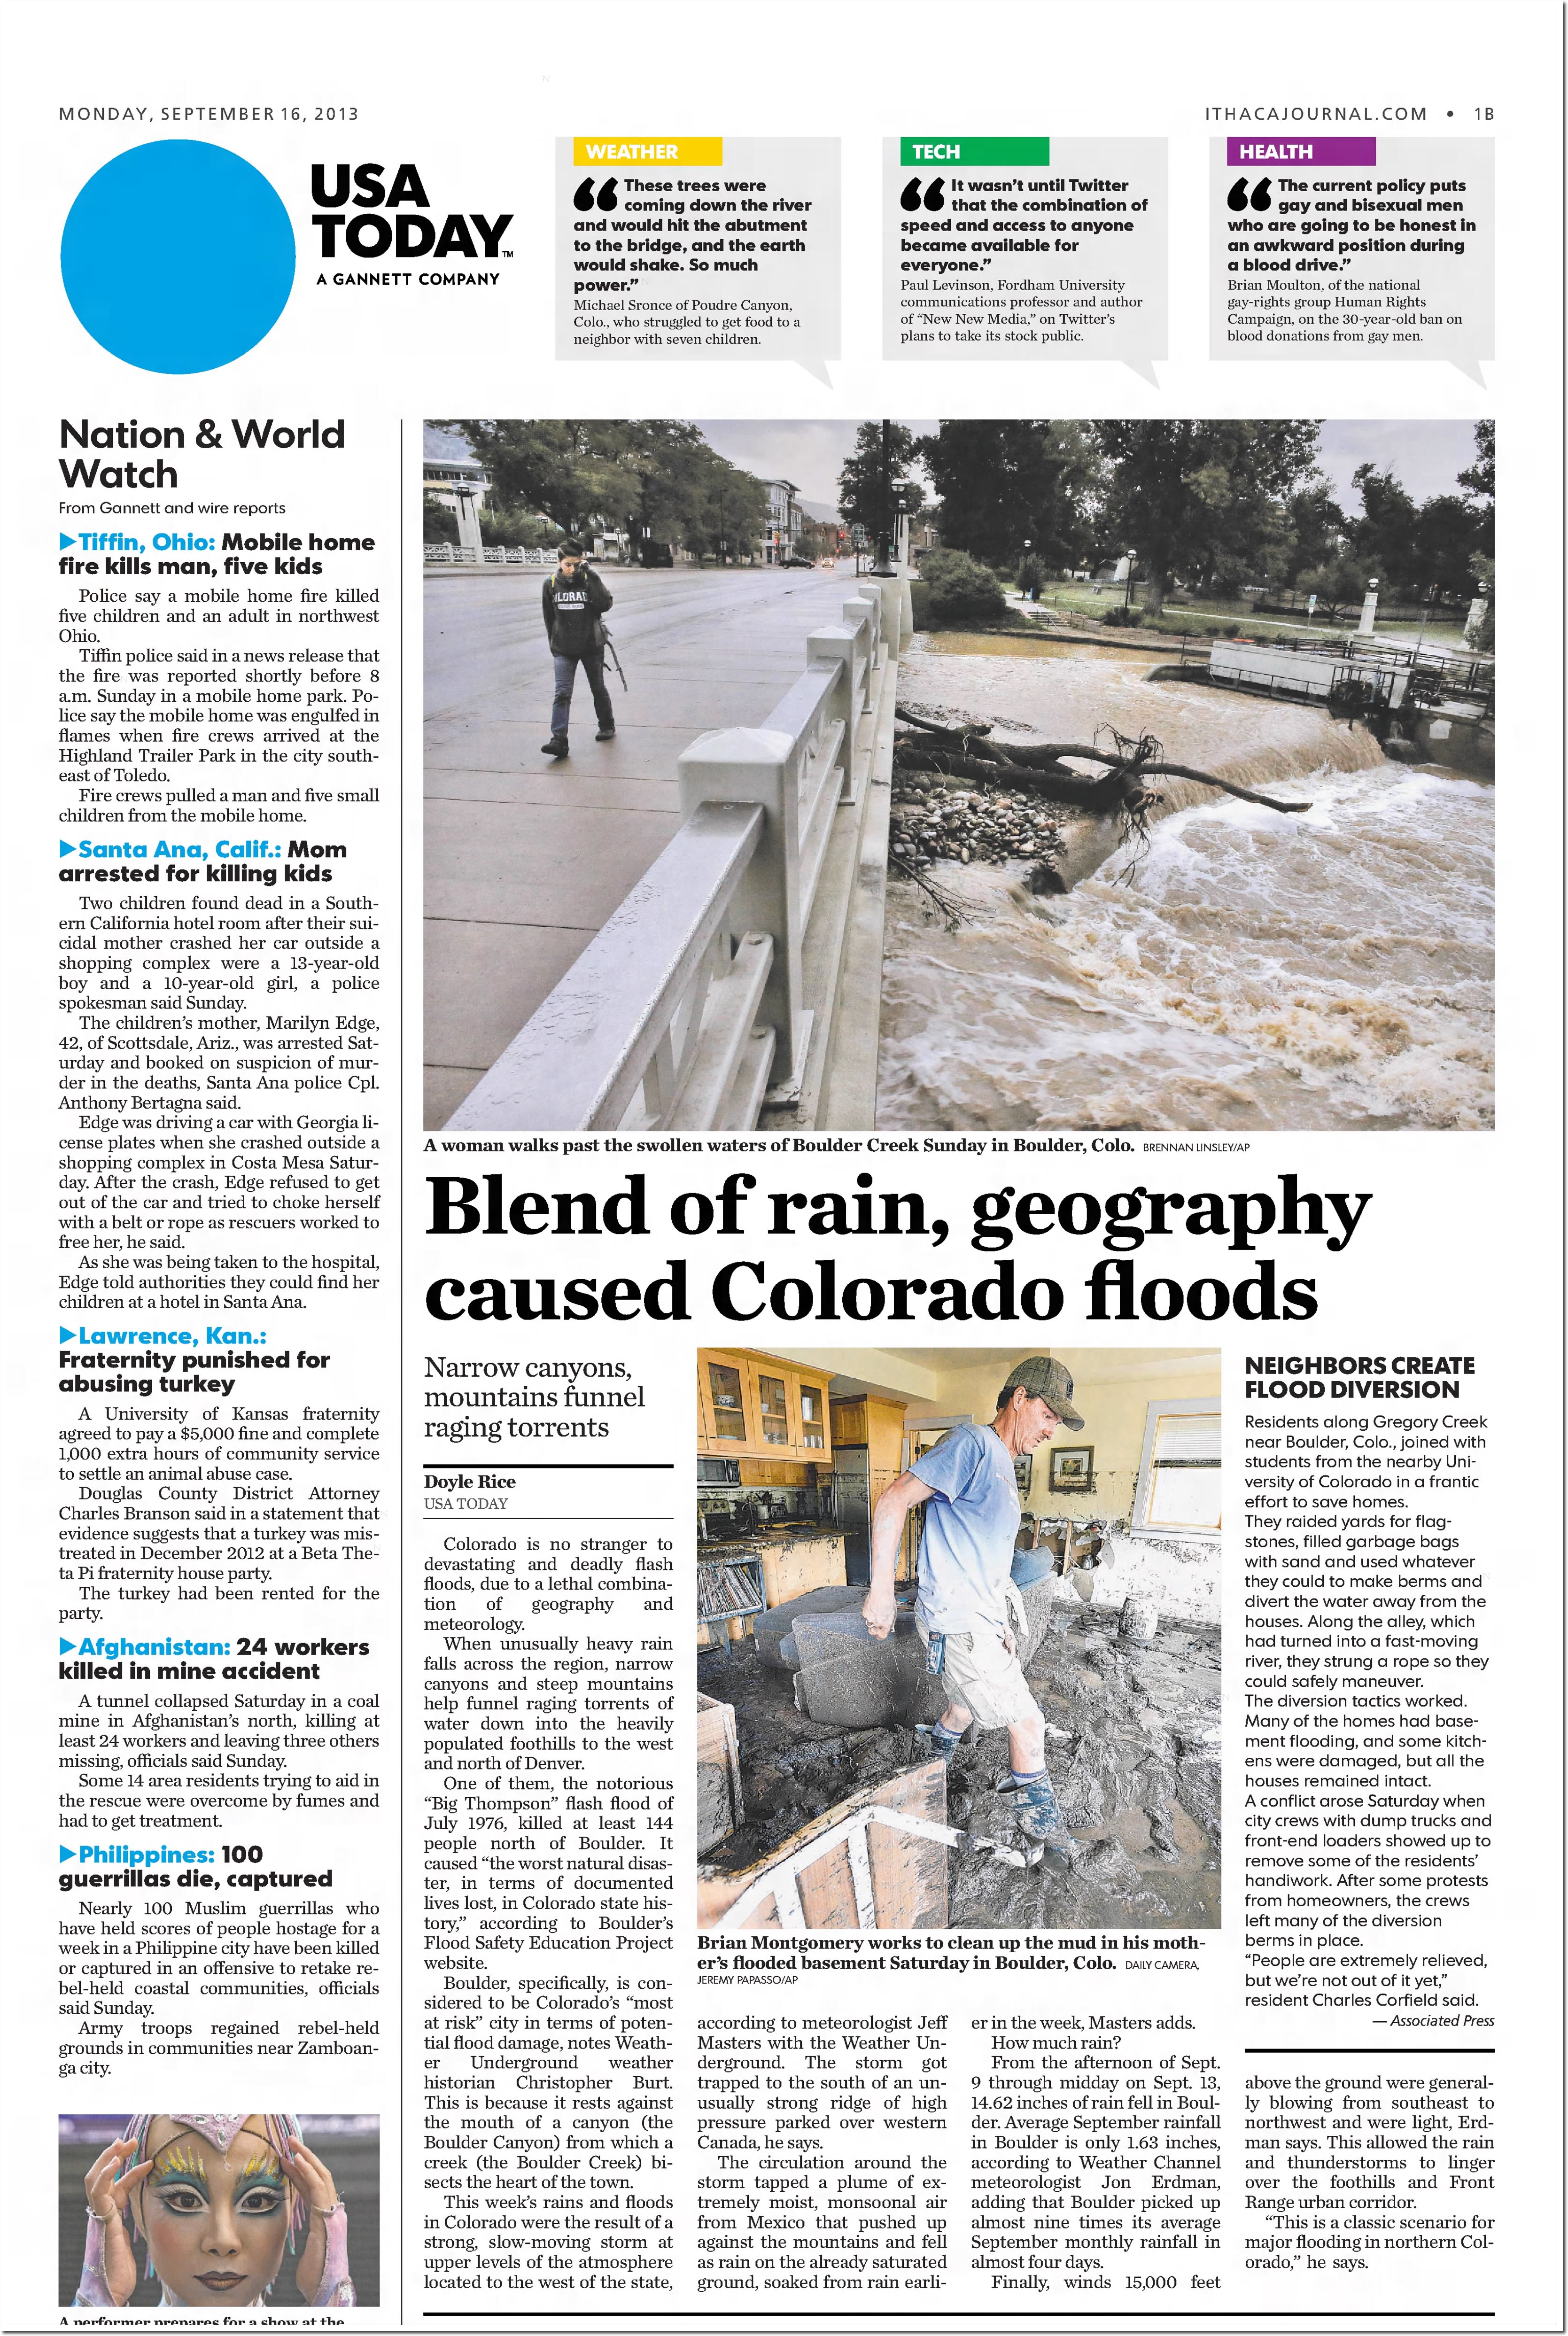
16 Sep 2013, Page B1 – The Ithaca Journal at Newspapers.com
The storm total in 2013 was comparable to what is forecast for North Carolina this week. NCAR Scientists here in Boulder say that much rain is an indication of man-made warm sea surface temperatures.
As of Tuesday evening, the National Hurricane Center was warning of 15 to 25 inches of rain in areas affected by Florence
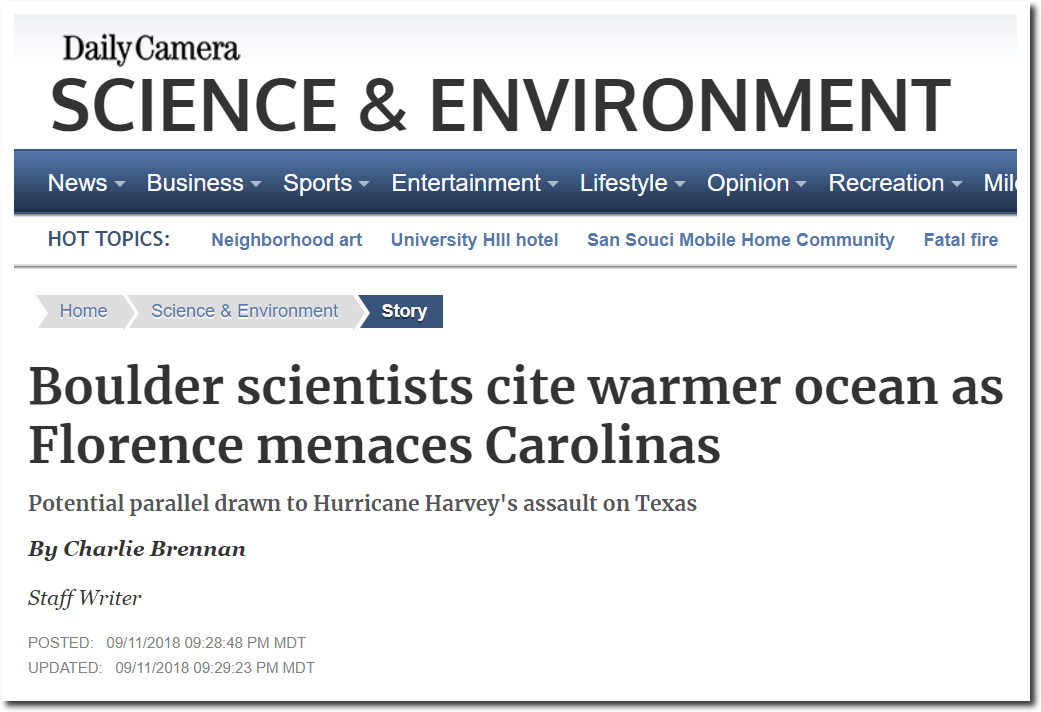
Boulder scientists cite warmer ocean as Florence menaces Carolinas – Boulder Daily Camera
I do a lot of aerial photography here, and haven’t seen any indication of nearby oceans. In fact we are about 950 miles from the Gulf of Mexico. I ride my bicycle up to NCAR almost every day, and haven’t seen any warm sea surface temperatures up there either.
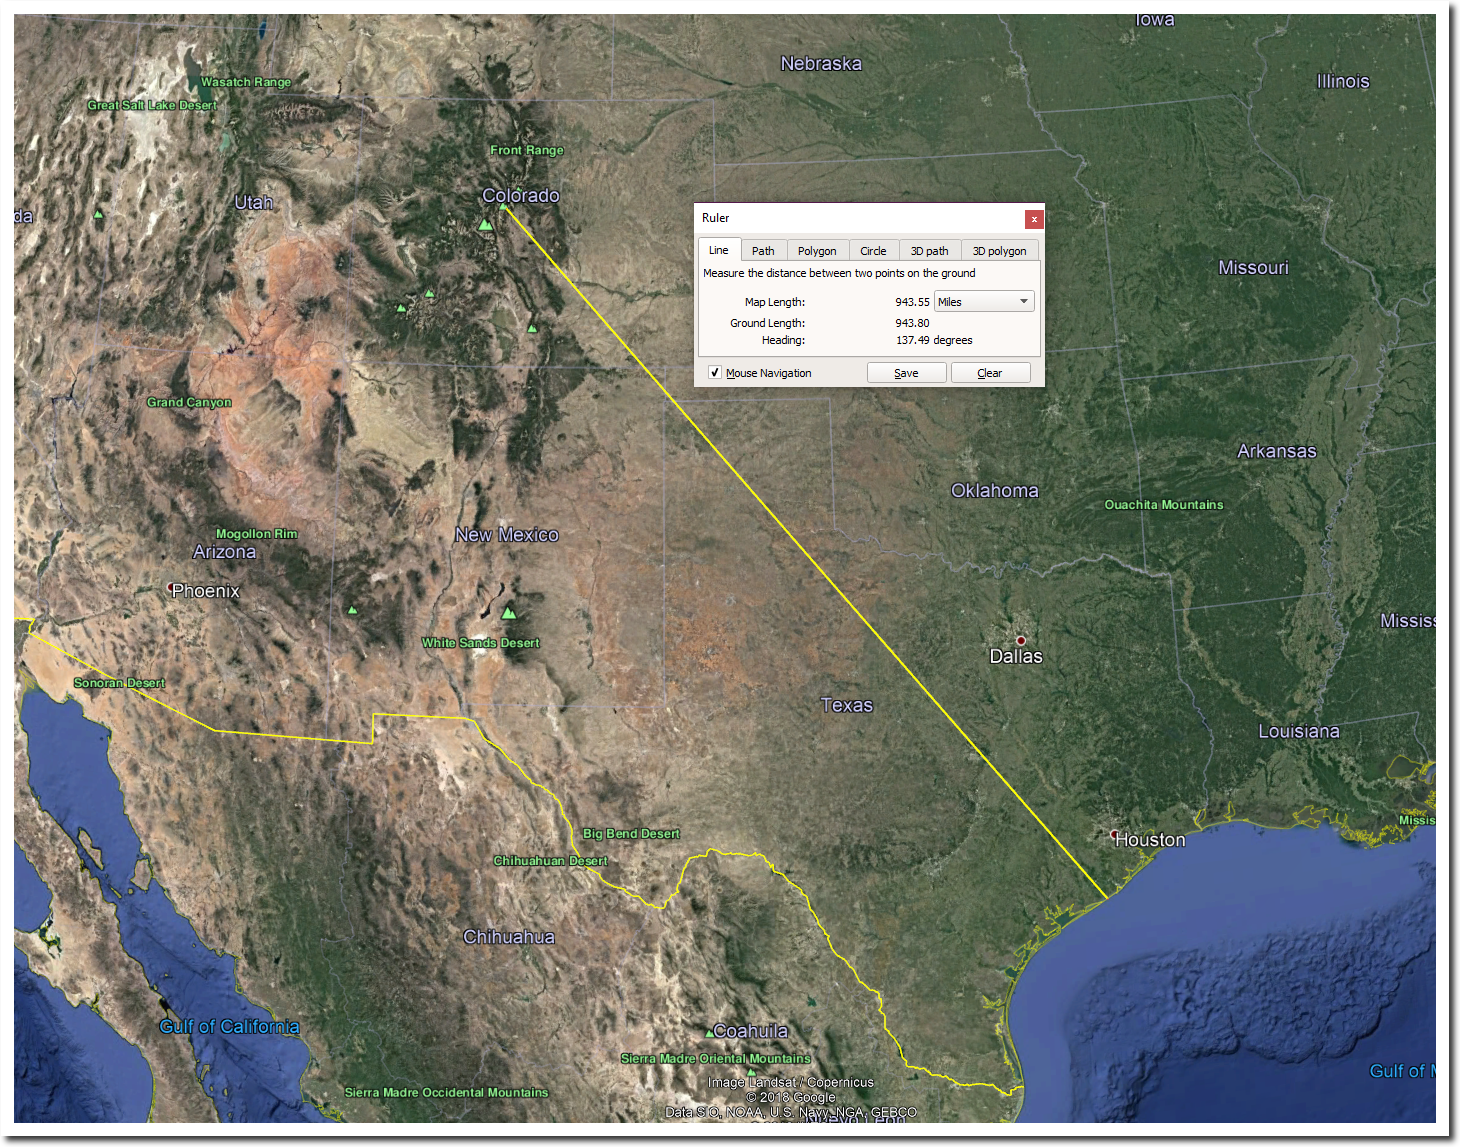
Colorado must have been closer to the ocean in 1935, when man-made warm sea surface temperatures caused 24 inches of rain to fall in six hours.
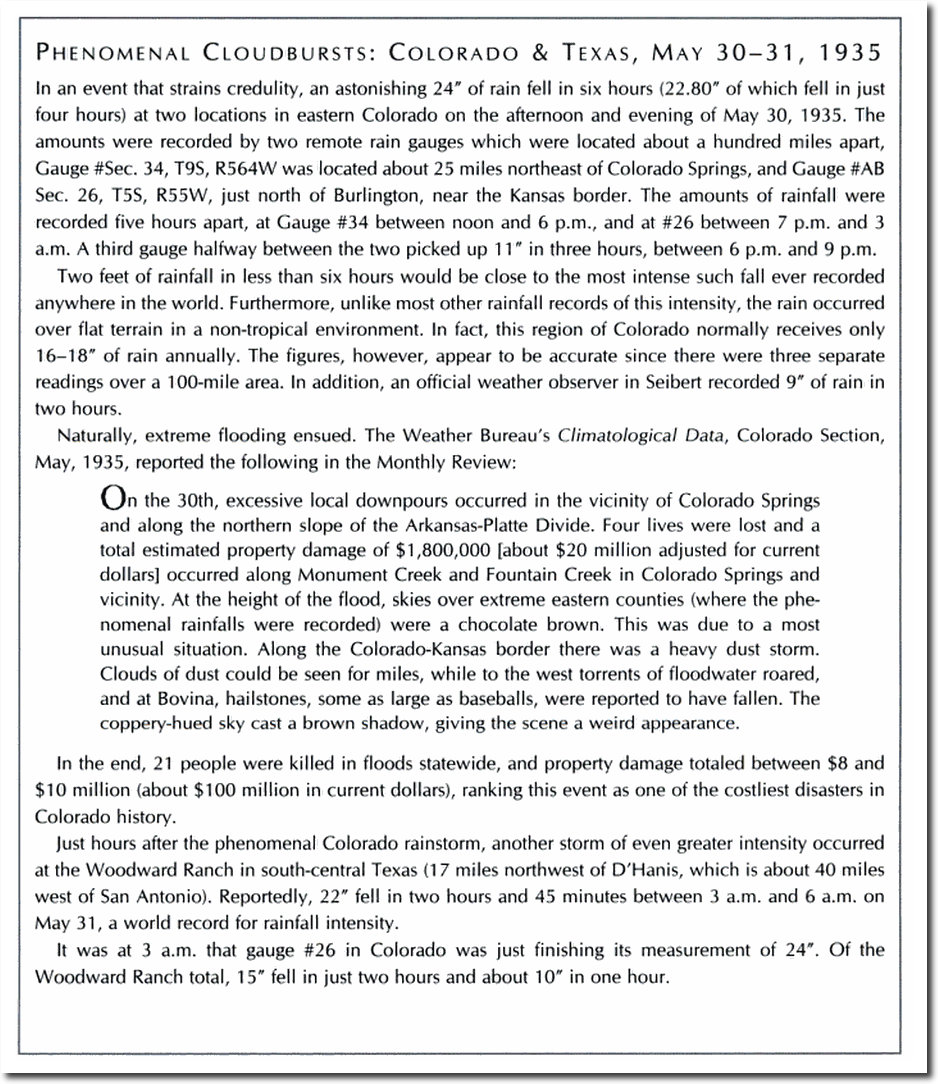
Extreme Weather: A Guide & Record Book – Christopher C. Burt – Google Books
Boulder doesn’t have an ocean, but there are lots of drugs here -which may be impacting the intellectual health of climate scientists.