New Ice-Free Arctic Date

“That there is some relation between sun spots and our weather has long been suspected by meteorologists. Now they are certain”

– New York Times    July 2, 1931

Arctic melt slowed again yesterday, so I am pushing my ice-free Arctic forecast out to October 7, 2018 at 10:01 AM.

There is a good possibility that the summer will end with 2018 Arctic sea ice volume among the three highest in the DMI record.

Spreadsheet    Data

In 1941, scientists understood that Arctic weather was controlled by the Sun, but know they know that taxes and government regulations on the energy industry control the climate.

13 Oct 1940, Page 76 – Hartford Courant at Newspapers.com

TimesMachine: July 2, 1931 – NYTimes.com

Posted in Uncategorized | Leave a comment

Truth In Labeling

Below is the NOAA US maximum temperature graph over the past 90 years. It shows the US warming, and includes no information stating that the data has been massively altered to turn cooling into warming.

Climate at a Glance | National Centers for Environmental Information (NCEI)

The actual NOAA data shows the US cooling. The warming trend is created by people at NOAA tampering with the data. 

Spreadsheet    Data

Data tampering weather records for political purposes has been a problem for over 100 years, and it has always been up to bloggers to call out the people committing the fraud.

January, 1907.

MONTHLY WEATHER REVIEW.

IS NOT HONESTY THE WISEST POLICY

It is wrong to mutilate or suppress the record of an observation of a phenomenon of nature, but it is also wrong to make a bad use of the record. In fact, it is the misuse of meteorological data, not the observing or publishing, that constitutes a crime against the community. Observation and careful research are to be encouraged as useful. Misrepresentations are to be avoided as harmful.

The “Independent Press” as the “Voice of the People” should be not only “Vox Populi” but “Vox Dei “, repressing all cheats and hoaxes, defending the truth and the best interests of the whole nation as against the self-interest of a few.

Wayback Machine

Posted in Uncategorized | Leave a comment

Number Of US Forest Fires Continues To Decline

US forest fire burn acreage and number of fires is down 80% over the last 80 years.

Indicator 3.16: Area and percent of forest affected by abiotic agents

There were 185,209 fires in 1937, and more than 200,000 in 1936.

October 9, 1938 – NYTimes

The decline continues. This year there have been less than 40,000 fires so far,

(Assuming the 2016 number is a typo)

National Interagency Fire Center

There is lots of rain falling in the southwest, so there won’t be much fire activity there in the foreseeable future.

Intellicast – Weekly Precipitation in United States

Meanwhile, the press continues their usual hysterical nonsense.

Posted in Uncategorized | Leave a comment

Arctic Sea Ice Melt Rates Continue To Decline

Over the past 15 years, the amount of sea ice melting between May 1 and July 25 has plummeted.

http://ocean.dmi.dk/arctic/icethickness/txt/IceVol.txt

This is not surprising, because Arctic summers have been getting colder.

Ocean and Ice Services | Danmarks Meteorologiske Institut

Arctic sea ice volume is likely to end the summer close to the highest in the Danish Meteorological Institute record.

Spreadsheet    Data

Reality has no place among Democrats and the left however. They simply make up lies to suit their political agenda.

Posted in Uncategorized | Leave a comment

The Record Heatwave Of 2018

July 2018 maximum temperatures at Logan, Iowa have been 18 degrees cooler than 1936. That gap will likely increase as the month proceeds.

Summer in the Dallas/Fort Worth area has seen afternoon temperatures four degrees cooler than 1980, when they had 50 consecutive days over 100 degrees.

Summers are getting cooler, but left-wing snowflakes are melting much easier than in the past.

Posted in Uncategorized | Leave a comment

Latest Pix

Posted in Uncategorized | Leave a comment

NOAA Hiding The Decline

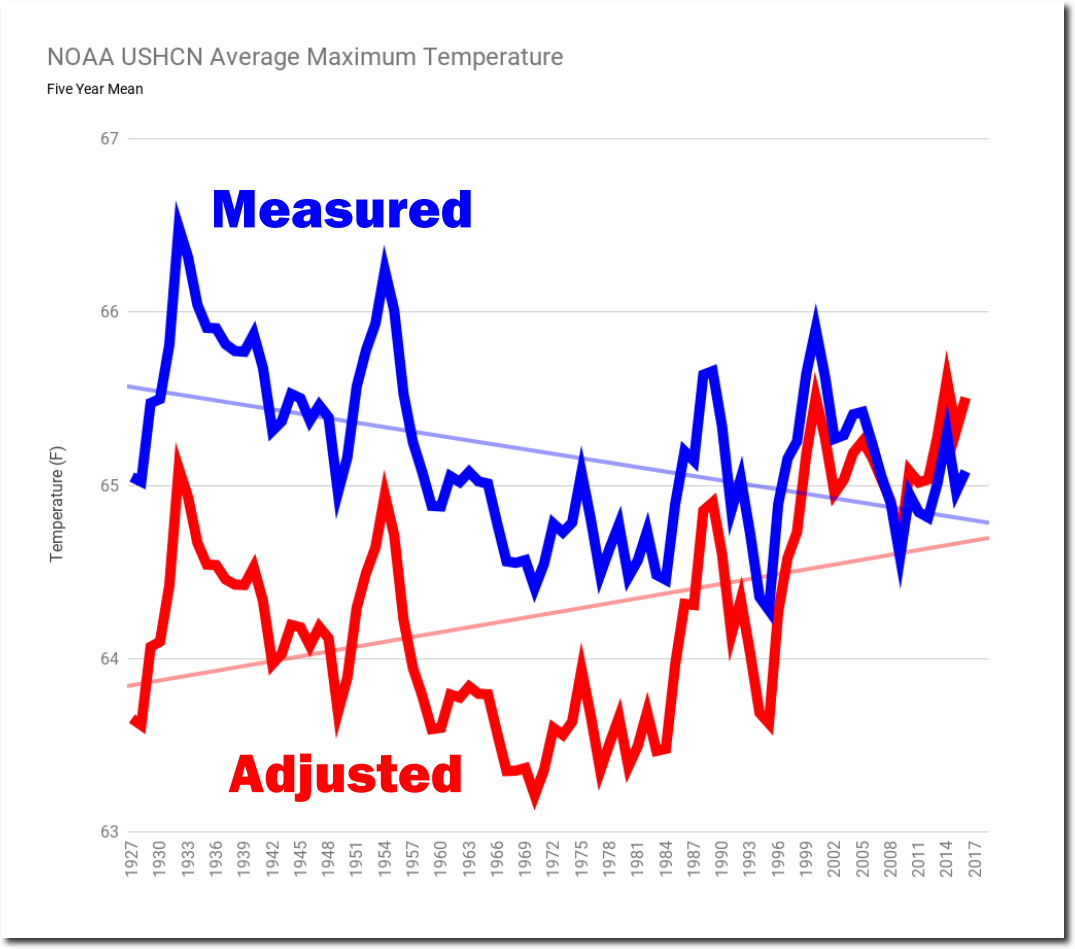
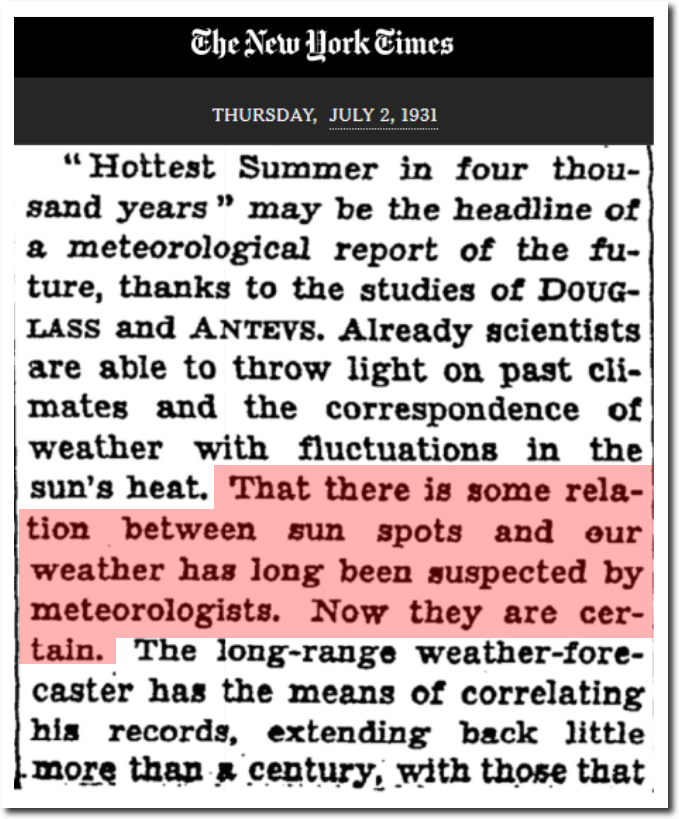
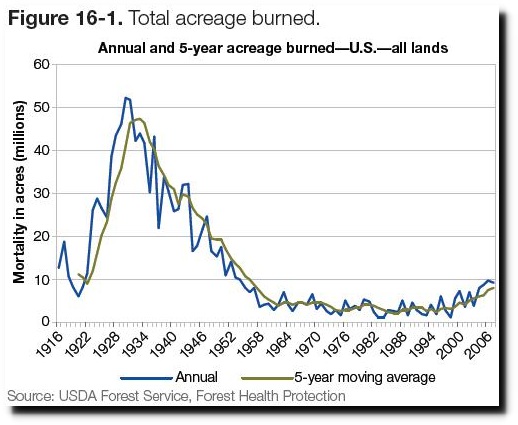
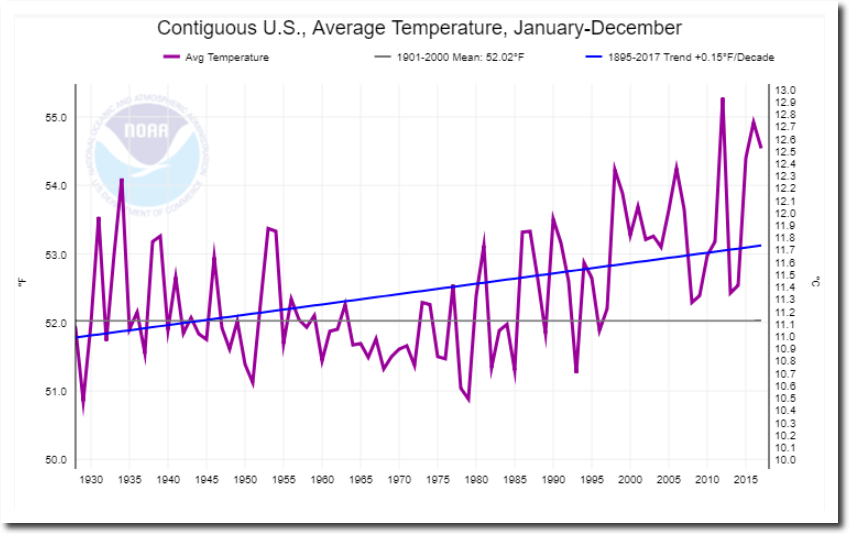
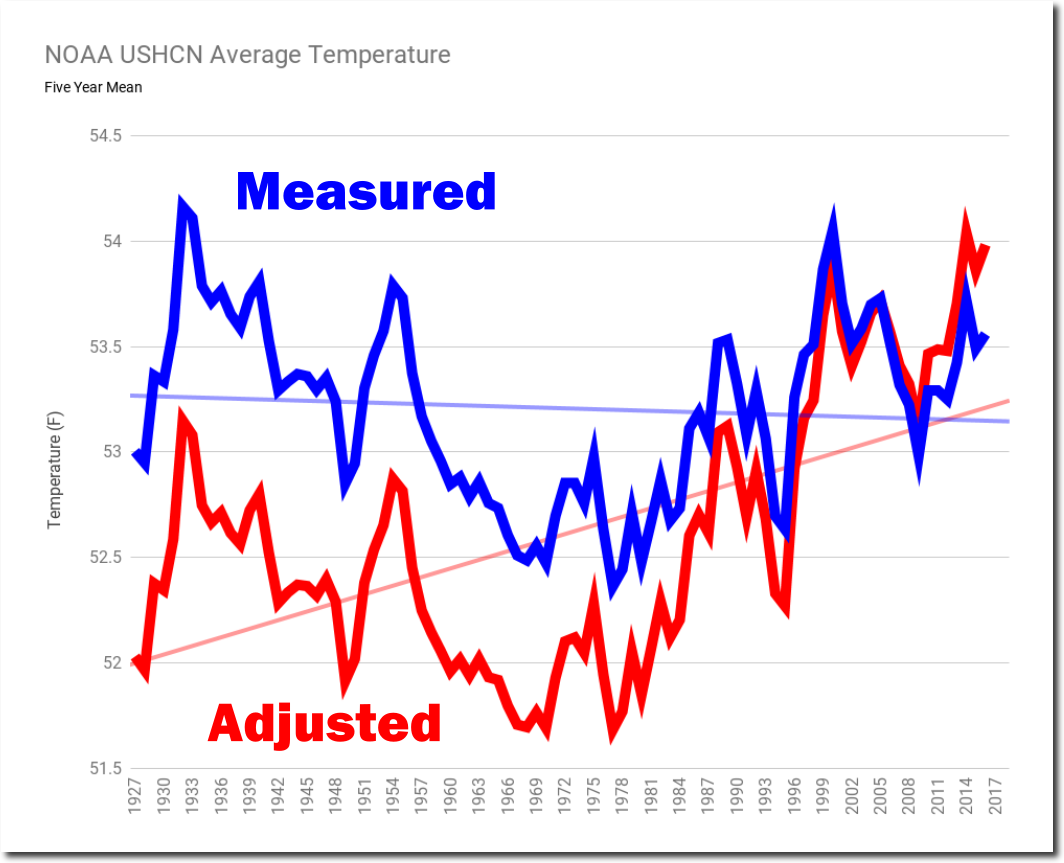
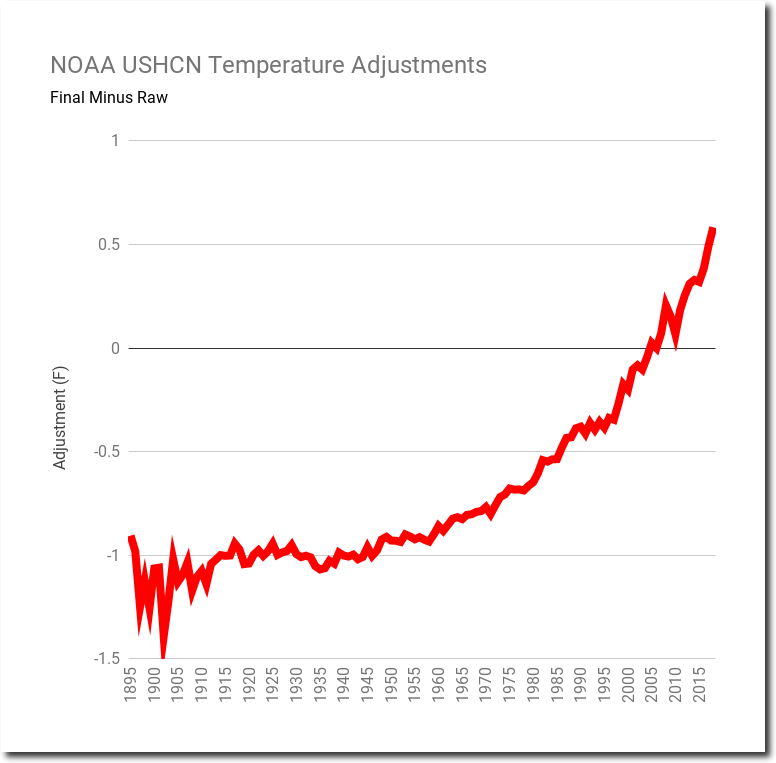
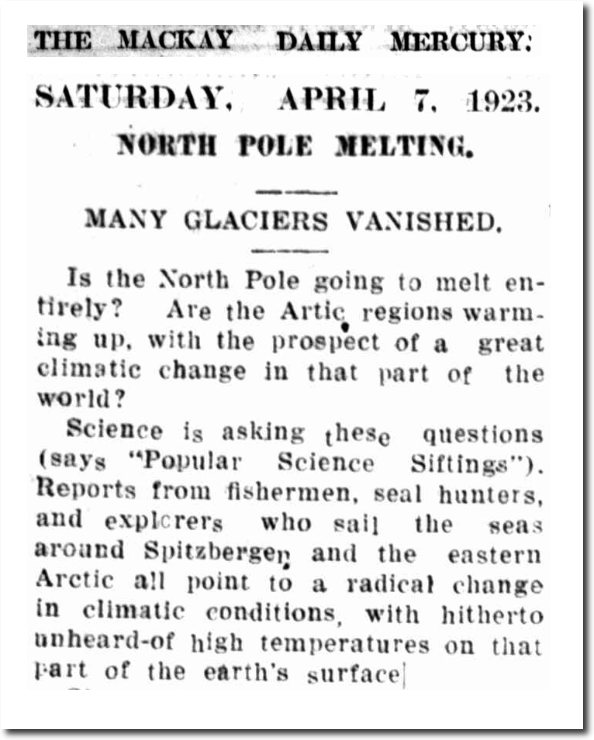
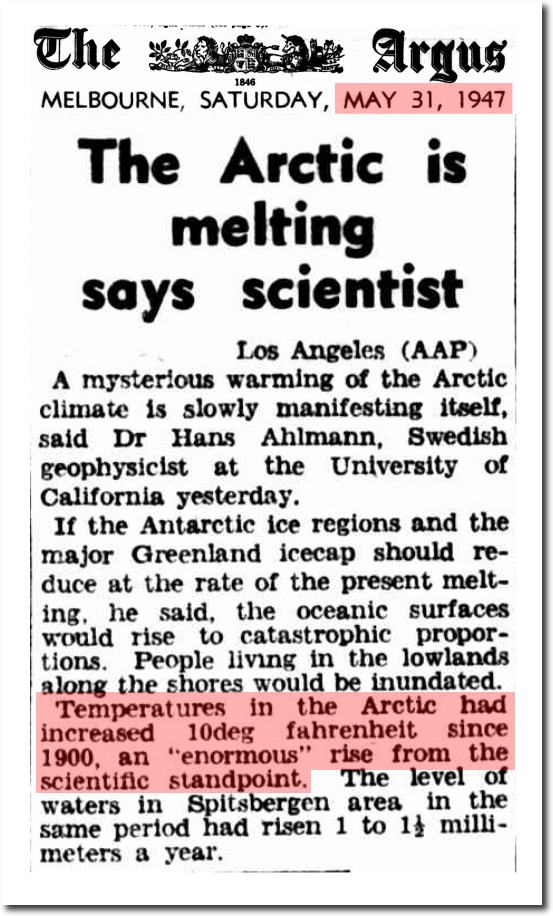
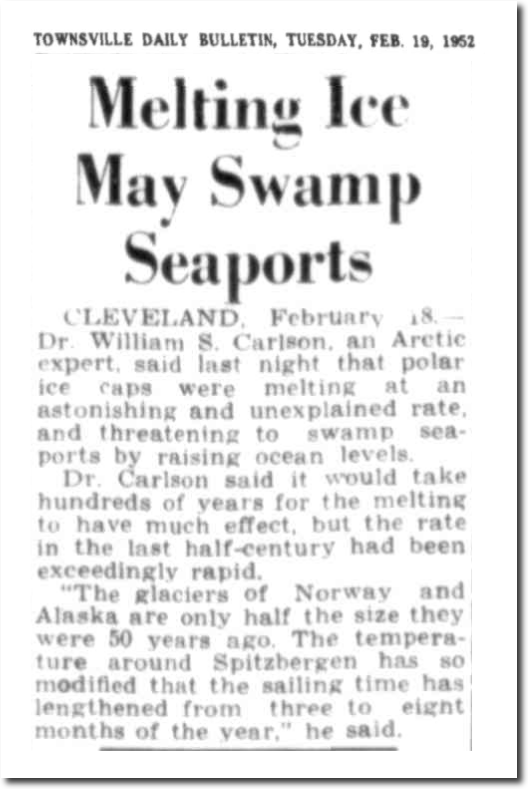
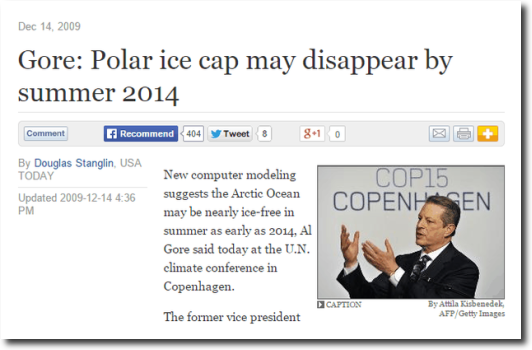
Making the heat of the 1930’s disappear is very important for the global warming scam.  Not only were CO2 levels low in the 1930’s but atmospheric H2O levels were also very low.

Spreadsheet    Data

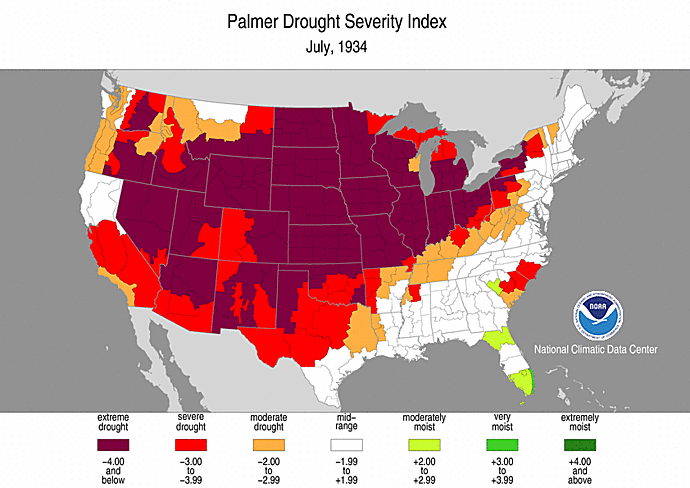
The US had severe or extreme drought coast to coast in 1934, meaning low levels of greenhouse gas H2O in the atmosphere.

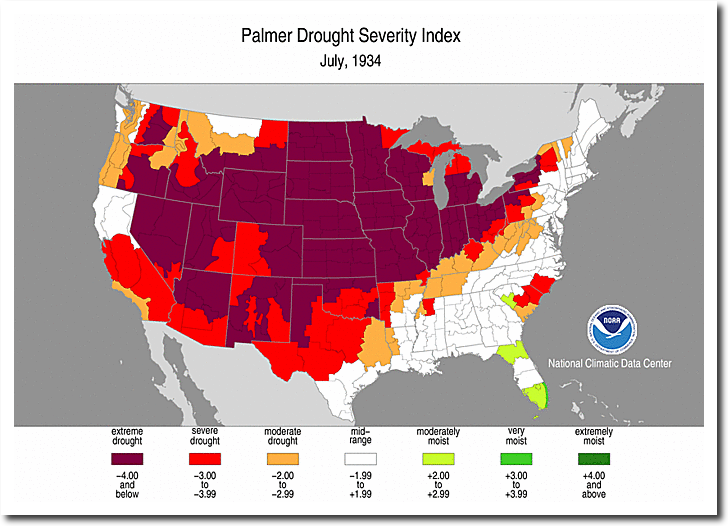
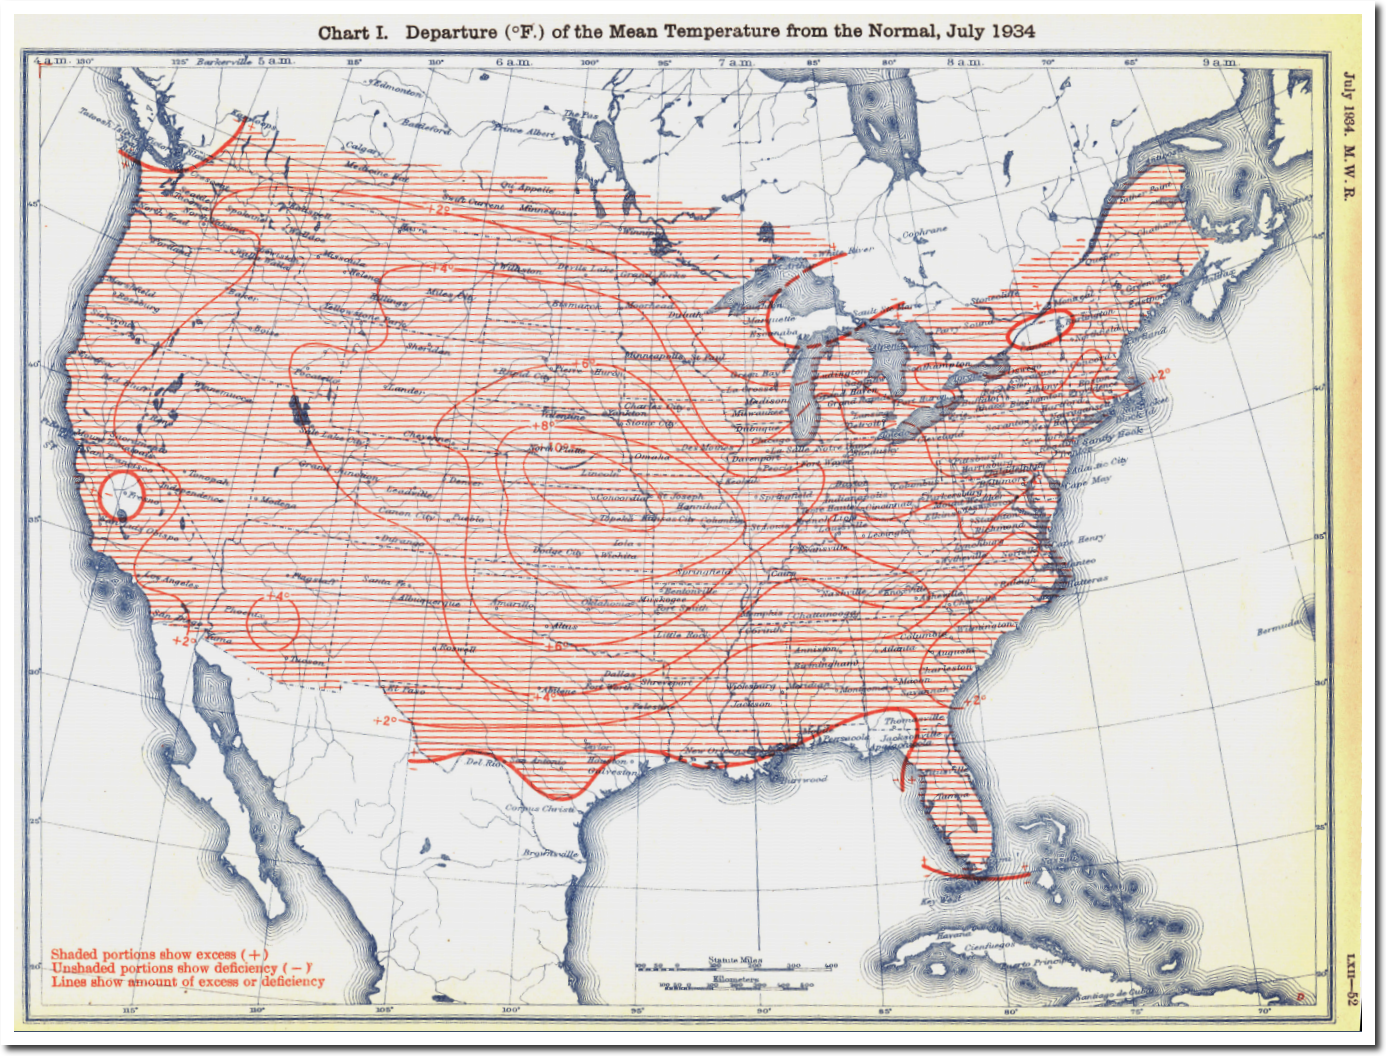
psi-193407.gif (690×488)

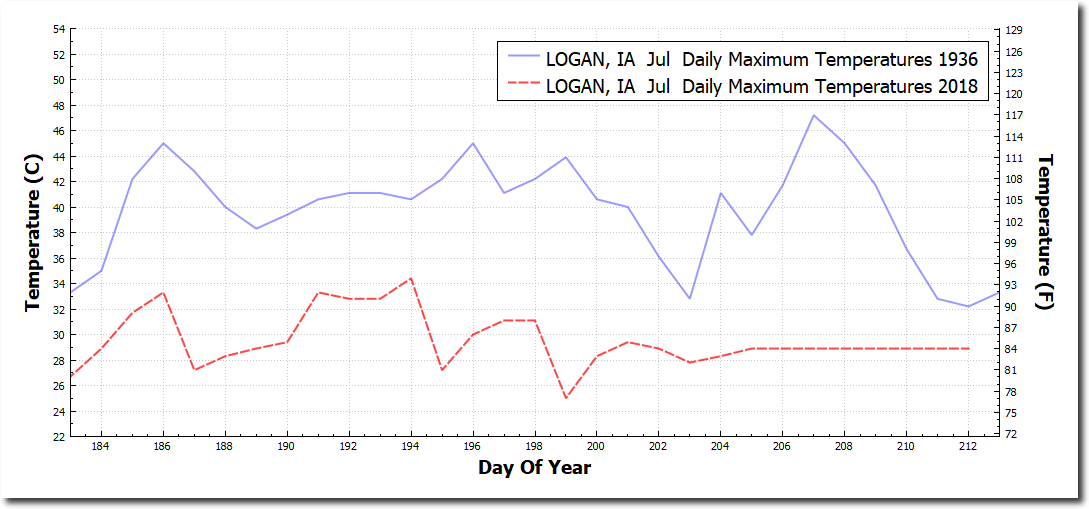
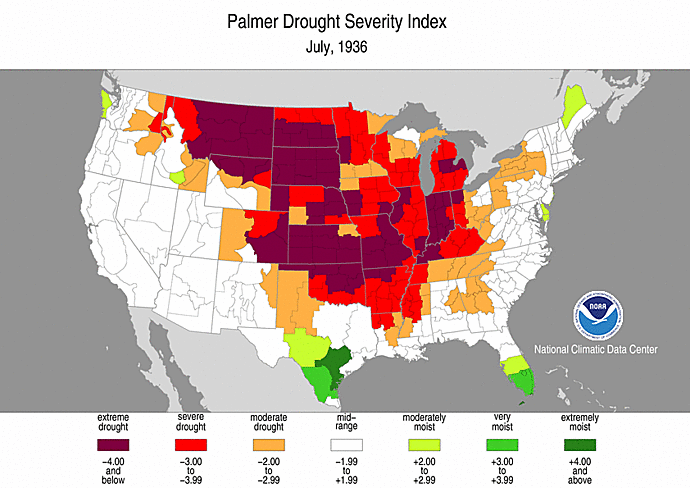
And not much better in 1936.

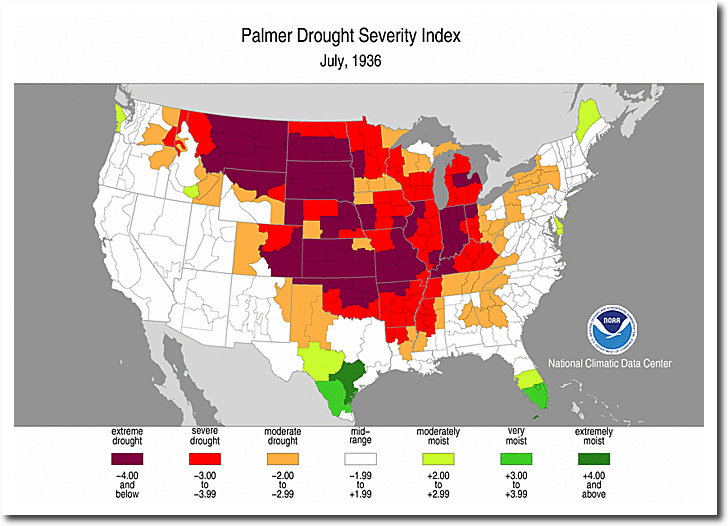
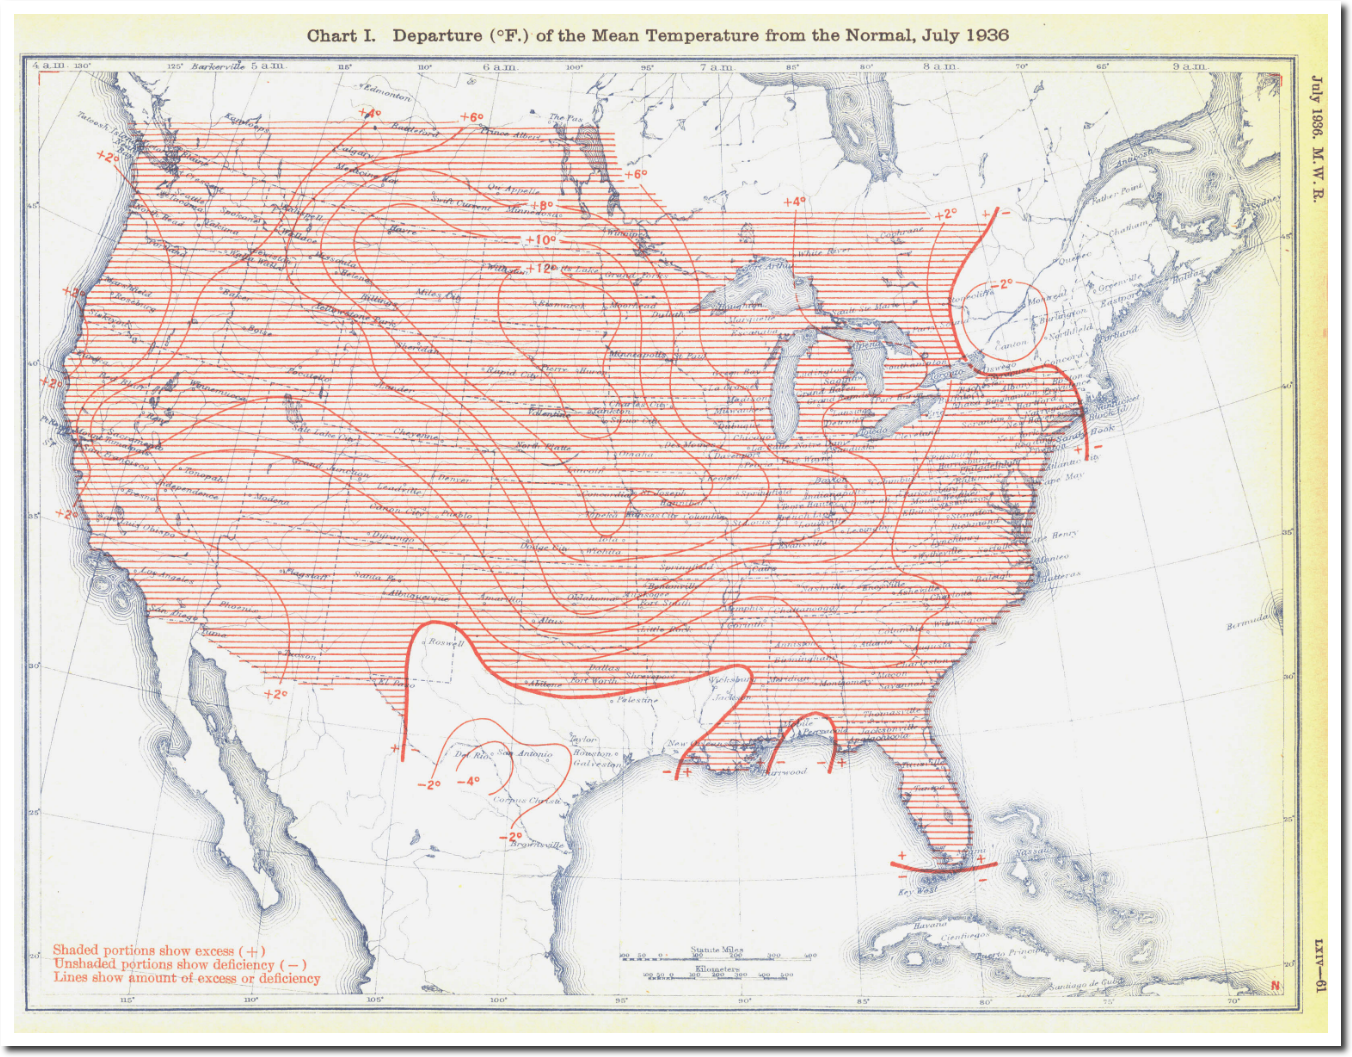
psi-193607.gif (690×488)

The drought was world-wide.

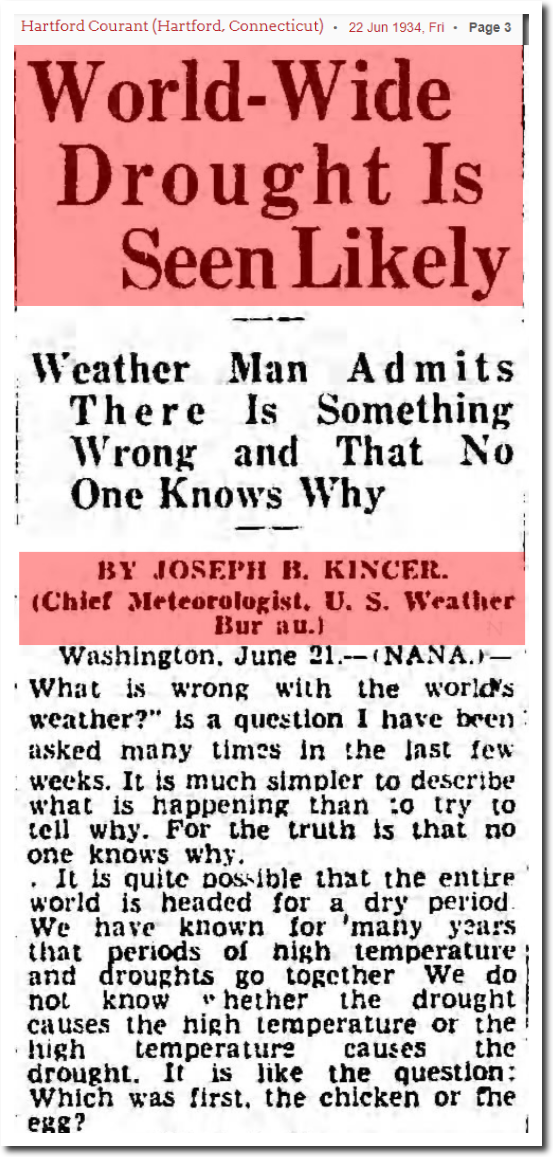
22 Jun 1934, Page 3 – Hartford Courant at Newspapers.com

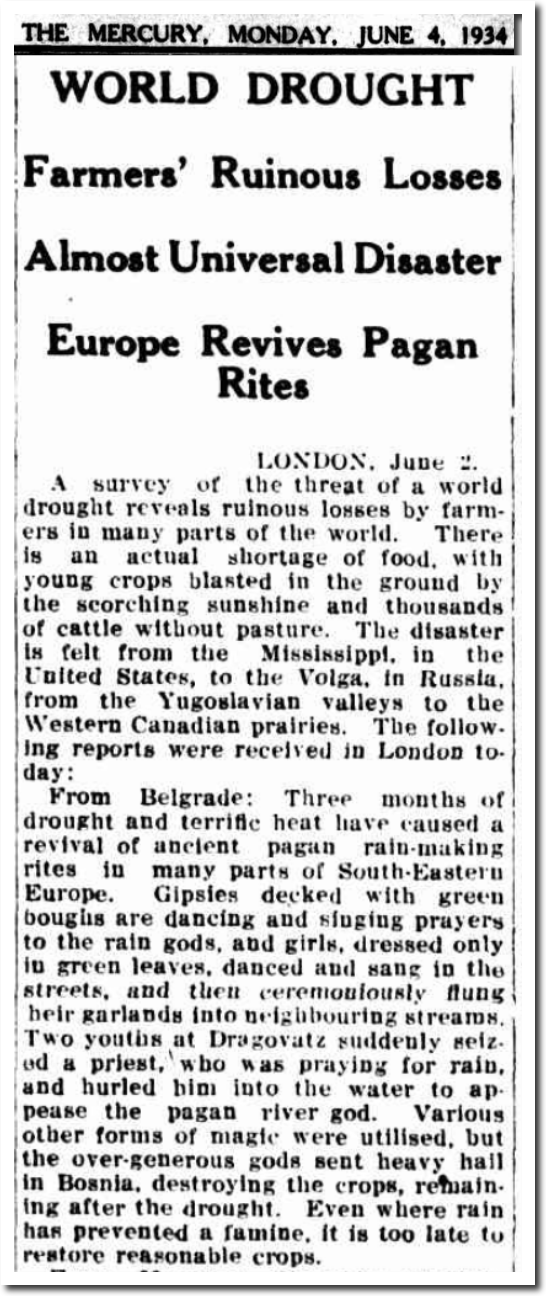
04 Jun 1934 – WORLD DROUGHT – Trove

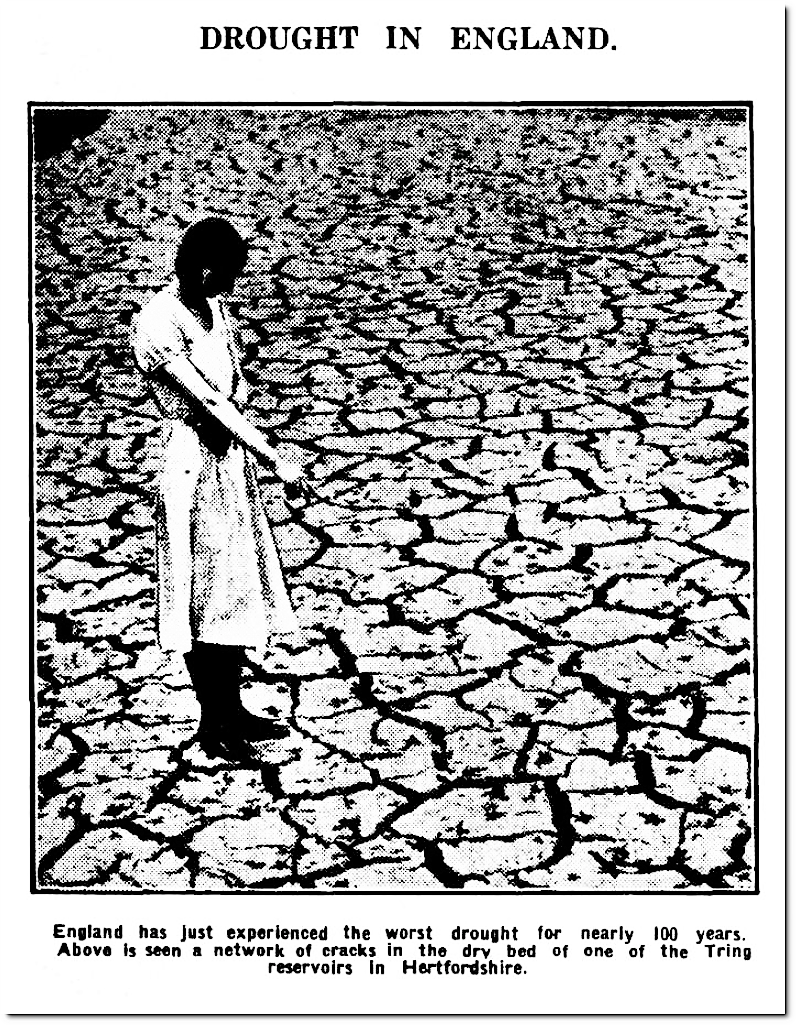
19 Jul 1934 – DROUGHT IN ENGLAND. – Trove

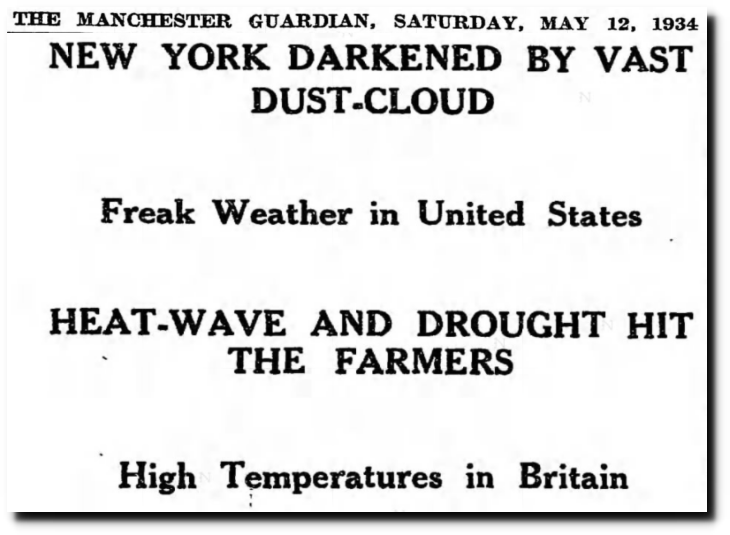
12 May 1934, 13 – The Guardian at Newspapers.com

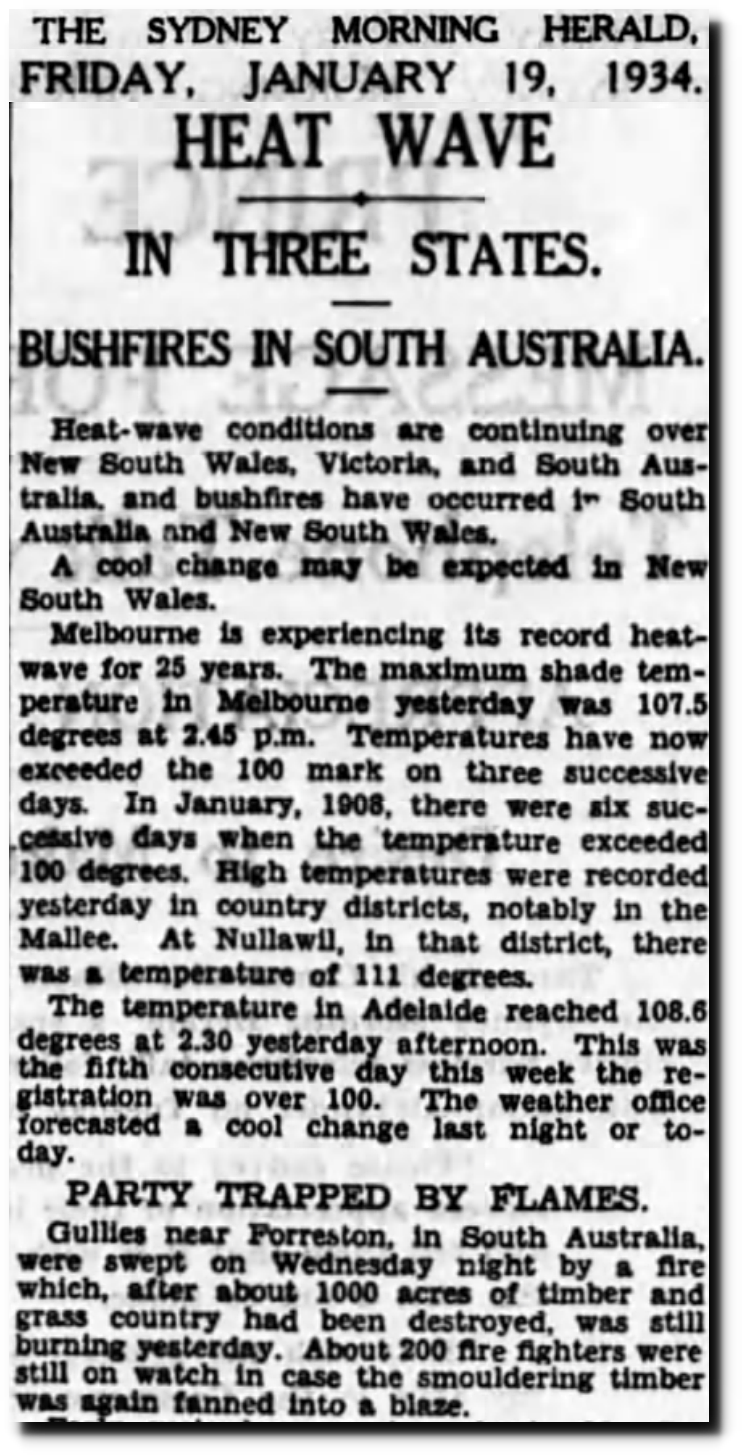
19 Jan 1934, Page 10 – The Sydney Morning Herald at Newspapers.com

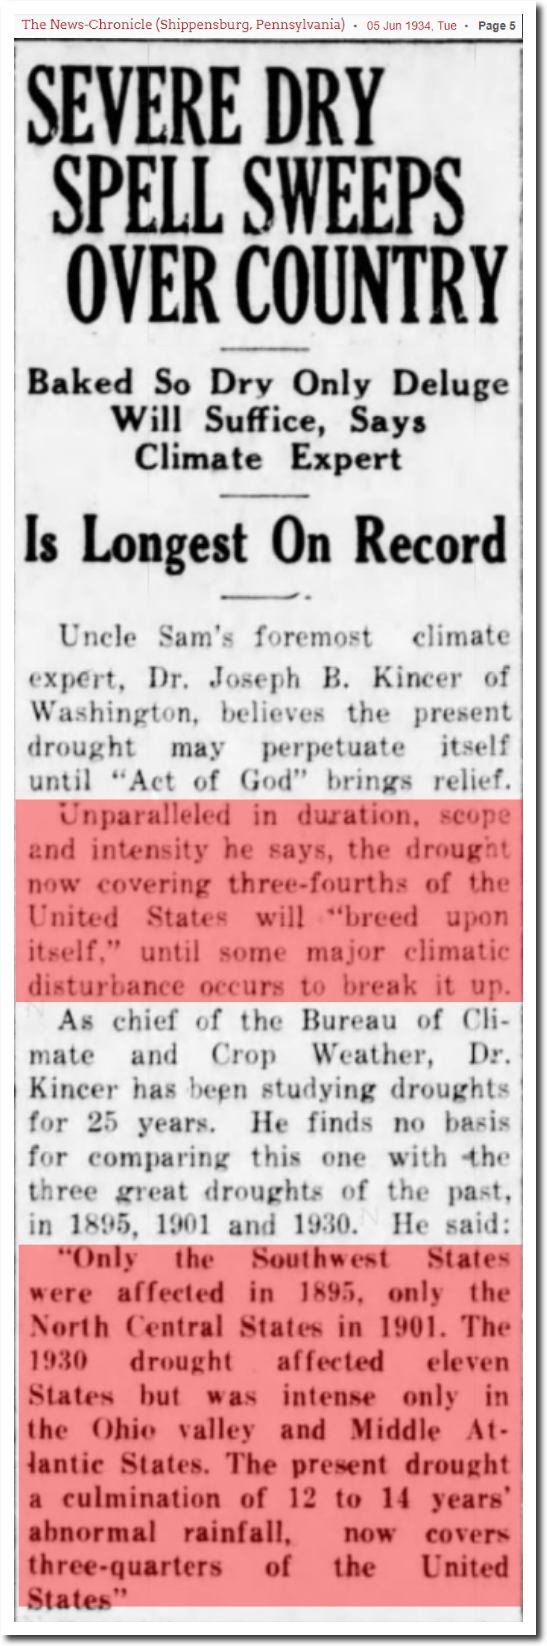
05 Jun 1934, Page 5 – The News-Chronicle at Newspapers.com

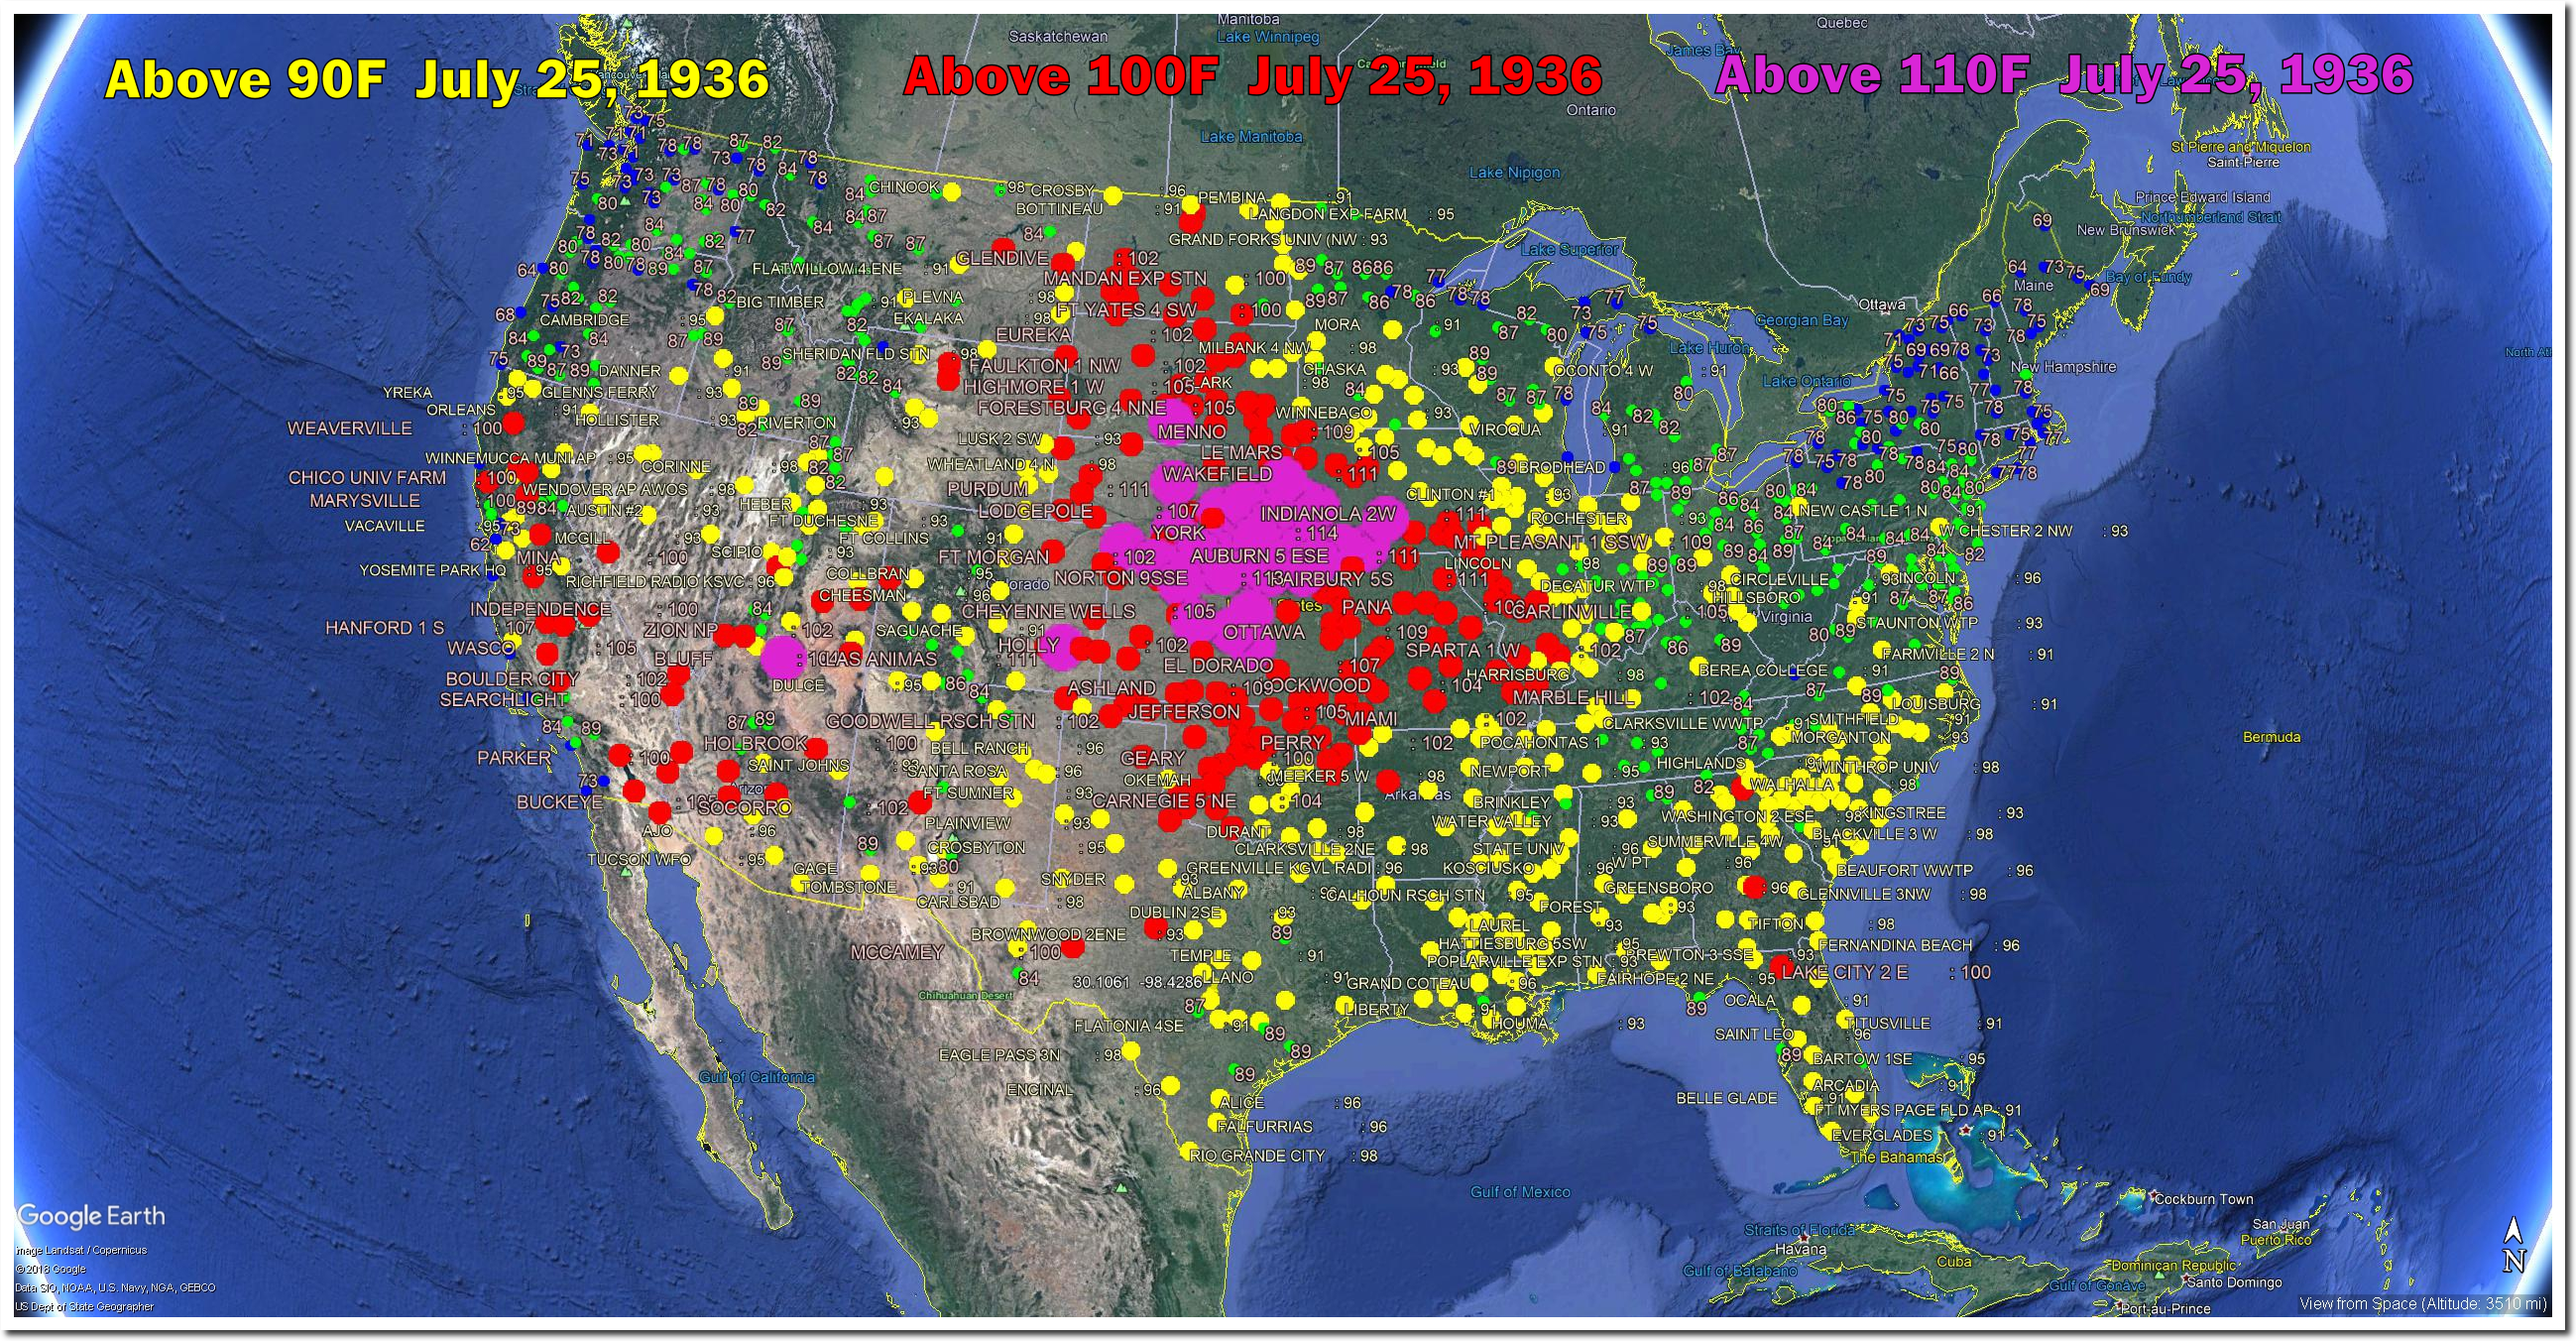
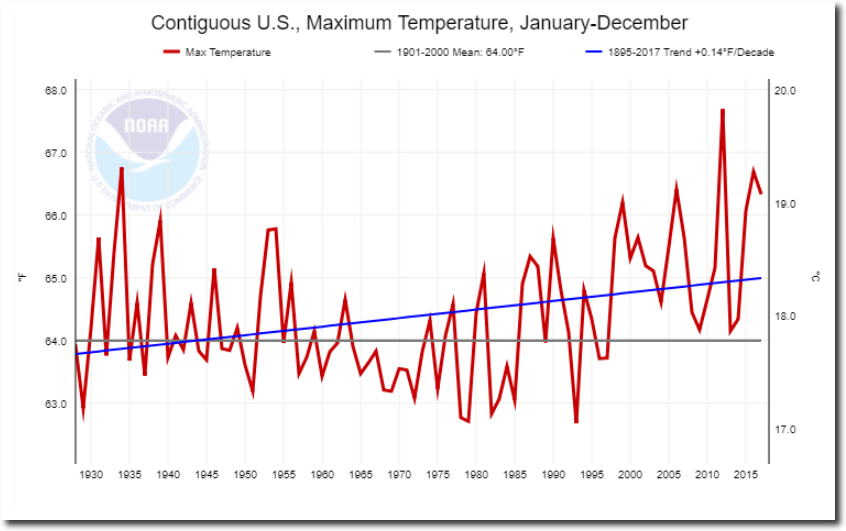
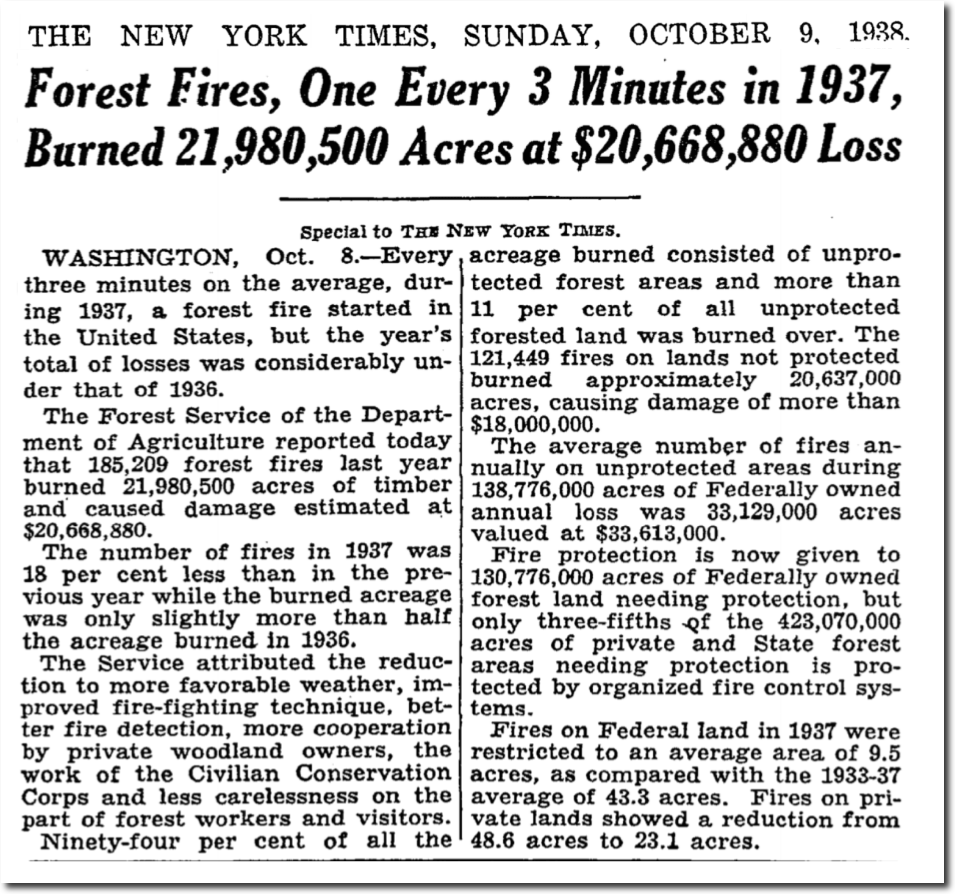
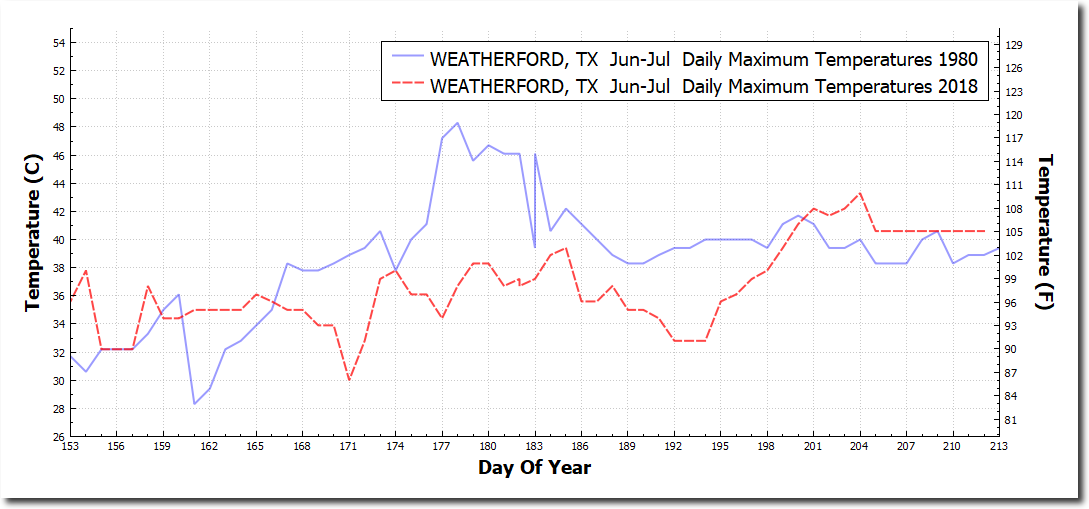
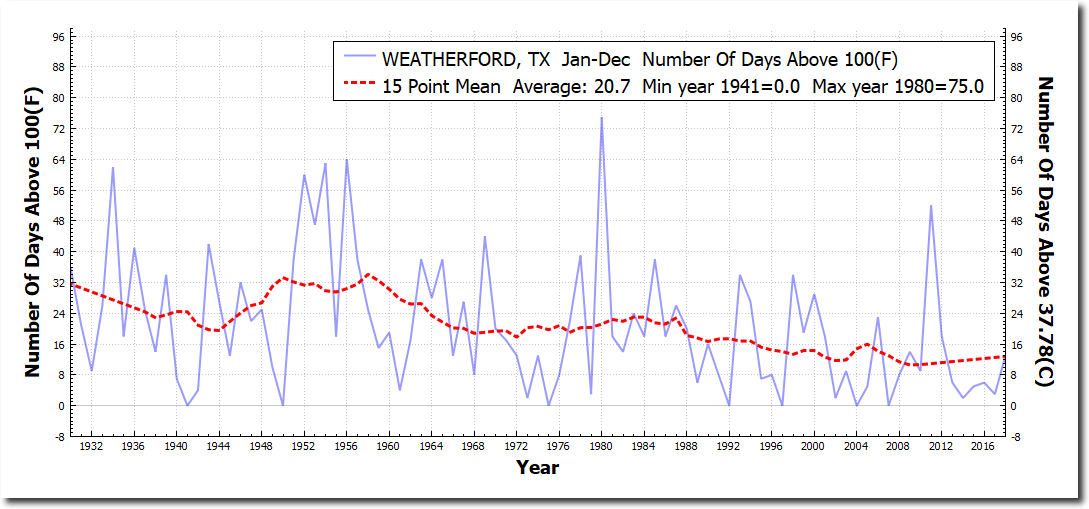
The summers of 1934 and 1936 were incredibly hot across the US.

mwr-062-07-c1.pdf

mwr-064-07-c1.pdf

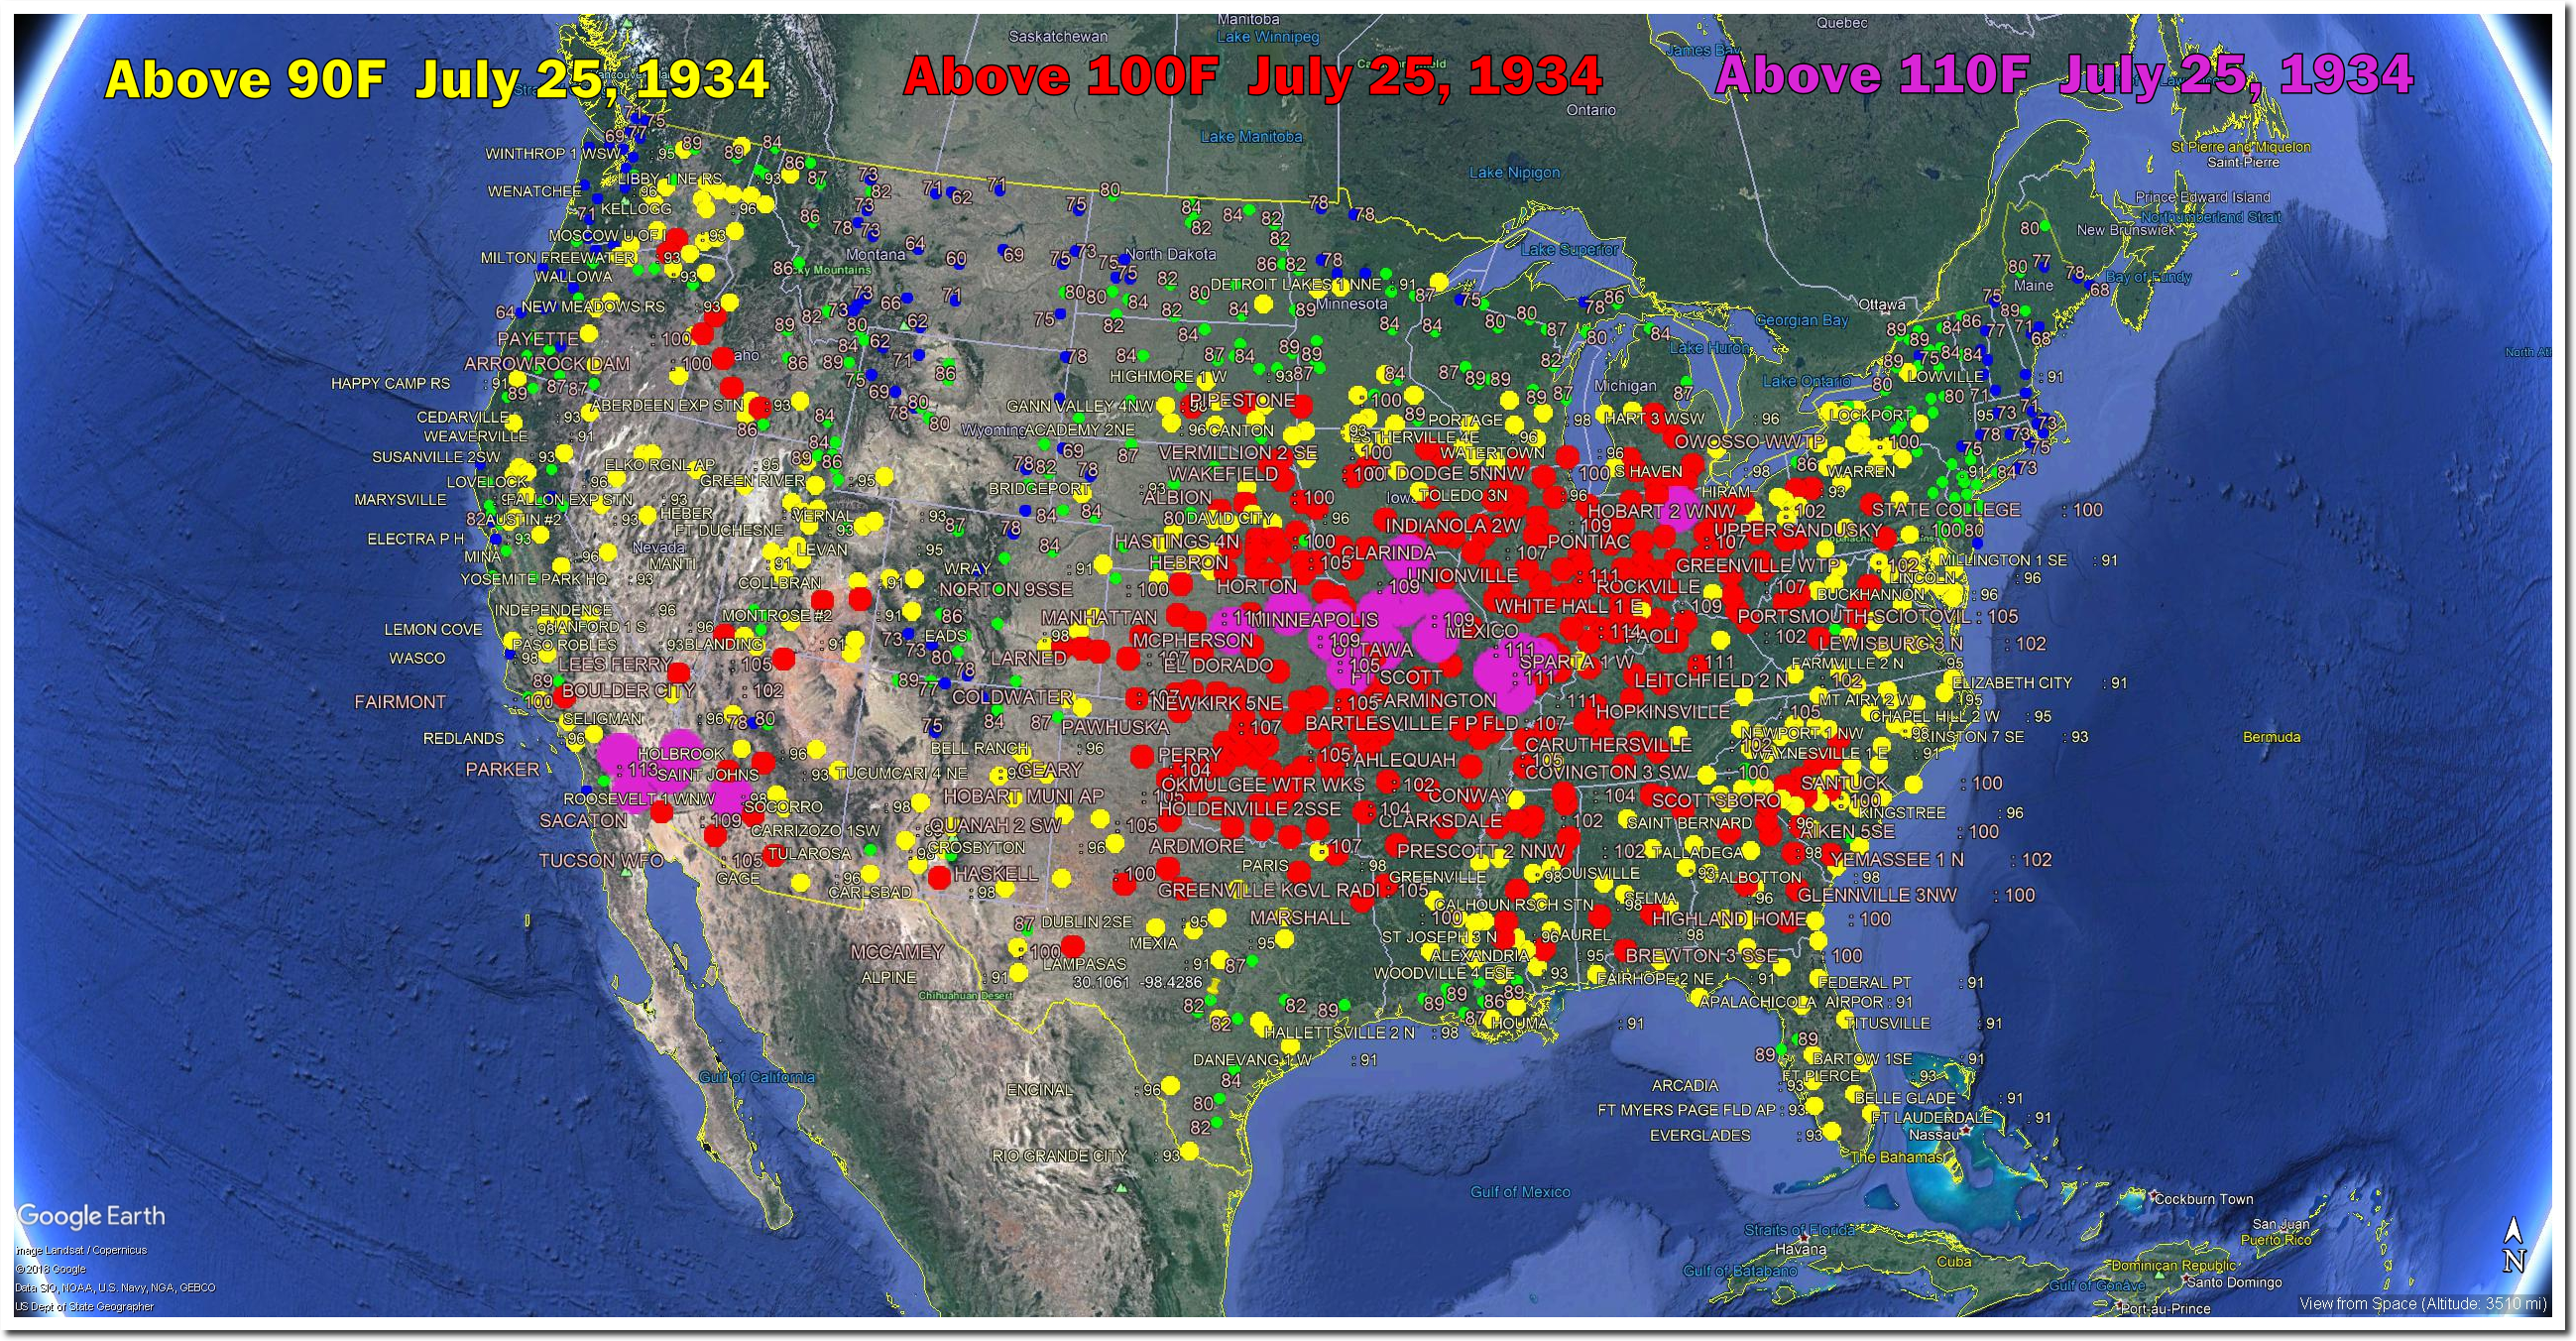
On July 25, 1934 it was 110 degrees in Kentucky, 114 degrees in Missouri, 113 degrees in Illinois, and 111 degrees in Ohio.

On July 25, 1936 it was 117 degrees in Iowa, 116 degrees in South Dakota, and 115 degrees in Nebraska.

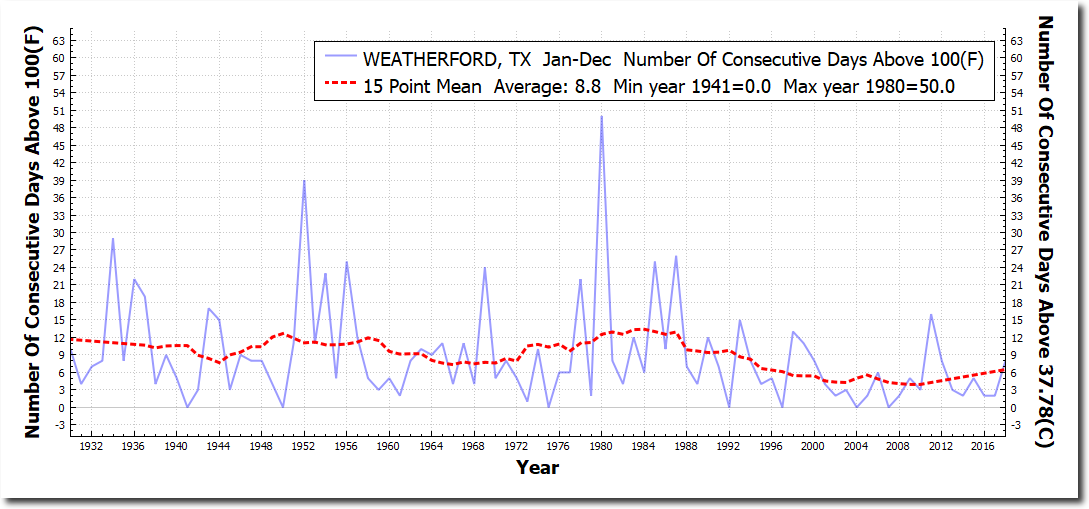
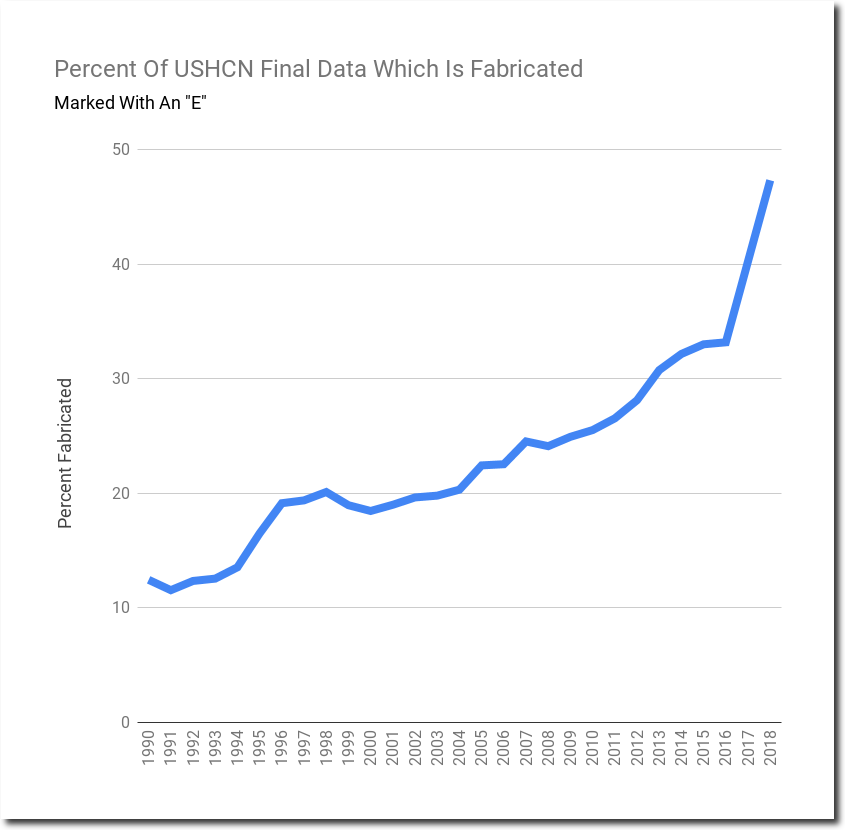
Temperatures that hot don’t occur in the Midwest any more, so it is necessary for fraudsters at NOAA to tamper with the data and make the past heat disappear.  And they don’t do it alone. Scientists around the world colluded to make past global warmth disappear.

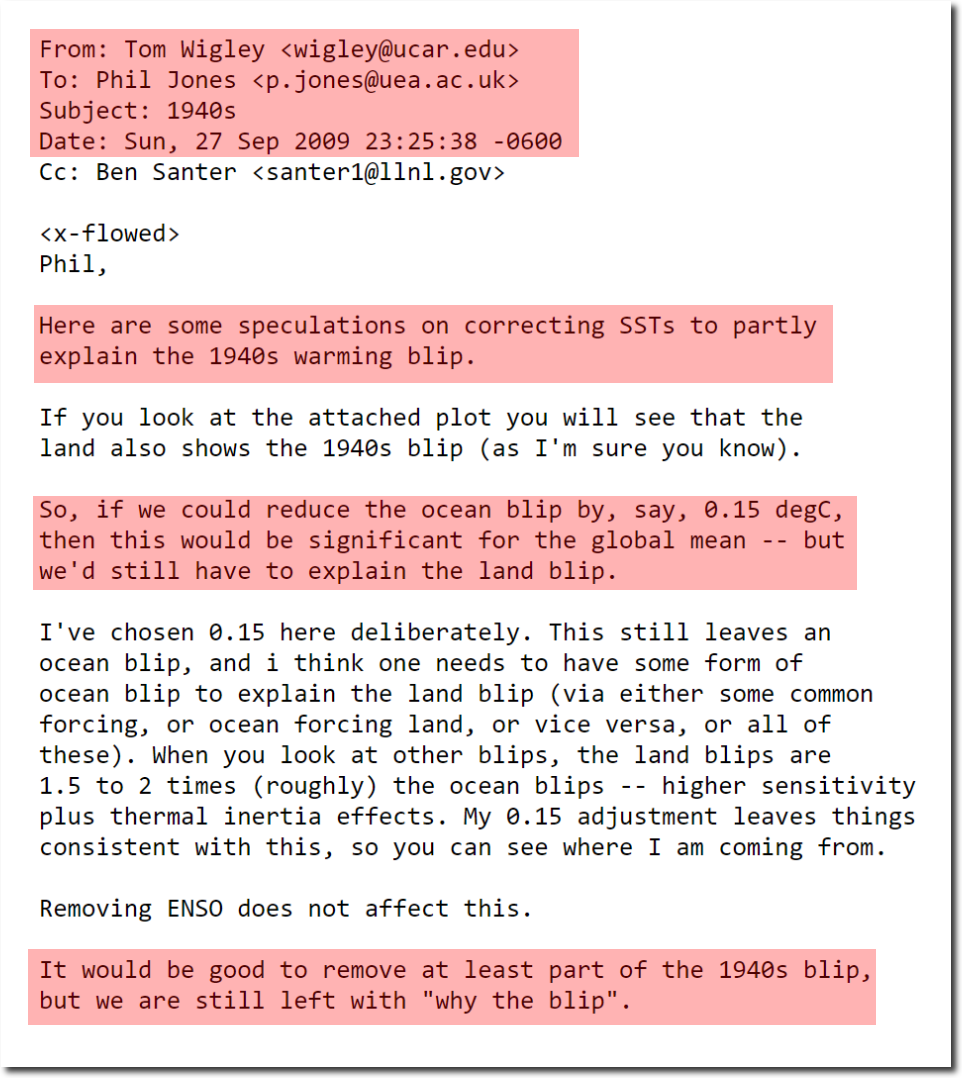
di2.nu/foia/1254108338.txt

Posted in Uncategorized | Leave a comment

NOAA US Data Tampering Update

According to NOAA, the US is burning up.

Climate at a Glance | National Centers for Environmental Information (NCEI)

But before data tampering, the US has been cooling for the past 90 years.  The claimed warming trend is entirely due to data tampering.

The data is altered in a spectacular hockey stick – with temperatures before the year 2000 progressively cooled, and temperatures after 2000 progressively warmed.

When plotted vs. CO2, it becomes clear that US warming is the ultimate junk science.  The data is being precisely altered to match CO2 theory, with an R² of 0.975.

Spreadsheet    Data

A lot of this fraud is done with good old fashioned “just making stuff up.” Almost half of the data is currently being fabricated. Forty-seven percent of the monthly US temperature data is marked by NOAA with an “E’ – which means it is estimated.

This junk science may seem really, really awful, but you are a racist if you don’t accept the reality of man-made warming data-tampering.

Posted in Uncategorized | Leave a comment

New Ice-Free Arctic Date

Arctic sea ice volume loss slowed again yesterday, so I am now pushing my ice-free Arctic forecast out to October 5, 2018 at 2:31 am.

Volume is the fourth highest in the DMI record, and likely to move into the #3 spot in about two weeks.

Spreadsheet    Data

Scientists, Nobel Prize winners and Democratic Party prophets have been predicting the ice-free Arctic for a very long time, and now we are only a few weeks away.

07 Apr 1923 – NORTH POLE MELTING. – Trove

31 May 1947 – The Arctic is melting says scientist – Trove

19 Feb 1952 – Melting Ice May Swamp Seaports – Trove

The Argus-Press – Google News Archive Search

Gore: Polar ice cap may disappear by summer 2014

Posted in Uncategorized | Leave a comment

Democrats And Morality

“She was a liar. She was an unethical, dishonest lawyer. She conspired to violate the Constitution, the rules of the House, the rules of the committee and the rules of confidentiality.”

  • Jerry Zeifman , Hillary Clinton’s Watergate Committee Boss

And her husband is a rapist.  Democrats nominated Clintons three times, and the most recent time they made the rapist spouse their keynote speaker.

Posted in Uncategorized | Leave a comment