Disrupting the Borg is expensive and time consuming!
Google Search
-
Recent Posts
- Cattle And The Climate
- One Atomic Bomb Per Hour
- New Video : Analyzing Oil And Gas
- Is Antarctica Melting?
- High Speed Analysis And Visualization
- El Nino To The Rescue?
- Fake News Update
- Growth Of Antarctic Sea Ice
- 65 Years Of Progress!
- El Nino To The Rescue?
- Worst March Drought On Record
- ChartGL Process Control Demo
- The Biggest Money Laundering Scam
- Drought In The Headwaters Of Lake Powell
- Unrealistic Expectations Of Water Availability
- Did Bill Gates Do This?
- Worst March Drought On Record In The US
- The Real Hockey Stick Graph
- Analyzing The Western Water Crisis
- Gaslighting 1924
- “Why Do You Resist?”
- Climate Attribution Model
- Fact Checking NASA
- Fact Checking Grok
- Fact Checking The New York Times
July 2026 M T W T F S S 1 2 3 4 5 6 7 8 9 10 11 12 13 14 15 16 17 18 19 20 21 22 23 24 25 26 27 28 29 30 31 Recent Comments
- Billyjack on Cattle And The Climate
- Bob G on One Atomic Bomb Per Hour
- Jack the Insider on One Atomic Bomb Per Hour
- arn on One Atomic Bomb Per Hour
- Bob G on One Atomic Bomb Per Hour
- Hank Phillips on One Atomic Bomb Per Hour
Doom Arrives For Arctic Alarmists
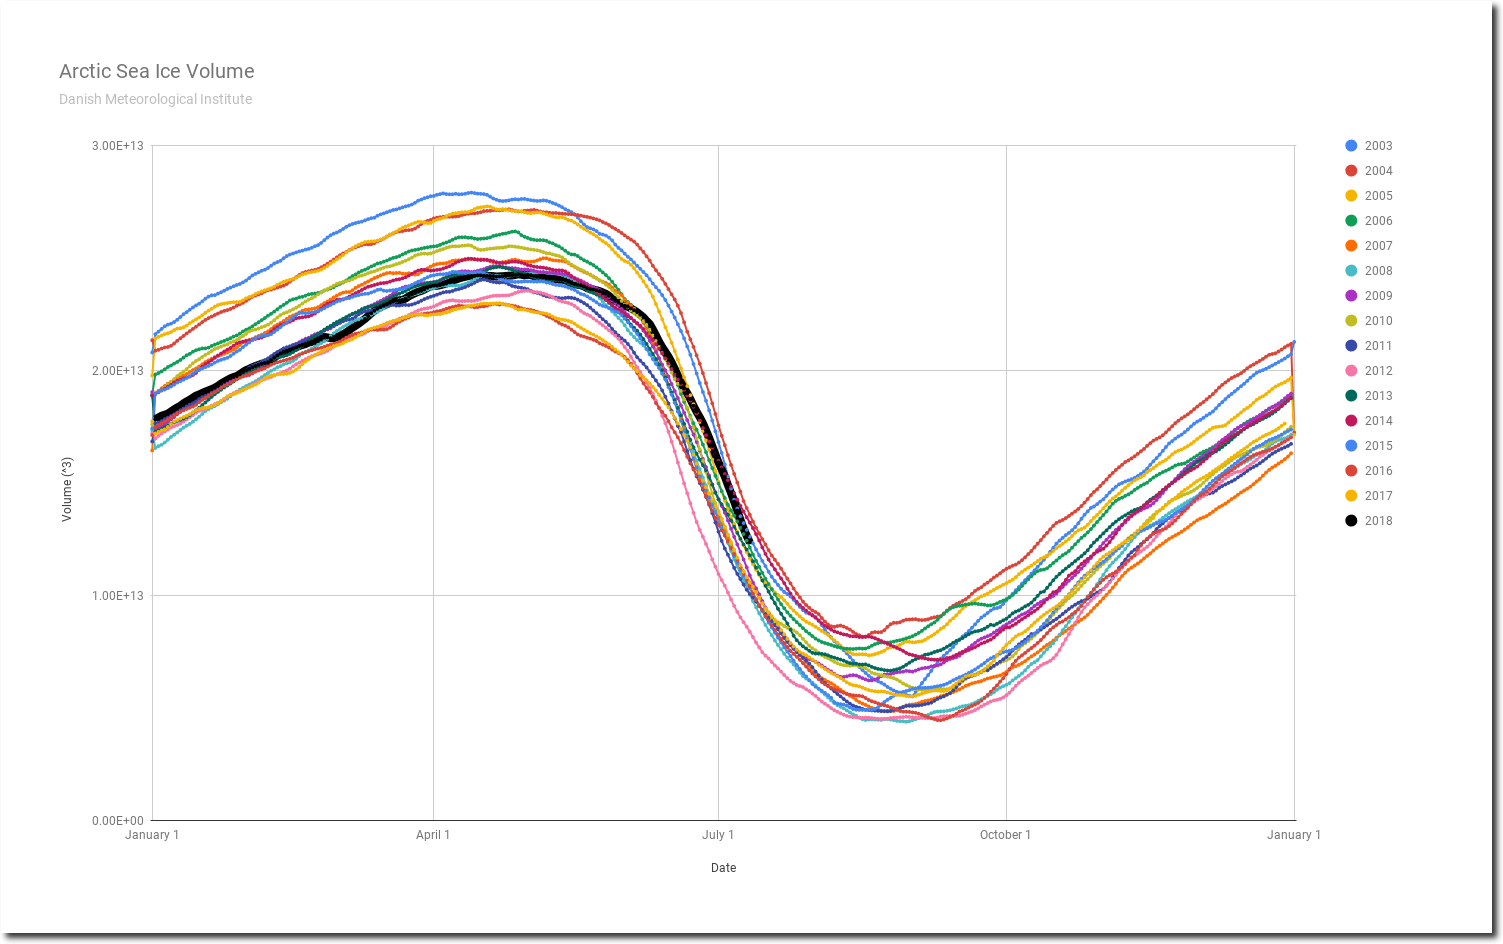
Arctic sea ice volume melt rates have started to slow, with ice volume 4th highest since 2003.
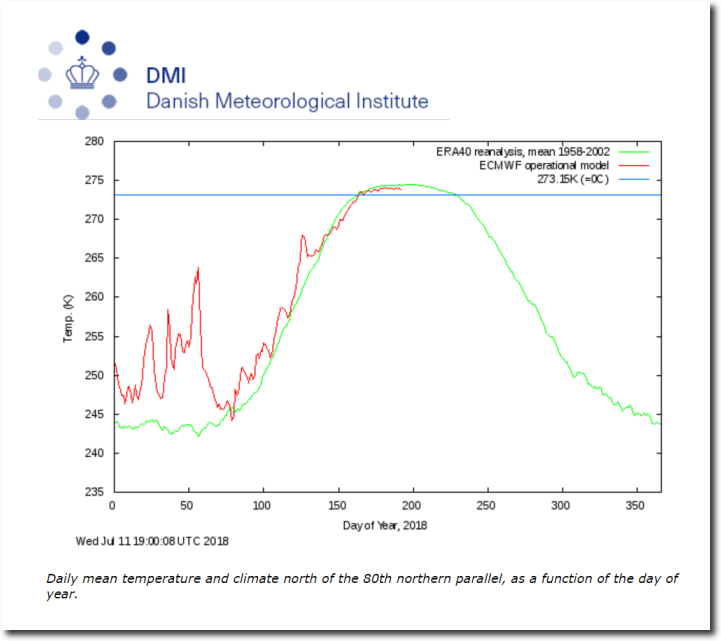
Temperatures near the pole have been below normal almost every day this summer.
Ocean and Ice Services | Danmarks Meteorologiske Institut
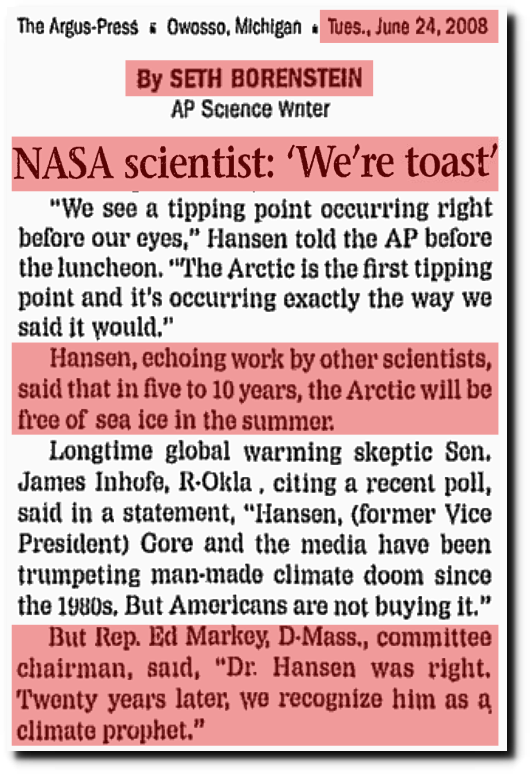
Time is running out for the Democrats’ prophet, who predicted ice-free no later than 2018.
The Argus-Press – Google News Archive Search
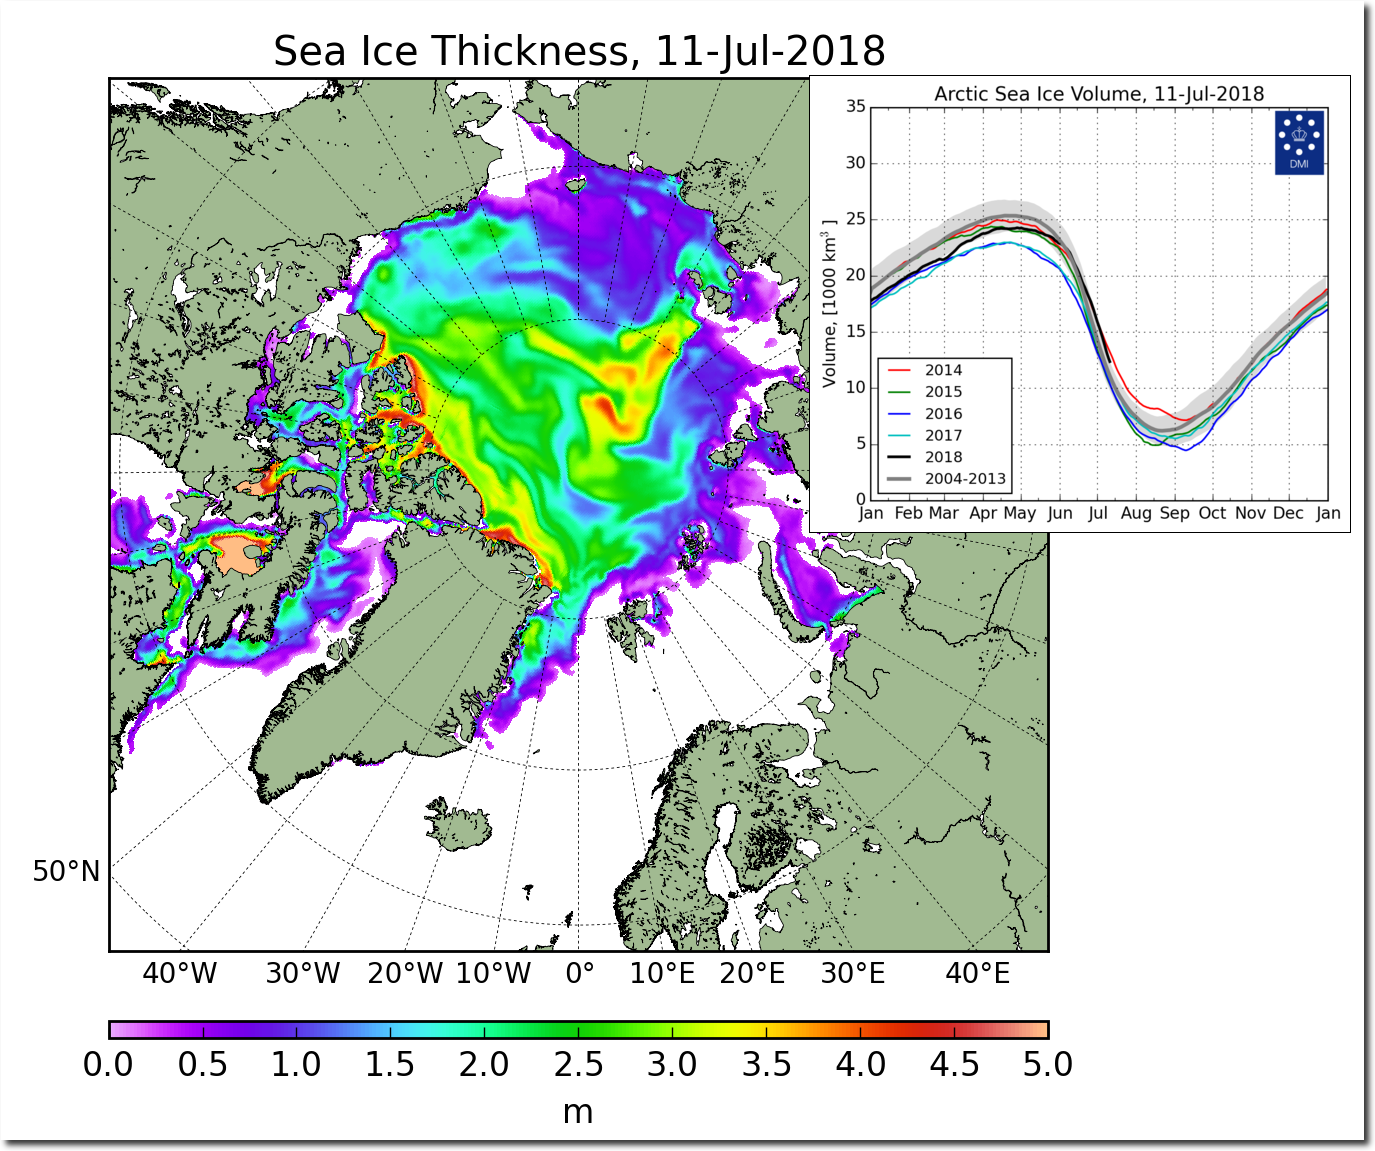
He has a lot of work to do in the next couple of weeks, including melting the thick ice blocking the Northern Sea Route and Northwest Passages.
FullSize_CICE_combine_thick_SM_EN_20180711.png (1337×1113)
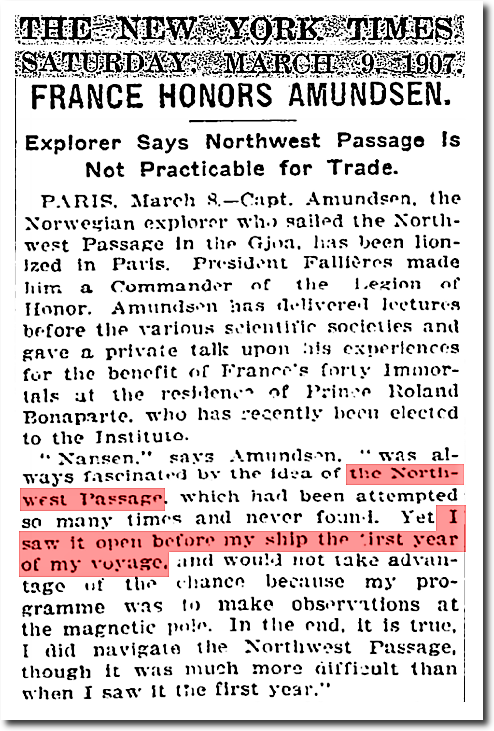
The Northwest Passage was open in 1903, but perhaps not this year.
According to NASA, 1904 was the coldest year on record. In the world of climate science, ice melts when it is cold and freezes when it is hot.
Meanwhile, climate scientists and the press continue their usual barrage of lies.
Posted in Uncategorized
Leave a comment
Trump Protesters
The usual fake news sources are reporting on Trump protesters in London, which reminded me of fifteen years ago.
I was in London during Bush’s 2003 visit. There were about six stoners holding signs in front of Buckingham Palace, and CNN reported it as a massive protest. Later CNN reported that tens of thousands of protesters were in Trafalgar Square. I was in Trafalgar Square (which isn’t big enough to hold more than a couple of thousand people) during the protest. There were also a couple of hundred of marchers surrounded by a line of police marching down Oxford Street.
There was a big event however that week. England won the Rugby World Cup, and the pubs were full to the brim at 8am in cold, pouring rain. About half a million people lined up on Whitehall for the parade when the team returned from Australia. People were singing and partying all night long in Leicester Square. CNN must have gotten that confused with their imaginary protesters.
Posted in Uncategorized
Leave a comment
46th Hottest June On Record
The NOAA web site says June. 2018 was third warmest on record in the US.
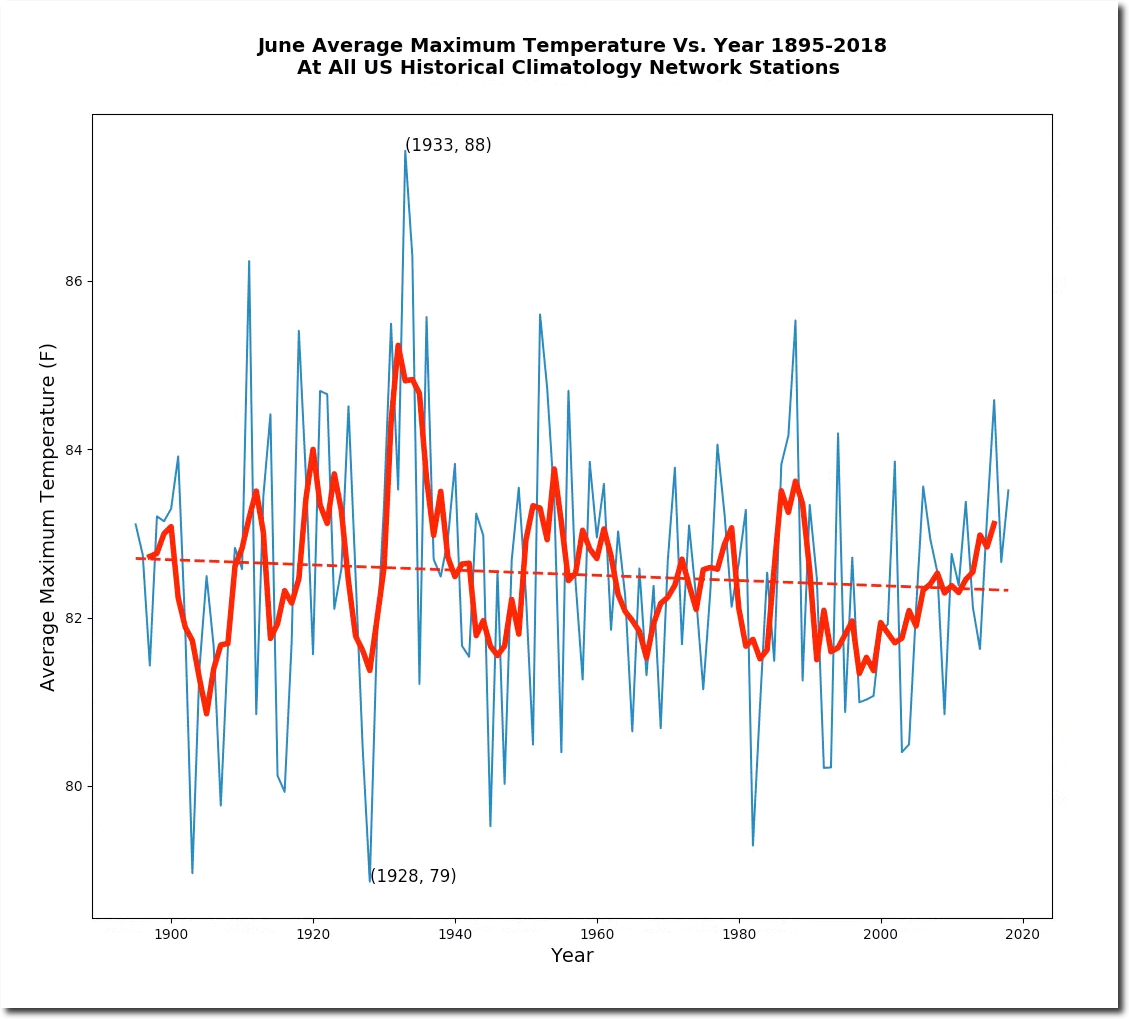
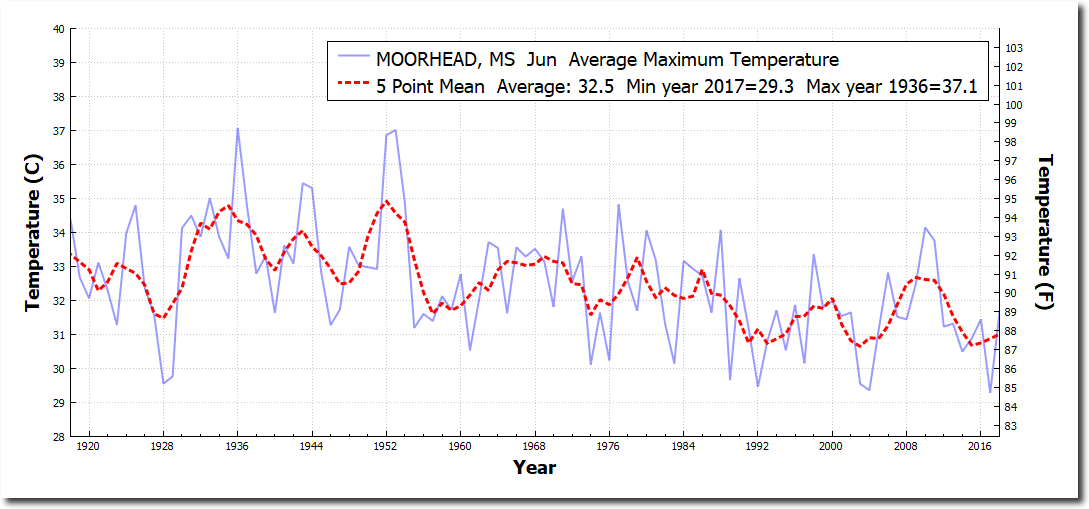
The un-tampered NOAA data shows that afternoon temperatures were 30th warmest, and not much above average.
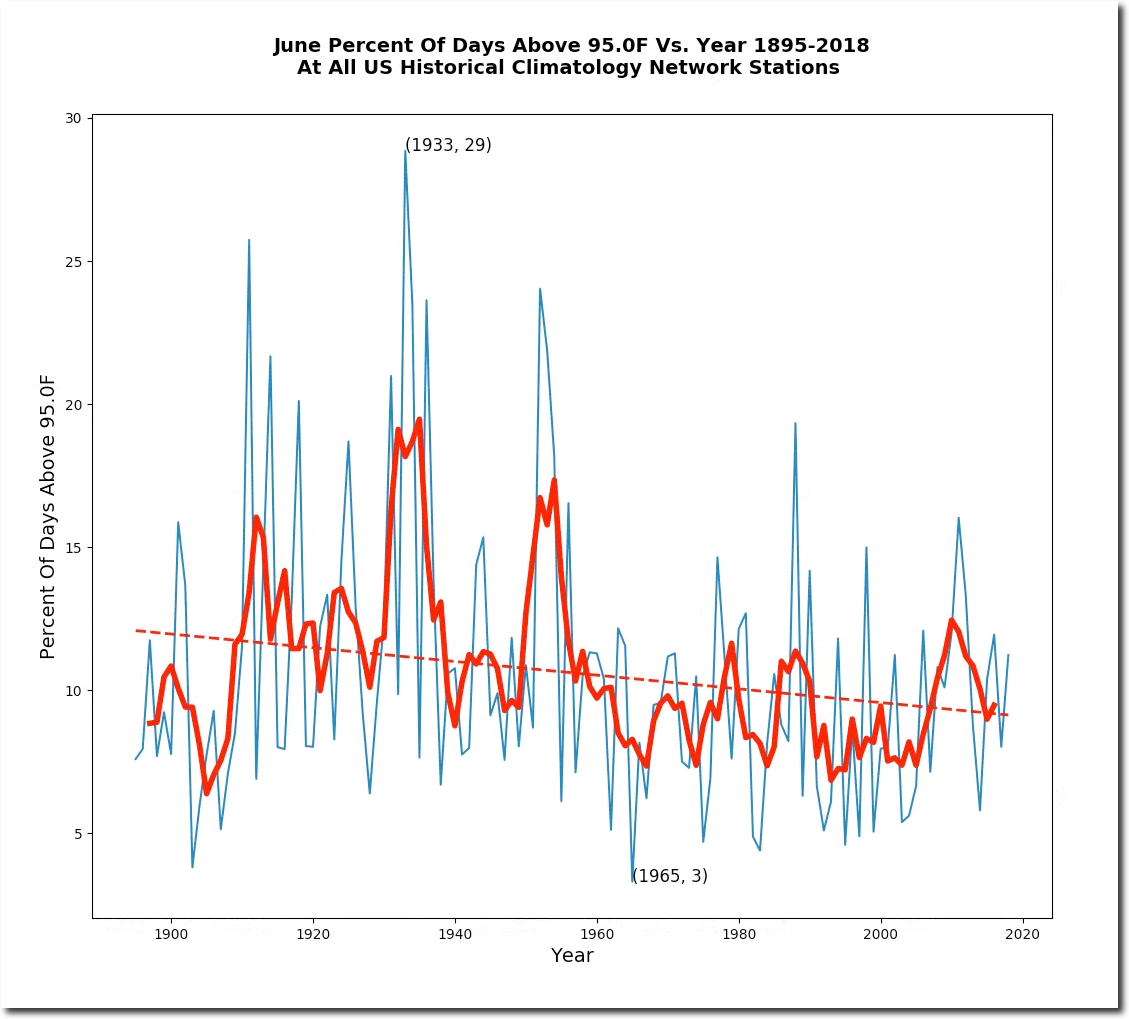
The percent of days above 35C (95F) was 46th highest. Pretty close to average.
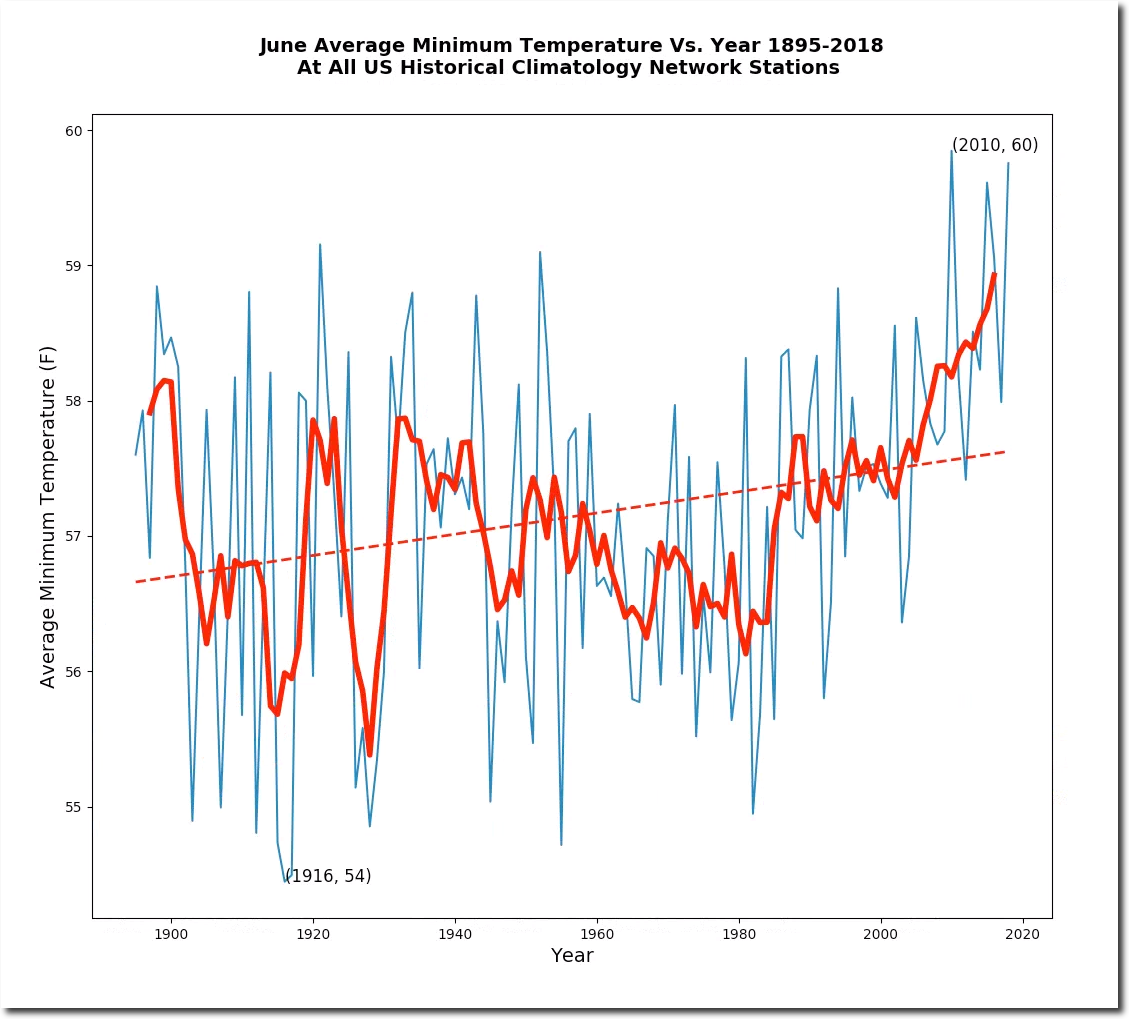
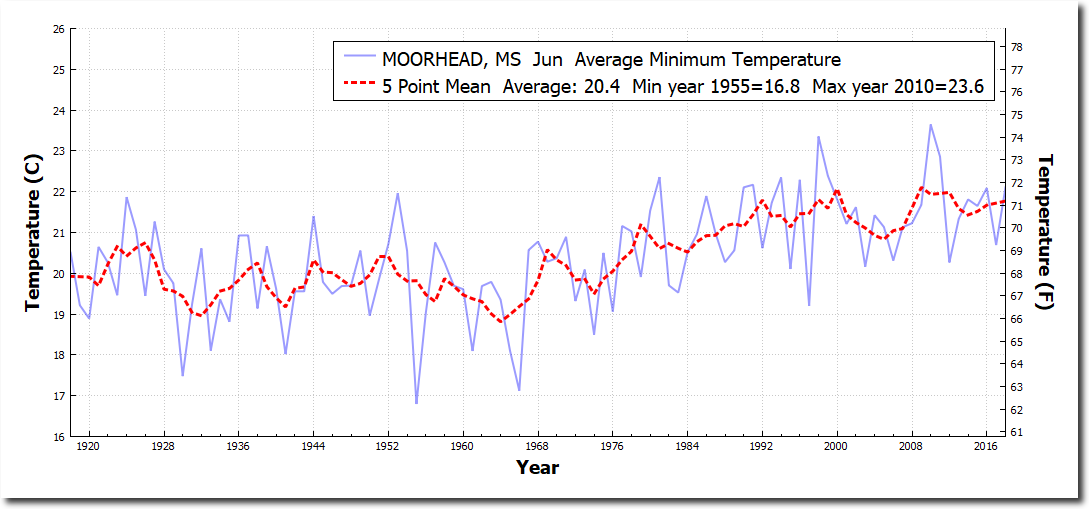
But minimum temperatures (which have been going up rapidly since the year 2000) were second warmest.
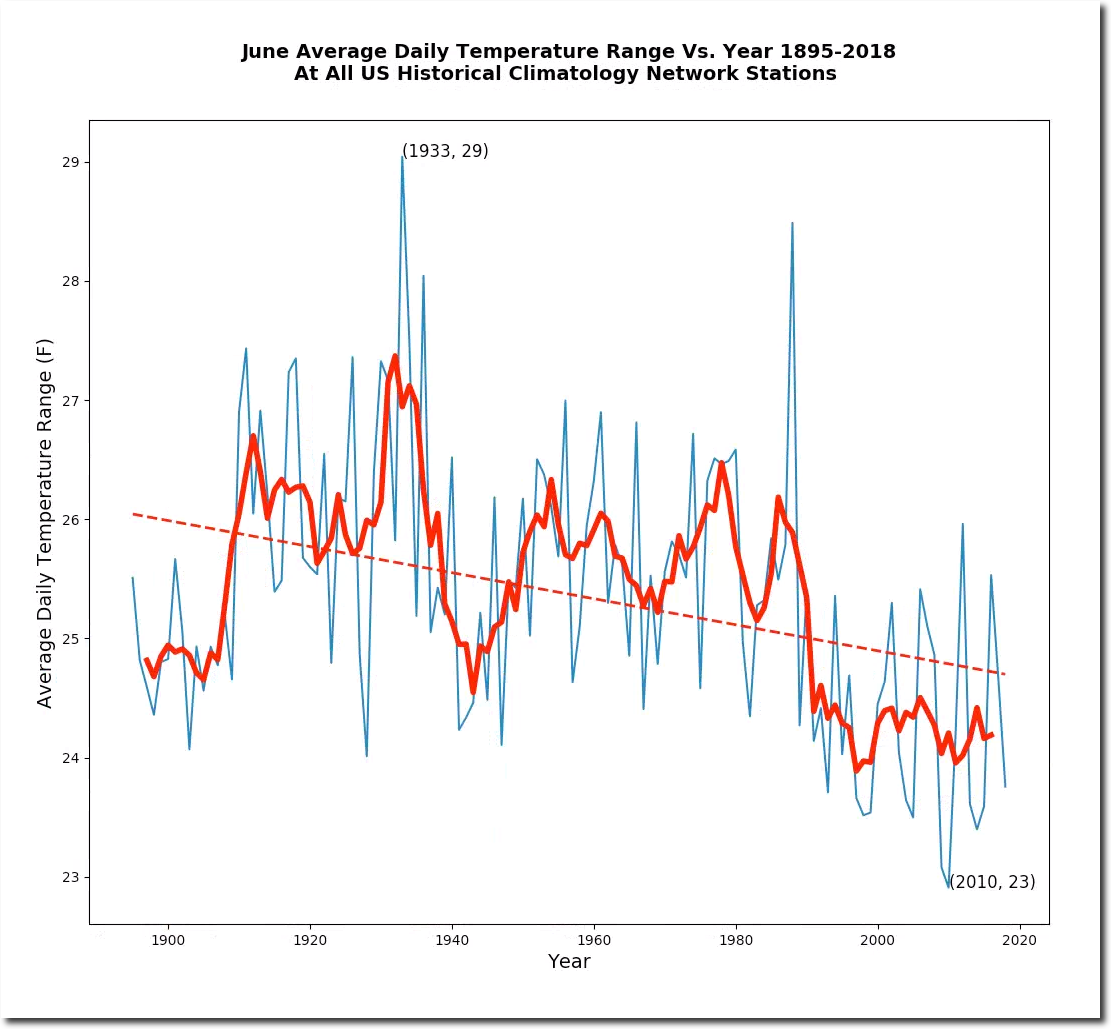
The average daily temperature range plummeted to record lows around the year 1990, and has remained there.
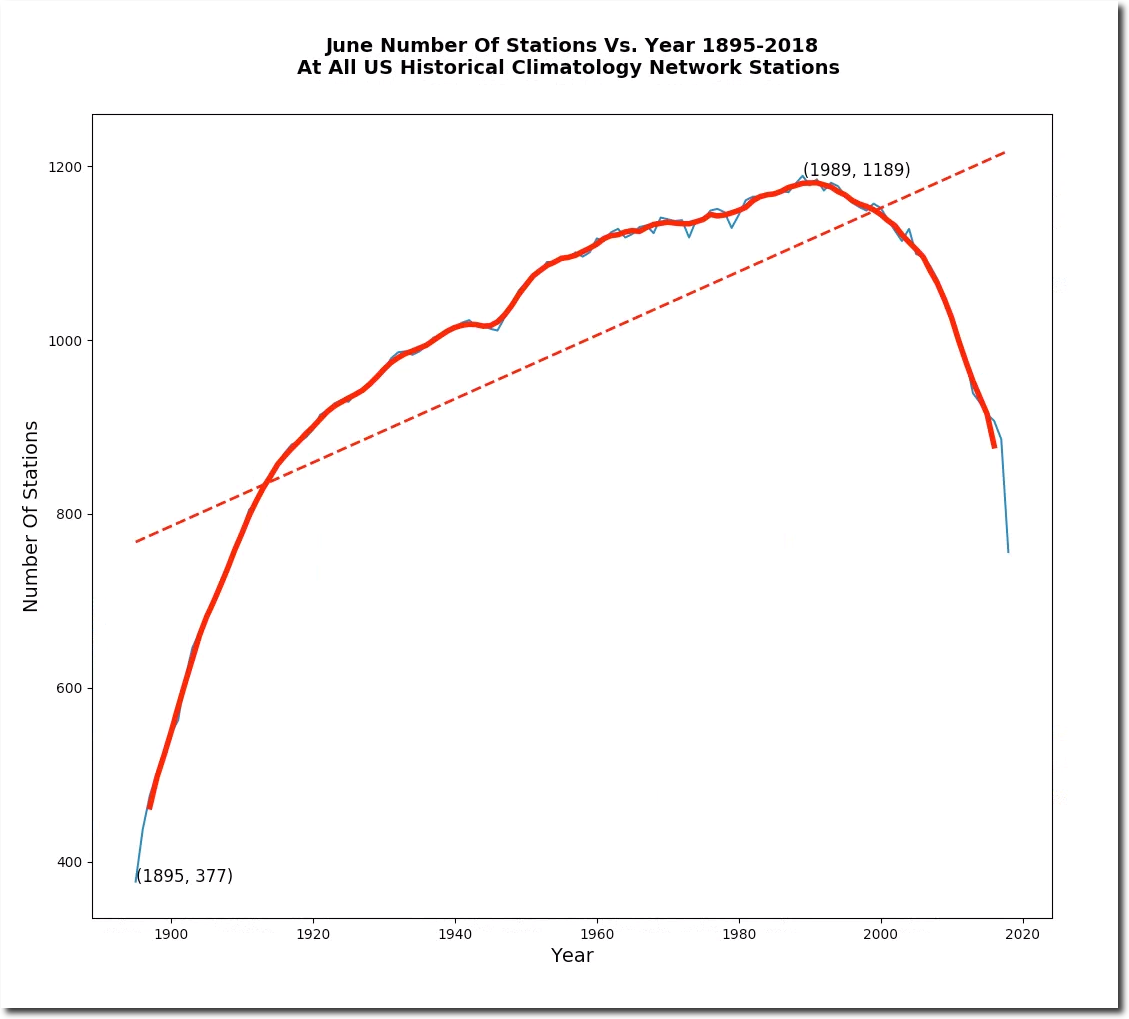
So what is causing minimum temperatures to go up since the year 2000? I don’t know, but since the year 2000, NOAA has lost almost a third of their June station data.
Moorhead, Mississippi is a good example of a station which is showing cooler June afternoons and warmer June nights.
Posted in Uncategorized
Leave a comment
Finally – Proof That Global Warming Is Man Made
Scientists have searched for years for proof that global warming is man-made, but the evidence is right under their noses on the NASA web site. Global warming is man-made, by these two people.

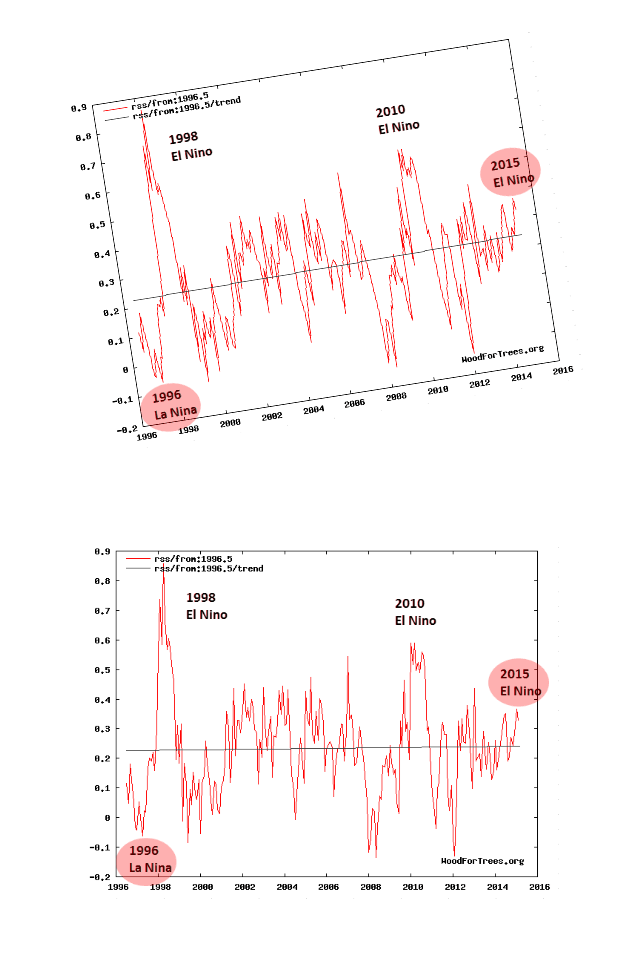
In the year 2000, NASA showed earth warming at less than 0.4C per century. But by 2017, they had more than doubled the pre-2000 warming rate to more than 0.8C per century.
This was accomplished through an impressive hockey stick of data tampering, where years before 1970 are progressively cooled, and years after 1970 are progressively warmed.
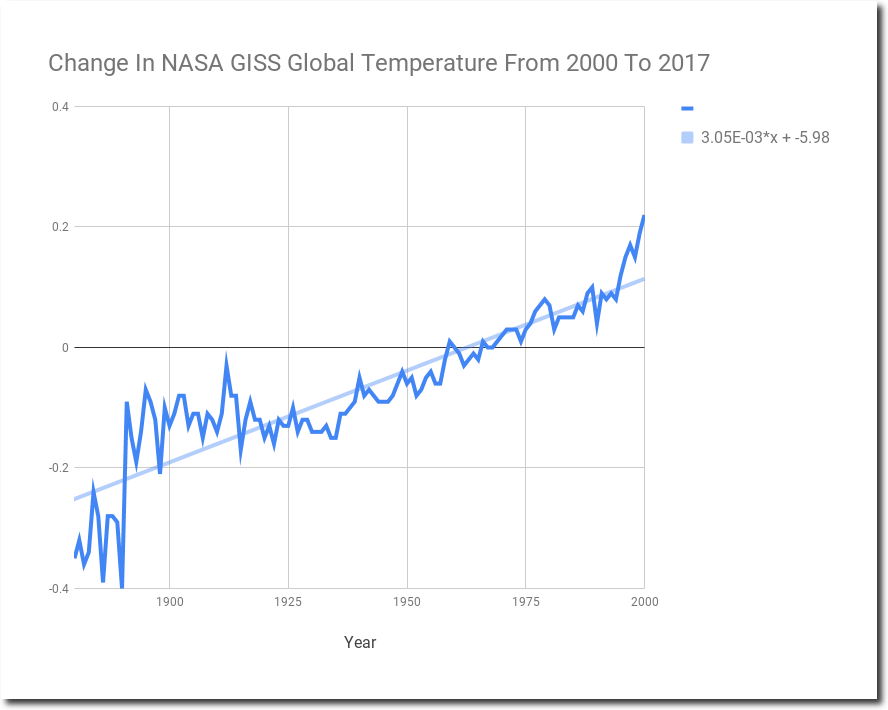
Nothing at all suspicious about climate modelers tampering with data to make it match their failed theories.
Note that after 1998, the observations are likely to be below the simulated values, indicating that the simulation as a whole are predicting too much warming.
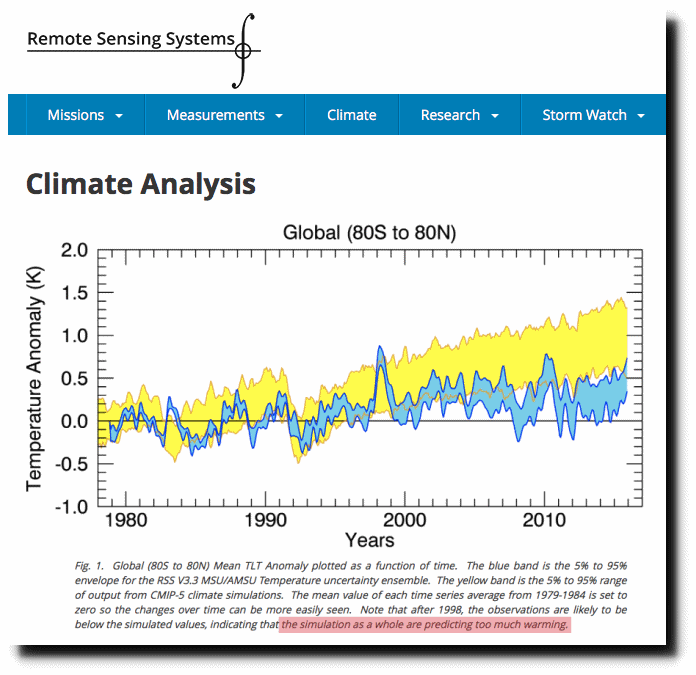
Climate Analysis | Remote Sensing Systems
And then pressuring other climate scientists to also tamper with their data and bring it into compliance.
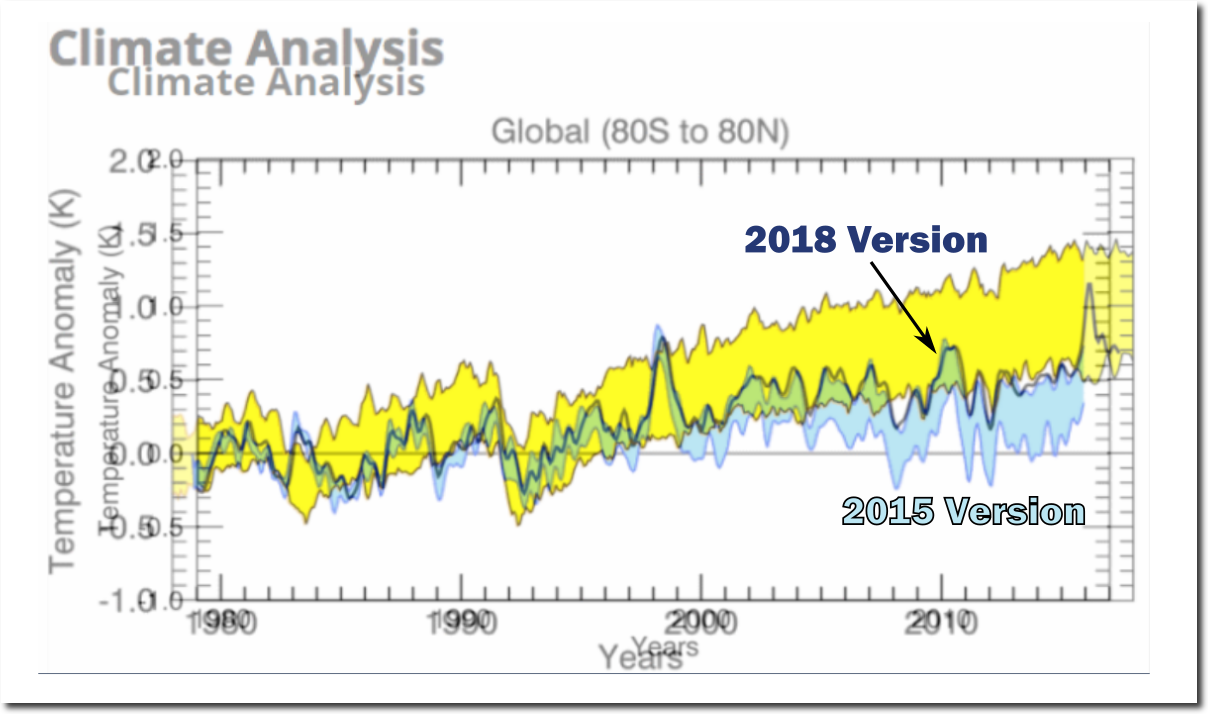
Climate Mafia At Work | The Deplorable Climate Science Blog
The good news is that the climate mafia is completely predictable.
“I expect there will soon be a revised TLT product from RSS which shows enhanced warming, too.
Here’s what I’m predicting:
1) neither John Christy nor I will be asked to review the paper
2) it will quickly sail through peer review (our UAH V6 paper is still not in print nearly 1 year after submission)
3) it will have many authors, including climate model people and the usual model pundits (e.g. Santer), which will supposedly lend legitimacy to the new data adjustments.
Let’s see how many of my 3 predictions come true.
-Roy”
Roy Spencer’s Prediction | The Deplorable Climate Science Blog
As I predicted more than three years ago.
Posted in Uncategorized
Leave a comment
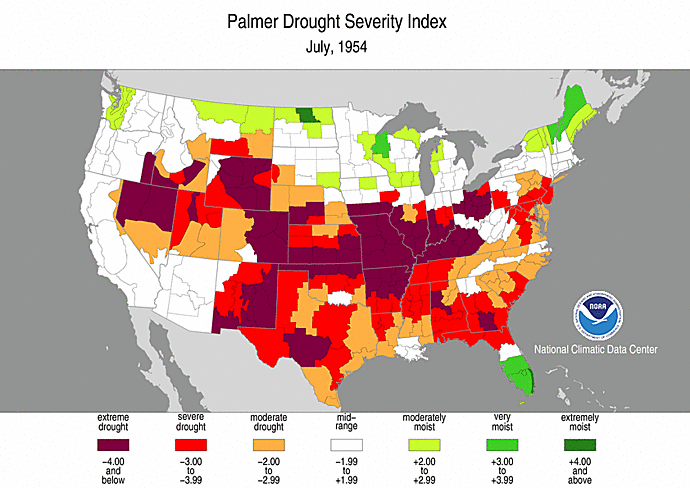
July 11, 1954 – Hottest Day On Record In Colorado
On July 11, 1954, Sedgwick, Colorado reached 114 degrees, the hottest temperature ever recorded in Colorado.
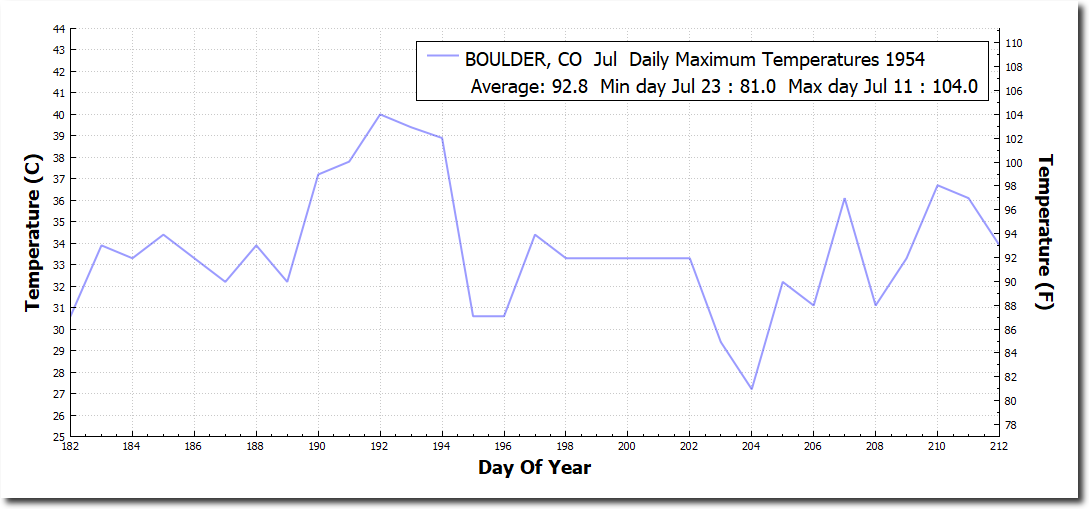
Boulder was 104 degrees, during a string of four consecutive days over 100 degrees. It was the hottest temperature ever recorded in Boulder, and the only time Boulder had four days in a row over 100 degrees.
Nebraska was 116 degrees, Kansas was 115, Oklahoma 112, and Missouri 110 degrees.
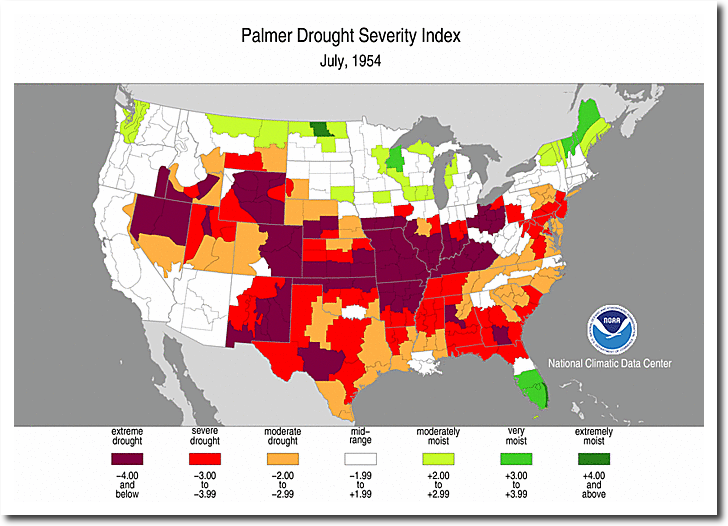
Most of the US was in severe or extreme drought.
Later that summer New England was hit by two major hurricanes, which were the last major hurricanes to hit New England. Followed by hurricane Hazel which was the deadliest hurricane to ever hit Canada. Hazel created a storm surge on Lake Ontario which killed more than 100 people in Toronto.
Something changed after 1954, and the likelihood of hot weather plummeted in the US. A couple of hot summers occurred in 1980 and 1988, but for the most part US summers have been much cooler since 1954.
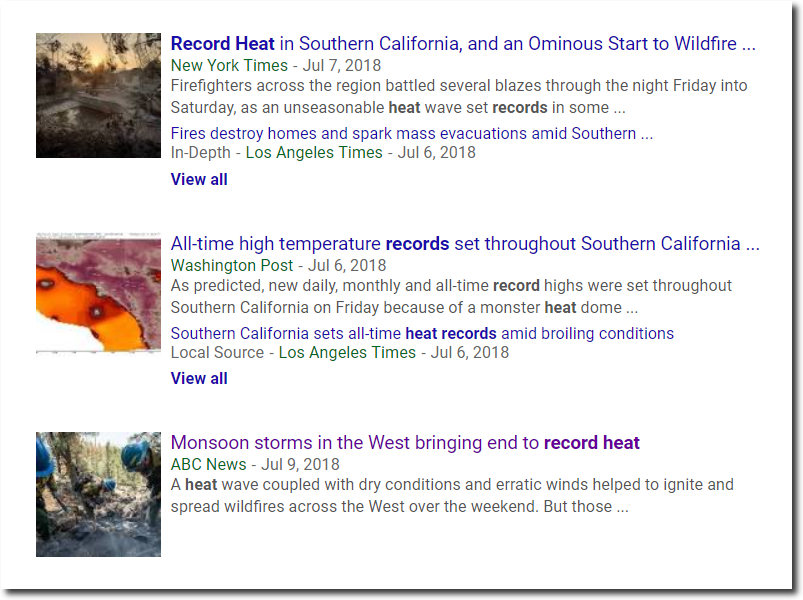
Meanwhile, the press continues to lie about the heat – like they do about everything else.
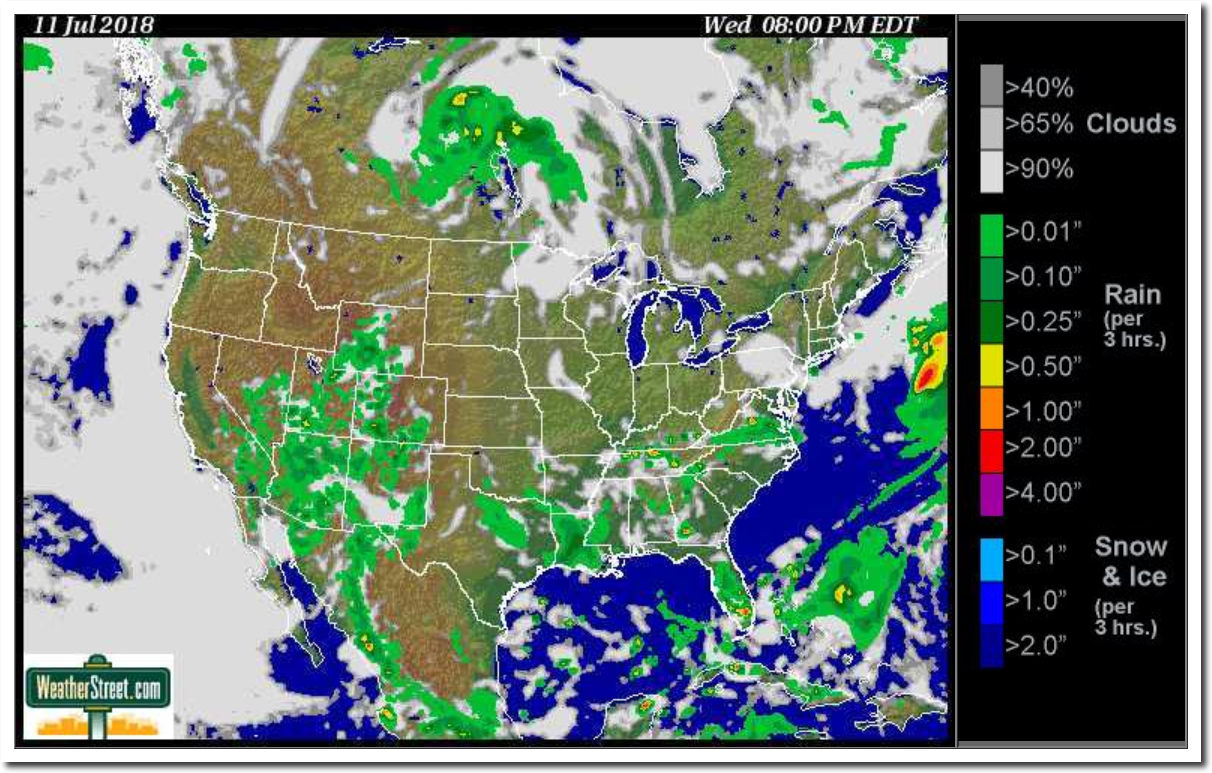
Huge amounts of moisture is streaming into the southwest, with lots of rain and temperatures forecast well below normal for the next couple of weeks.
Posted in Uncategorized
Leave a comment
July 1936 – Worst Heatwave In US History
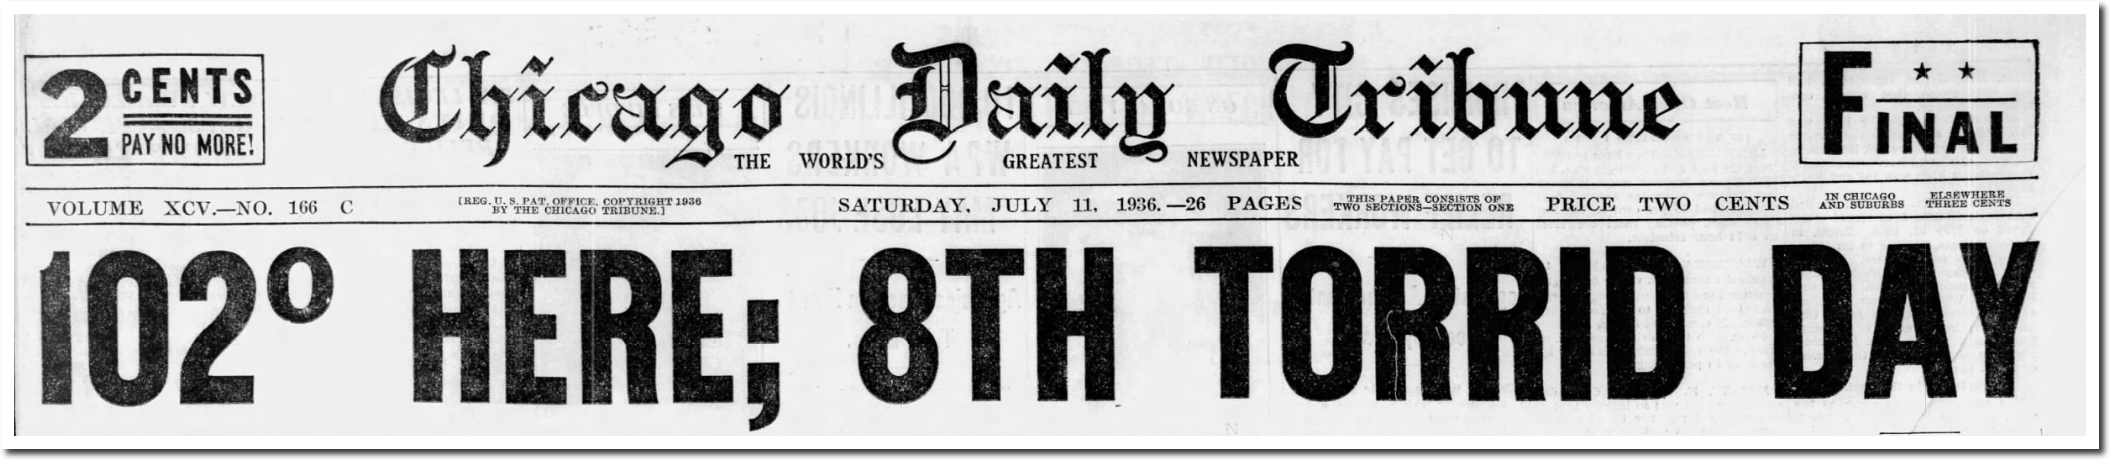
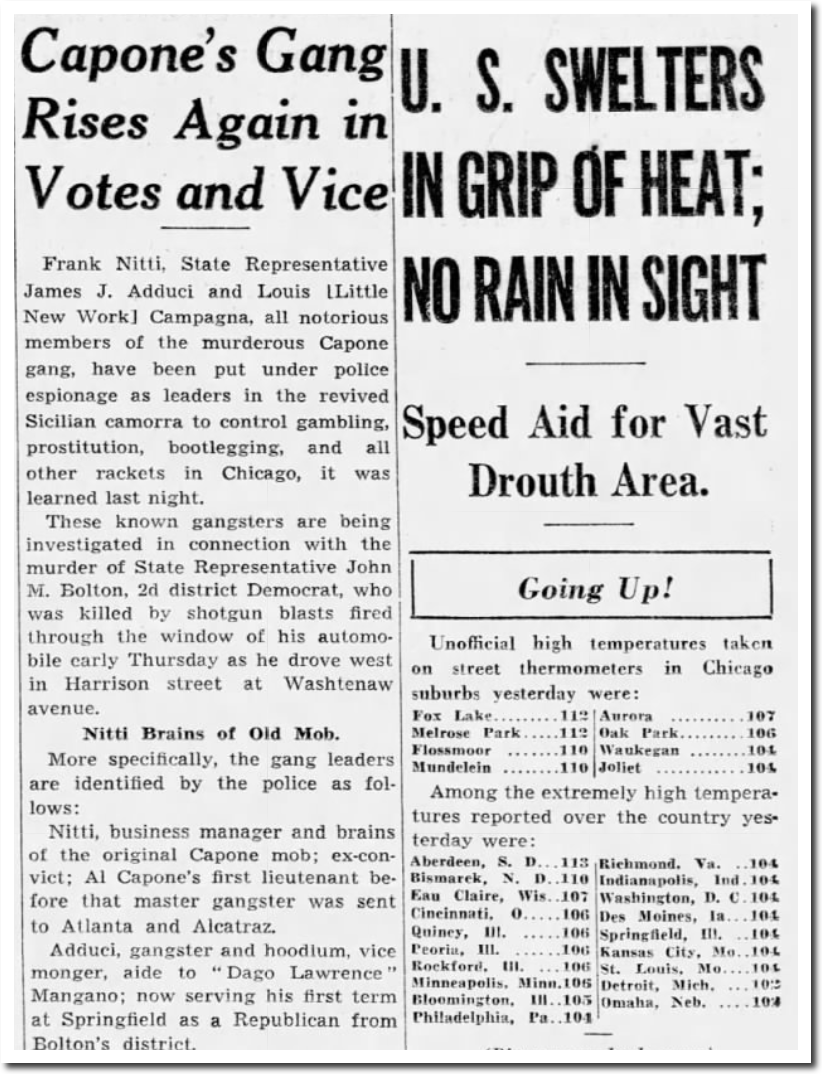
On this date in 1936, temperatures in the Chicago area reached 112 degrees.
11 Jul 1936, 1 – Chicago Tribune at Newspapers.com
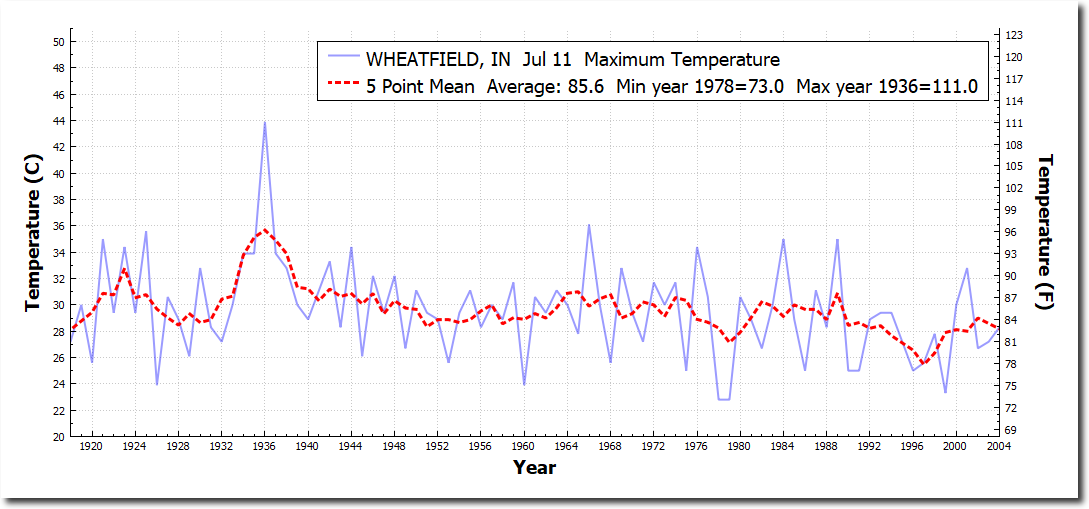
July 11 temperatures in Indiana have been steadily declining for a century, and are down about ten degrees from the 1930’s.
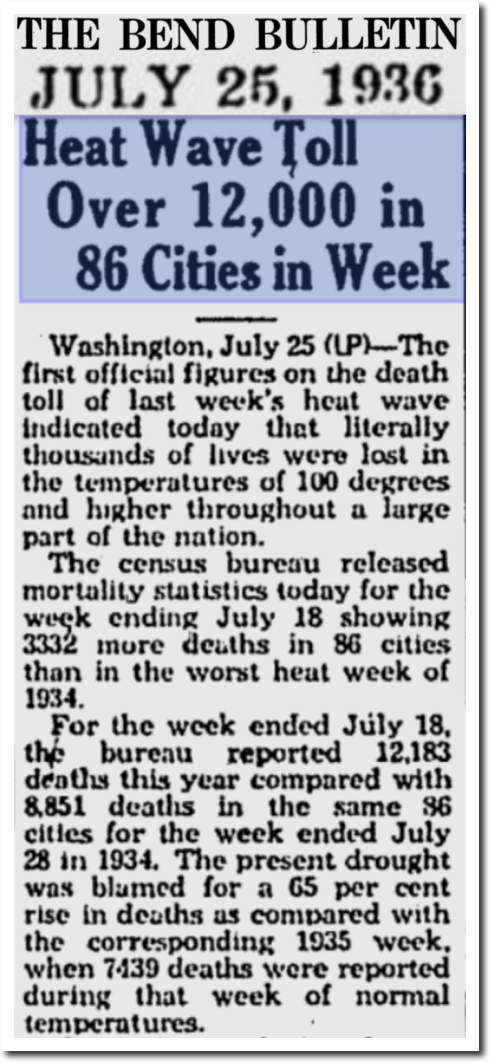
This was near the beginning of a heatwave which was just going to get worse over the next week.
Posted in Uncategorized
Leave a comment