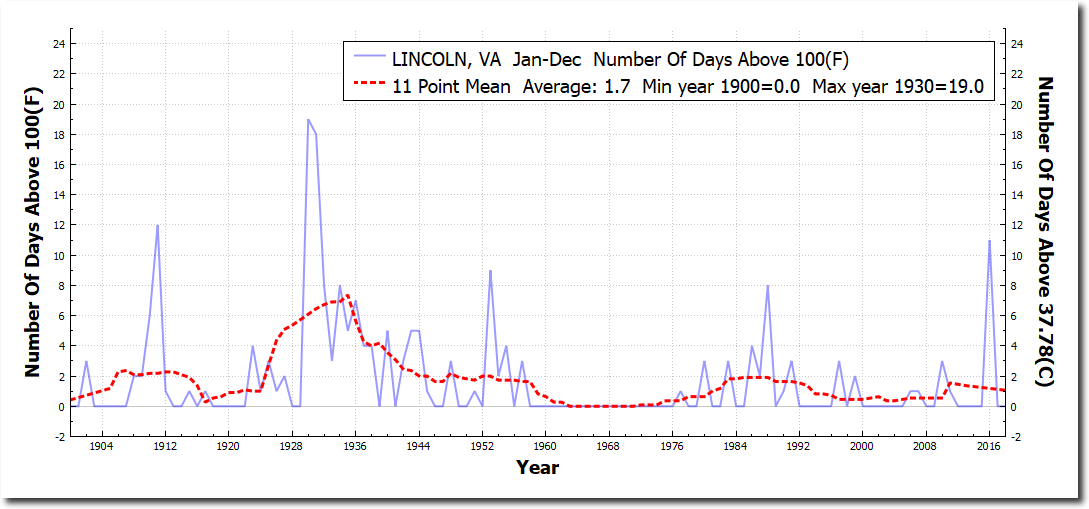
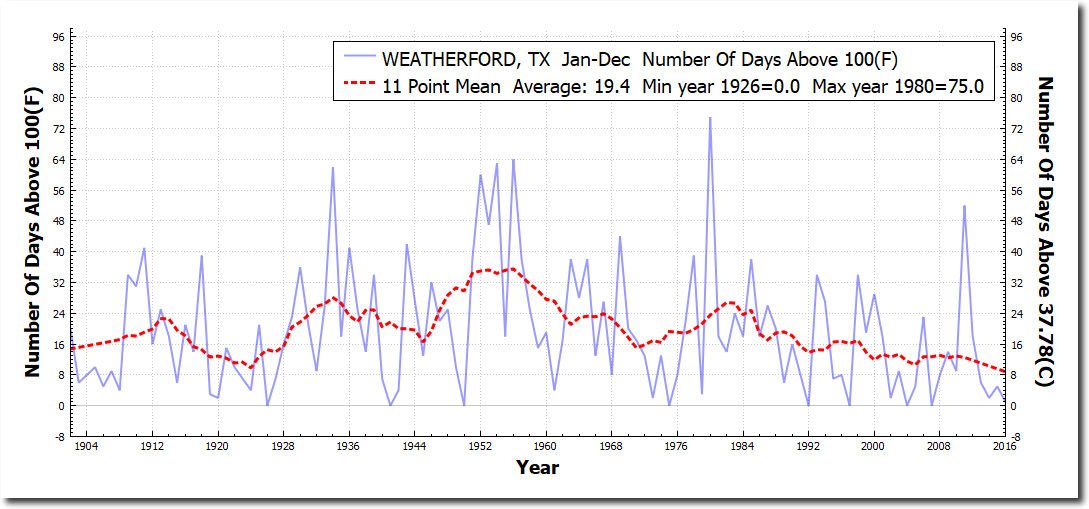
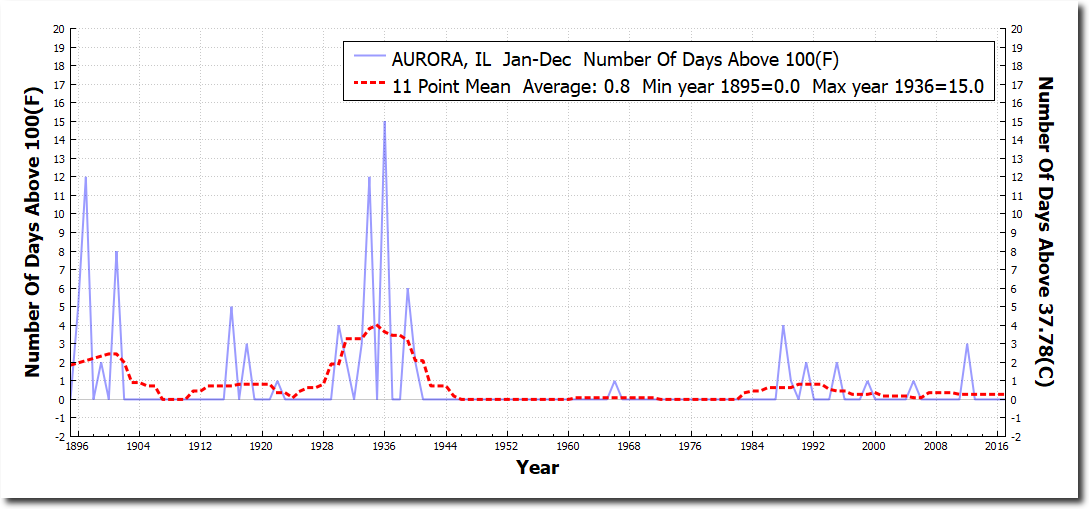
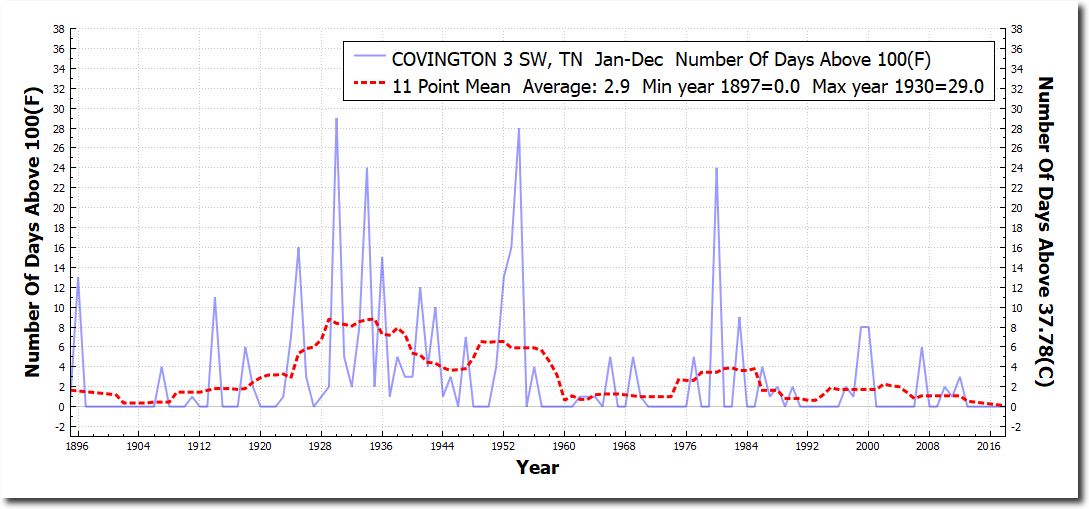
Global warming hysteria got its big start thirty years ago, when NASA’s James Hansen testified before Congress on a hot day in June. Government scientists predicted increasing drought in the corn belt, cotton growing in Siberia, oranges growing in British Columbia, and a huge increase in the number of 100 degree days in Washington, Dallas, Memphis and Chicago.
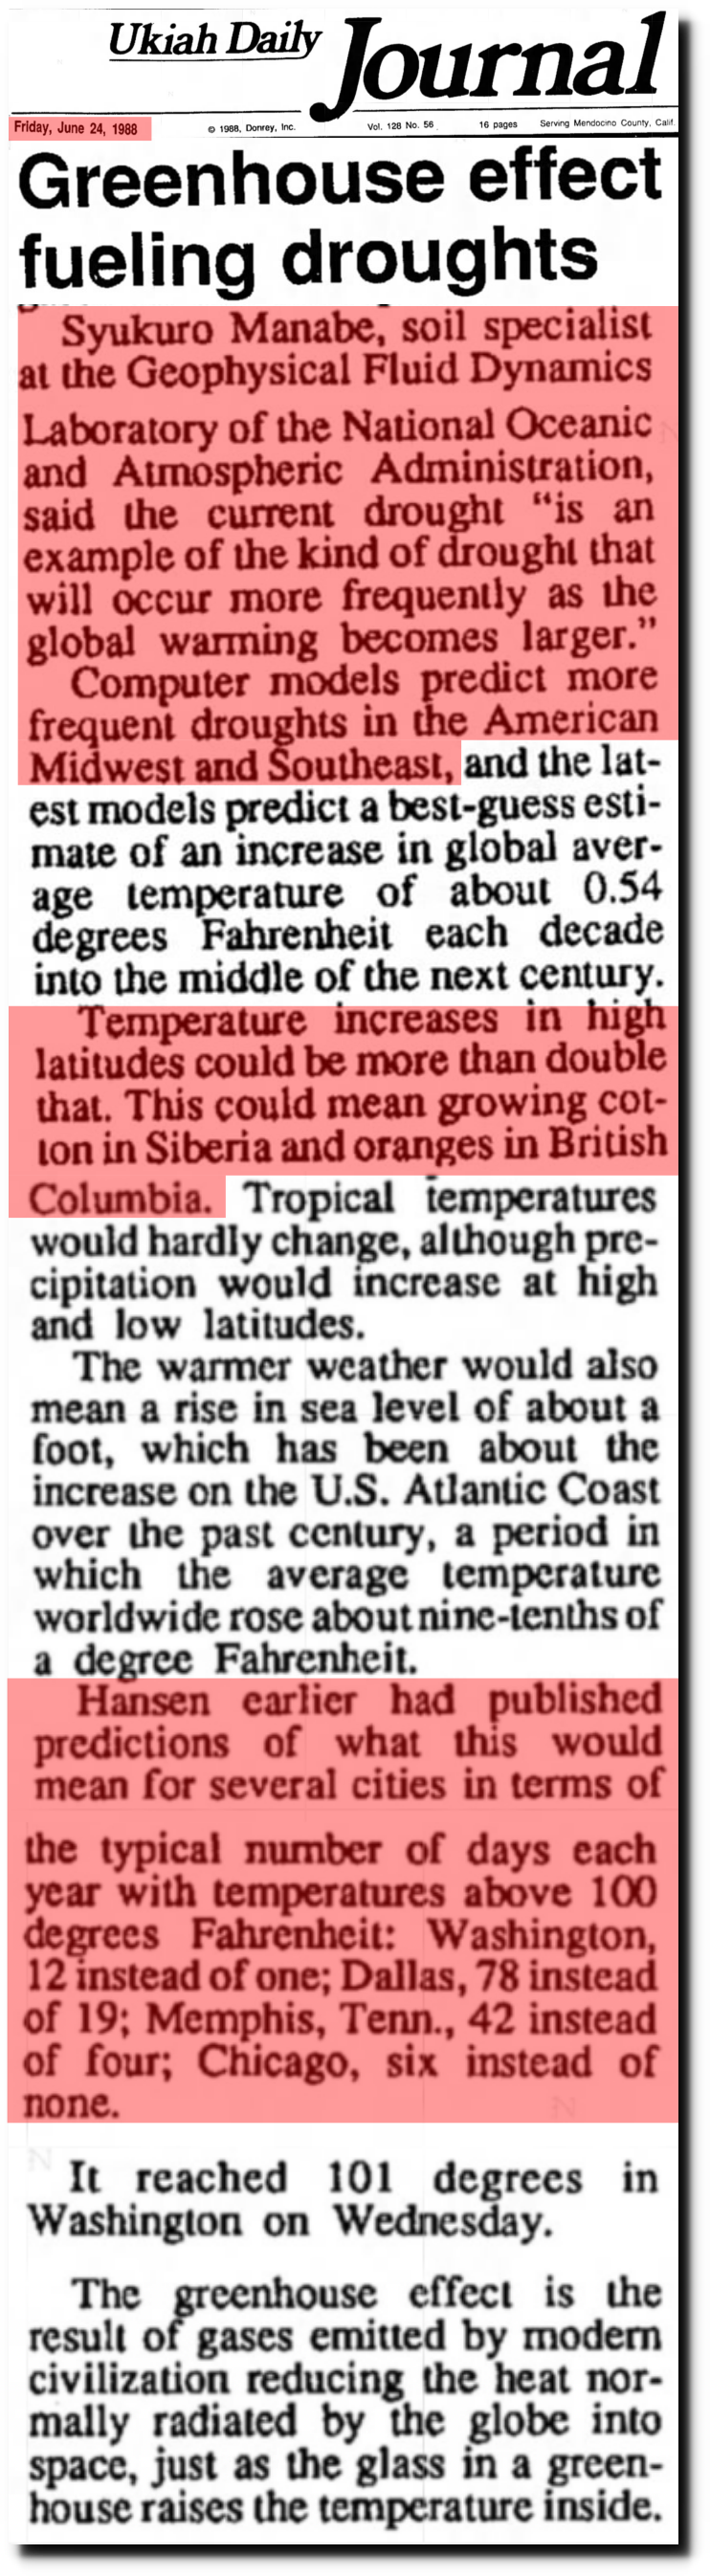
24 Jun 1988, Page 1 – Ukiah Daily Journal at Newspapers.com
Let’s look how those experts did. Droughts in the corn belt have become much less common over the past century, and 1988 was the last drought they experienced.
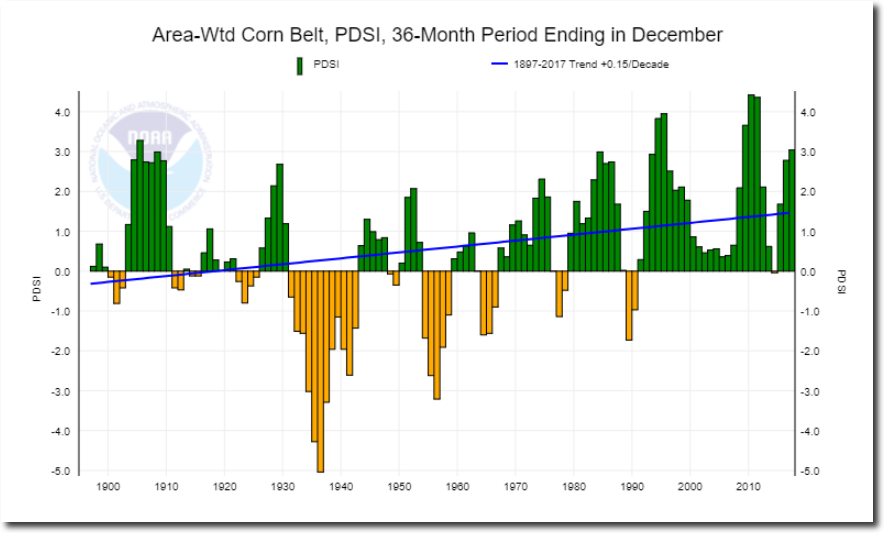
Climate at a Glance | National Centers for Environmental Information (NCEI)
The graphs below are from the closest USHCN stations to DC, Dallas, Memphis and Chicago. All show a sharp decline in the number of 100 degree days.
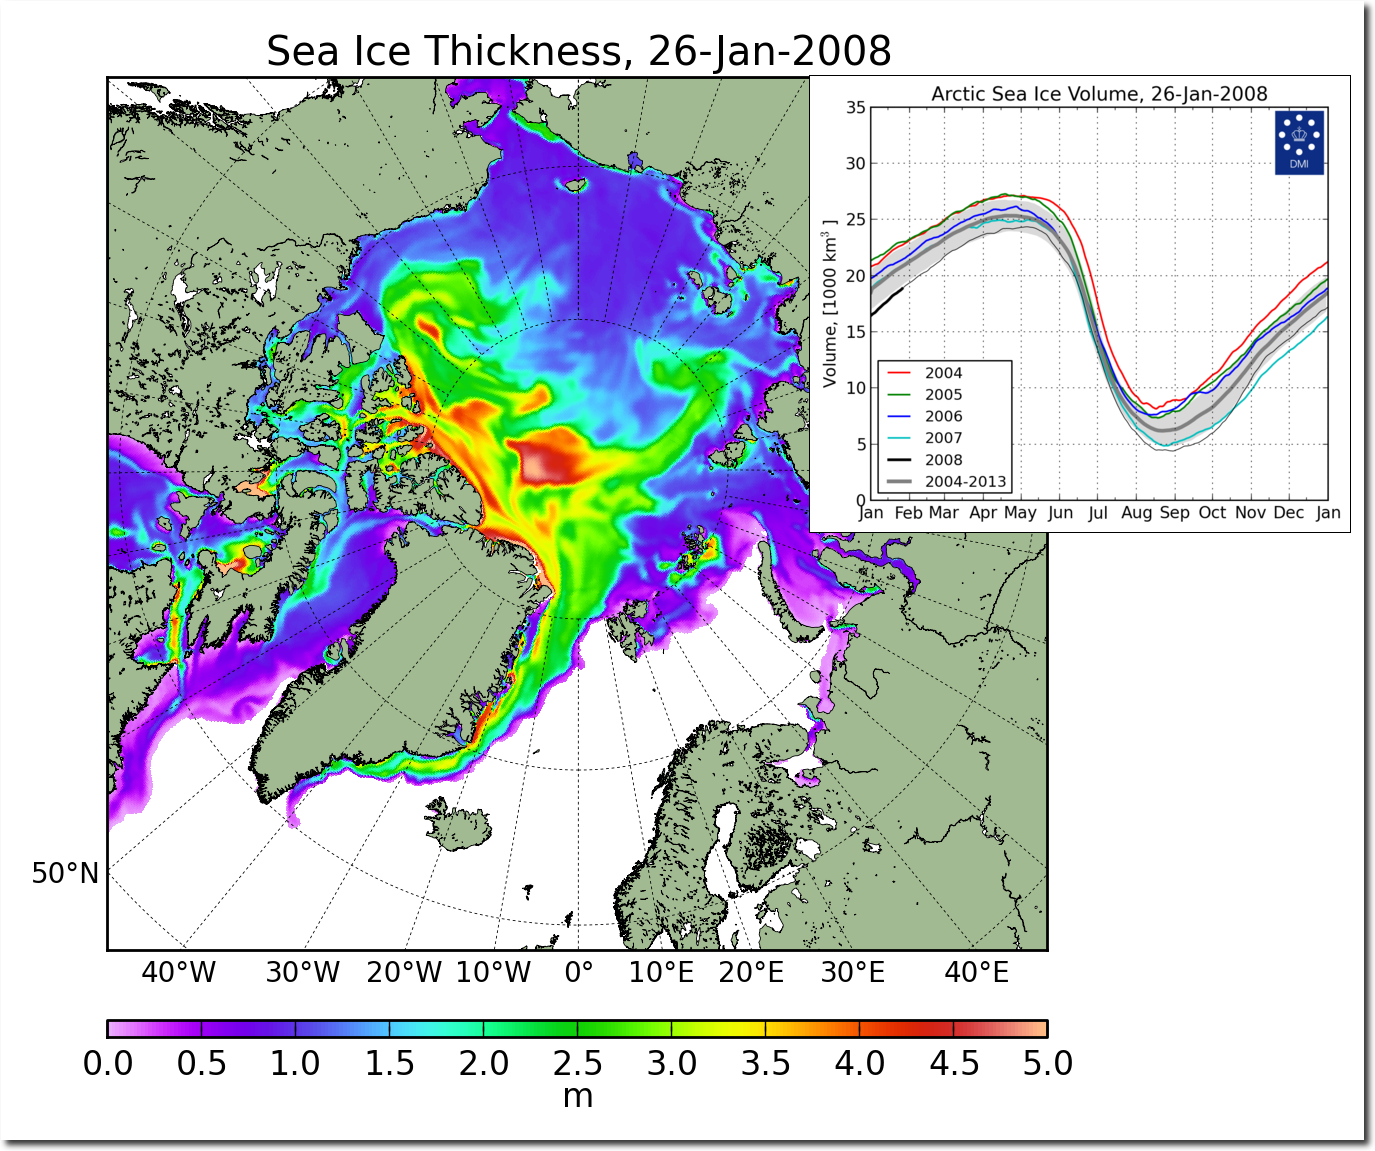
And Siberia is experiencing record cold, not growing cotton.
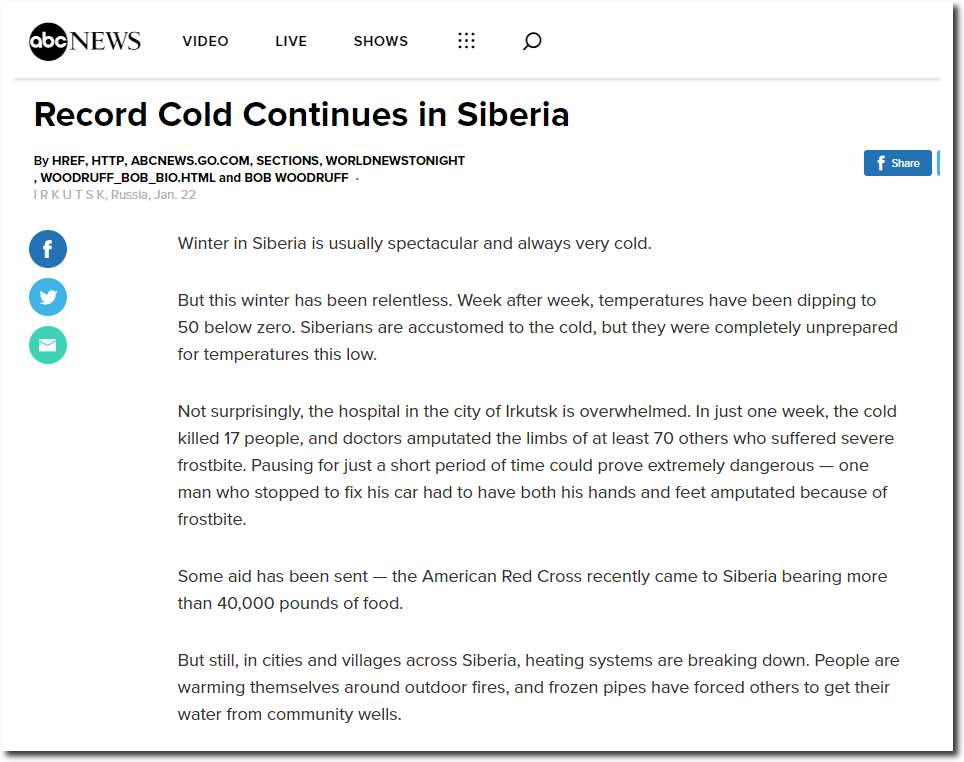
Record Cold Continues in Siberia – ABC News
Last year British Columbia was having near record cold.
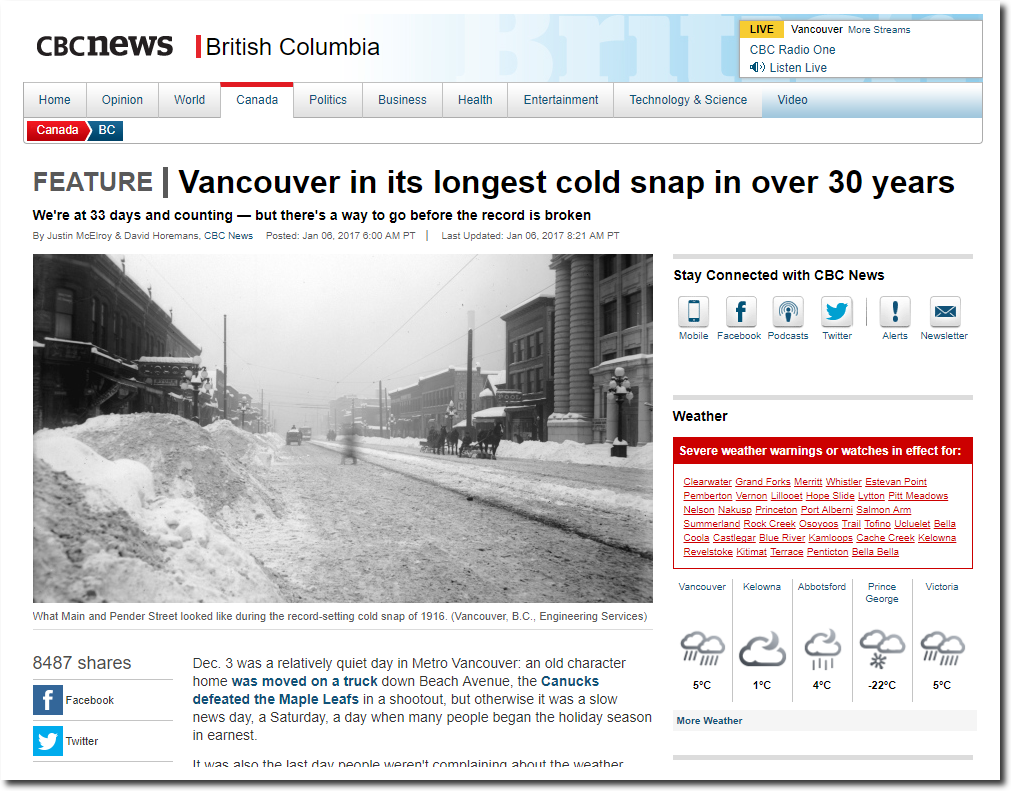
Vancouver in its longest cold snap in over 30 years – British Columbia – CBC News
The scientists were 100% backwards with all of their 1988 predictions. And Hansen sabotaged the air conditioner at the Congressional hearing to scare politicians into going along with his scam.
we called the Weather Bureau and found out what historically was the hottest day of the summer. Well, it was June 6 or June 9 or whatever it was, so we scheduled the hearing that day, and bingo: It was the hottest day on record in Washington, or close to it. It was stiflingly hot that summer. [At] the same time you had this drought all across the country, so the linkage between the Hansen hearing and the drought became very intense.
… What we did it was went in the night before and opened all the windows, I will admit, right? So that the air conditioning wasn’t working inside the room and so when the, when the hearing occurred there was not only bliss, which is television cameras in double figures, but it was really hot. … So Hansen’s giving this testimony, you’ve got these television cameras back there heating up the room, and the air conditioning in the room didn’t appear to work. So it was sort of a perfect collection of events that happened that day, with the wonderful Jim Hansen, who was wiping his brow at the witness table and giving this remarkable testimony.
Interviews – Timothy Wirth | Hot Politics | FRONTLINE | PBS
Global warming is the biggest scam in history, and the people behind it are crooks, not scientists.