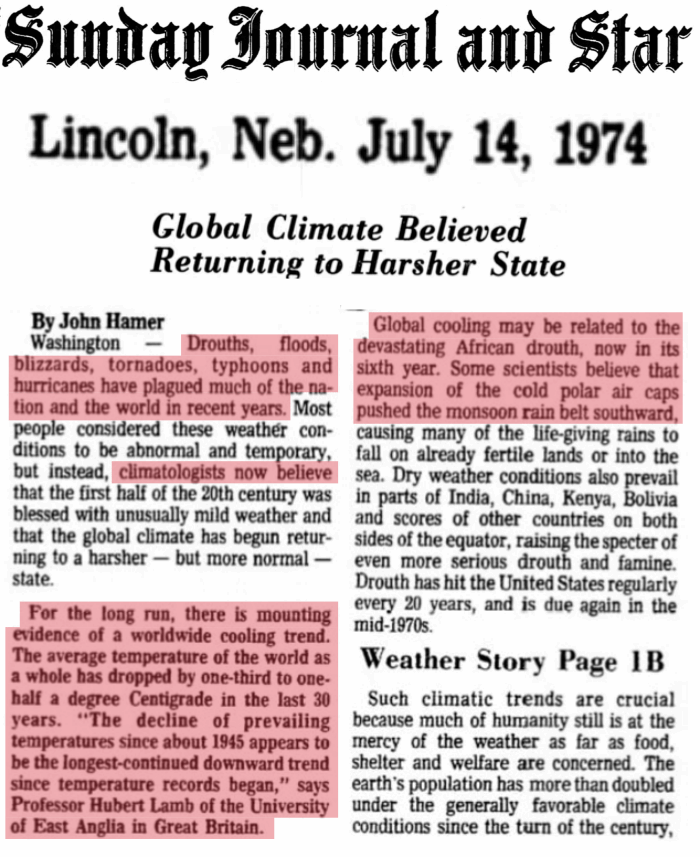
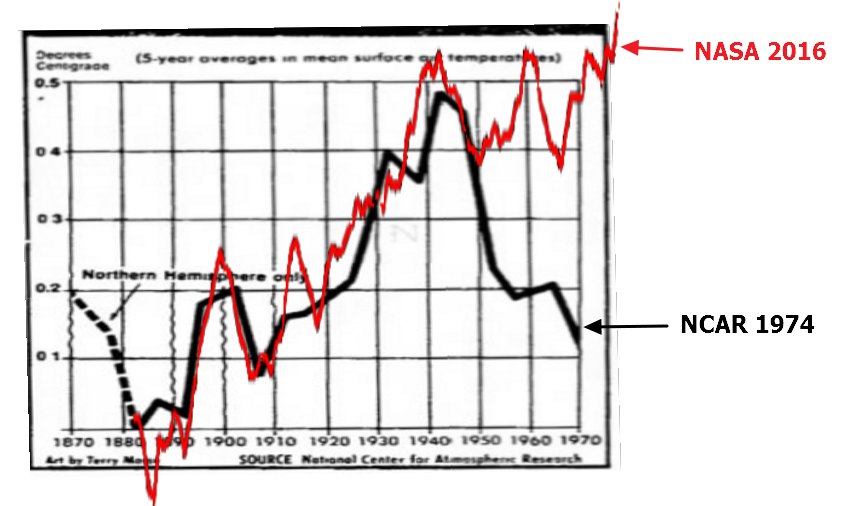
In 1974, NCAR and CRU reported half a degree global cooling since the early 1940’s, and blamed drought and famine on it.
14 Jul 1974, Page 1 – at Newspapers.com
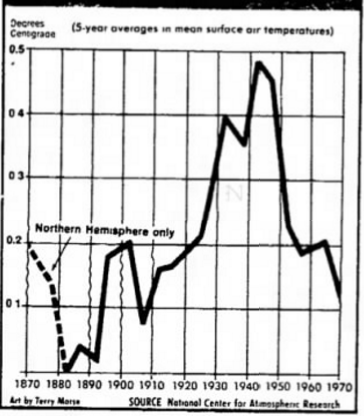
NCAR data showed Northern Hemisphere cooling from 1870 to 1880, followed by 0.7C global warming from 1880 to 1940, and global cooling of 0.6C from 1940 to 1970. There was no net warming from 1870 to 1970, and possibly cooling during that period.
14 Jul 1974, Page 1 – at Newspapers.com
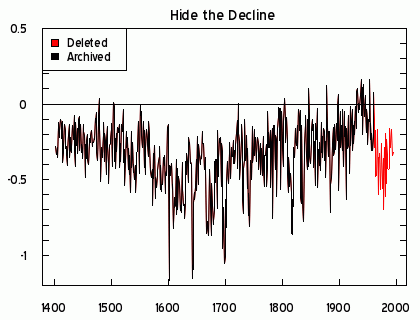
Briffa’s trees showed the same 1940’s to 1970’s cooling, which Michael Mann hid.
Reality didn’t fit the global warming narrative, and in order to facilitate Michael Mann’s farcical hockey stick – NASA did their own nature trick and erased the post-1940 cooling from the surface temperature record.
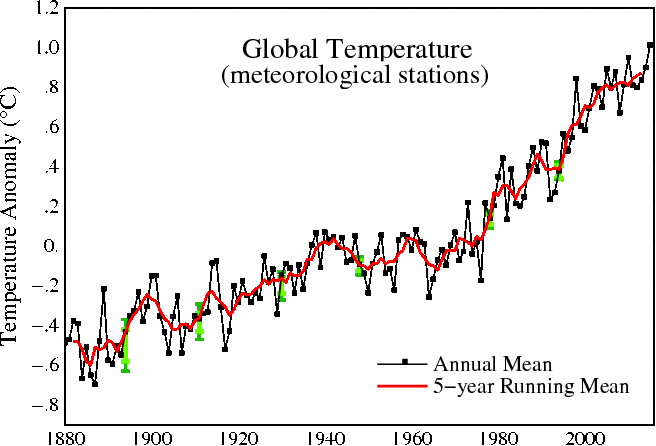
The next graph overlays the current NASA graph on the 1974 NCAR graph at the same scale. It shows how NASA has hidden the post-1940 decline, just as Michael Mann did with the tree ring data. NASA’s nature trick.
He who controls the past controls the future. He who controls the present controls the past
- George Orwell 1984
Make no mistake about it, global warming is the biggest scientific fraud in history.


I am reminded of the Norman Rockwell painting showing a butcher with his thumb pushing down on the scale that is holding some meat to be weighed, But in that case, the woman shopper, was also pushing up from below. In any case, those running GISS have their thumbs and hands and legs and whole bodies on the scales in various ways at various times. It is easy to get just the results you want when you control all the ‘adjustments’ to the data.
Good post, with the Lamb quote quite convincing.
May the Geo-ethics Conference in London on 8-9 Sept 2016 be a victory celebration!
Reblogged this on WeatherAction News.
“Make no mistake about it, global warming is the biggest scientific fraud in history” ?
Biggest fraud ever, of any kind !
Check this out ?
April 15, 2016
News Alert, Read the following just posted on the NSIDC Website !
[Sensor on F-17 experiencing difficulties, sea ice time series temporarily suspended
April 12, 2016
NSIDC has suspended daily sea ice extent updates until further notice, due to issues with the satellite data used to produce these images. The vertically polarized 37 GHz channel (37V) of the Special Sensor Microwave Imager and Sounder (SSMIS) on the Defense Meteorological Satellite Program (DMSP) F-17 satellite that provides passive microwave brightness temperatures is providing spurious data. The 37V channel is one of the inputs to the sea ice retrieval algorithms, so this is resulting in erroneous estimates of sea ice concentration and extent. The problem was initially seen in data for April 5 and all data since then are unreliable, so we have chosen to remove all of April from NSIDC’s archive] End !
I recently checked and downloaded the daily Arctic Satellite photo of the “Current State of the Arctic Ice/Sea Ice” which I do all the time.
That Photo, for the 1st since I’ve been observing it (Since roughly 2010), IS NOW GONE, with an “explanation” that it might not be up “again” !
Note that the most recent photo downloaded, April 12, 2016, showed that the Current Arctic Ice/Sea Ice has returned to virtually 100% !!
And within “2” days (I didn’t check on April 14) of viewing that Satellite Photo, the Photo is GONE !!!
The Satellite Photo is Gone !
And with “no” indication that it will be put back up !
With current technology, it “cannot” be put back up ?????
Here is the website link/url
https://nsidc.org/arcticseaicenews/
(Notice the darkened photo at the middle/top of the page where the Satellite Photo has/had been, “NO DATA”)
Now is when this will begin to escalate, with the United States Government closing down the access of Satellite Information to the general public !
It’s called “Cover Up” !
Nuts
Unfortunately, Big Brother does not seem to grasp the importance of a graceful exit from tyrannical control of society after seventy year <1946-2016).
I cannot persuade Him a graceful exit would be in the best interest of everyone.
What does Denmark have.
http://weather.gc.ca/city/pages/nu-15_metric_e.html -29c Cambridge Bay Nunavut where the millionaire eco activist go yachting and get stuck in the ice
Sunshine hours
https://sunshinehours.net/
While the NSIDC data from the DMSP F17 is down they are using JAXA (Japanese) data and MASIE data to continue their daily monitoring of sea ice. They offer a link to the difference in methodologies to provide context.
They also have a good detailed explanation of the problems:
https://sunshinehours.net/2016/04/15/satellites-dmsp-block-5d/
OLS trends in temperature can be spurious. There is evidence of dependence in the temperature data
http://papers.ssrn.com/sol3/papers.cfm?abstract_id=2763358
Reblogged this on Climate Collections.