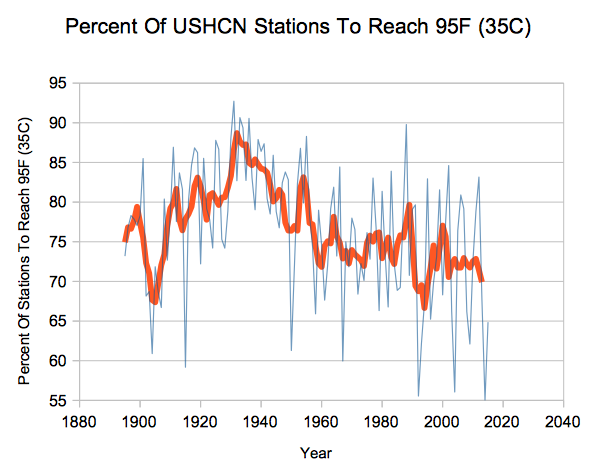
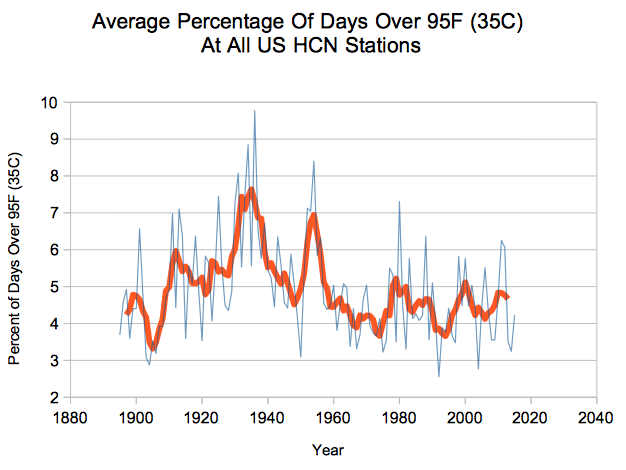
NOAA claims that 2015 was the second hottest year on record in the US.

NOAA: U.S. posts second-hottest year on record – POLITICO
In fact, it was one of the least hot years on record in the US, ranking in the bottom ten of areal coverage of hot weather. During the 1930’s ninety percent of the US reached 95 degrees. Last year only 65% of the US made it to 95 degrees.

Last year also ranked near the bottom for frequency of hot days, which have also plummeted since the 1930’s.

This data is not in dispute and is not subject to any NOAA adjustments. Claims that 2015 was a hot year in the US are simply fraudulent.


True Tony ; Even beyond these Graphs, the Great Lakes still had Ice into mid year!!! A Winter with such record volumes of Snow, could not possibly be the same Year, as one of the hottest.!
Has the frequency of lows changed in a similar fashion?
The frequency of cold nights has also declined, though was very high in 2015.
The general winter trend in UAH USA48 is cooling.
http://s19.postimg.org/bslzrbz1v/UAHUSA48_DJF.jpg
February 2015…one of the coldest on record
http://www.weather.com/news/news/top-five-coldest-february-midwest-northeast
USCRN has February in 8th place since 2005
There you go, an unusual cold February in the midwest disproves global average temperature changes on a year to year basis. Good logic.
Moron alert
Elliott… logic is not one of your virtues; Cooling trends work against Warming claims!
This highlights the problem with using yearly averages.
It should be pointed out that even UAH and RSS have 2015 in 1st or 2nd place over the US, as does USCRN.
Thing is… nearly all that “anomaly” comes from the last 4 month of 2015, ie during your AUTUMN and WINTER,
That means that none of it will show up in the metric SG is using.
Now, is anyone complaining about a slightly warmer winter ??
January-March 2015 was the coldest on record in the Northeast US.
That wonky jet stream has been playing switcheroo warm/cool, east/west throughout the year.
Makes it very hard to make any real sense of the country as a whole.
Yearly averages become meaningless as anything except as a very rough indicator.
Even monthly averages are all over the place on an order basis.
eg , in USCRN (10 years) May is in 8th place, June in 1st, July in 8th.
Andy, you’re from Australia, right?
Is there a Southern Hemispheric version of the jet stream? If so, does it affect weather in Australia?
Just curious. Being a NH-centric person I’d never considered a SH version of the jet stream.
Dave, yes there is, and yes it can wobble around a bit
The main difference is the major southern jet stream generally stays south of Tasmania, and even when it wobbles its still over the only the ocean.
It does give us some of our weather patterns but nowhere near as influential as the NH one.
Is northism evil?
https://en.wikipedia.org/wiki/South-up_map_orientation
Thanks Andy.
I assumed there must be a corresponding SH version. I’d never even considered the possibility.
Only the seeming incongruity of an Aussie posting about the NH jet stream brought the idea to mind.
Certainly not, now that the Northern Hemisphere is heading into serious Snow Storms. Warming, will be wished for and only found indoors..!
Reblogged this on Climatism.
Their real problem is that “hottest” means it was hot. This is obviously not true.
Now if they had said that 2015 had one of the highest average anomalies, that would probably have been true.
But they always go for the “highlight” warmista headline, and that approach is totally UN-SCIENTIFIC and obviously aimed purely at PROPAGANDA MISDIRECTION.
I’m waiting for Obama’s big announcement. Last year “the hottest EVAH!” Was announced a week before the State of the Union address timed nicely for the POTUS to drop it into his speech. What’s on the block this year?
Areal, a real ? it is not in the spelling it is a multi level brain hoist.
New Zealand’s only spot on there slice of Paradise where 11 asphalt paved roads converge….site of their gauge.for 100 mile radii.
Area Planning on a number of levels is not being.
PE brains & box checkers (who see who donated as first box to check) called “planners” need help.
My profession Landscape Architecture needs to make a comeback.
Lol. Is this seriously your criteria for hottest year ever? Number of days over 95F in the US?? I’d say this is the worst science I’ve ever seen, but this is certainly not scientific.
Moron alert
#1. Temperatue is the incorrect measurement because it is an Intrinsic properties are dependent on moisture content of the air, cloud cover and a whole host of other confounding parameters.
#2. NOAA data is full of holes!
https://i1.wp.com/www.ncdc.noaa.gov/sotc/service/global/map-land-sfc-mntp/201512.gif
#3. Far north stations were intentionally dropped.
(black diamond is stations used.)
1975 far north ground stations with over 600 individual temperature series and more than 540 combined series with records of more than 20 years.
https://diggingintheclay.files.wordpress.com/2010/04/canadastations1975.png
Dropped to less than 30 locations reporting stations by 2009
https://diggingintheclay.files.wordpress.com/2010/04/canada-bypopulation.png
Getting rid of stations, especially rural northern stations allows wholesale data tempering.
https://diggingintheclay.files.wordpress.com/2010/04/canadadt.png
#4. In the USA, NOAA is now making up almost half the data.
https://i1.wp.com/realclimatescience.com/wp-content/uploads/2016/01/2016-01-08-07-32-57.png
#5. The unrustworthy surface station data has huge error.
https://i0.wp.com/www.surfacestations.org/Figure1_USHCN_Pie.jpg
Because the data is contaminated by local heat sources.
https://i1.wp.com/www.surfacestations.org/images/OrlandCA_USHCN_Site_small.jpg
https://i2.wp.com/www.surfacestations.org/images/MarysvilleCA_USHCN_Site_small.jpg
And that doesn’t even get into the bogus ‘adjustments’
Elliott Dumb thinks 68F or something is hot ! DOH !!!
You see, moron, that is what this is based on, a somewhat warmer start to winter in the eastern USA and maybe in Russia (who knows for sure)…. which got smeared over areas they had zero data for.. (as shown by Gail’s pic)
But it was NOT HOT !
Do..
You..
Under..
Stand ..
????