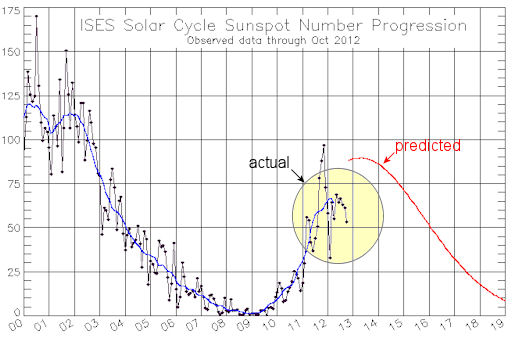
SO THIS IS SOLAR MAXIMUM?
Forecasters have long expected the Solar Max of 2013 to be the weakest of the Space Age. It might be even weaker than they thought. As shown in this 20-year plot of sunspot counts vs. time, the sun is underperforming:
Disrupting the Borg is expensive and time consuming!
Google Search
-
Recent Posts
- Gaslighting 1924
- “Why Do You Resist?”
- Climate Attribution Model
- Fact Checking NASA
- Fact Checking Grok
- Fact Checking The New York Times
- New Visitech Features
- Ice-Free Arctic By 2014
- Debt-Free US Treasury Forecast
- Analyzing Big City Crime (Part 2)
- Analyzing Big City Crime
- UK Migration Caused By Global Warming
- Climate Attribution In Greece
- “Brown: ’50 days to save world'”
- The Catastrophic Influence of Bovine Methane Emissions on Extraterrestrial Climate Patterns
- Posting On X
- Seventeen Years Of Fun
- The Importance Of Good Tools
- Temperature Shifts At Blue Hill, MA
- CO2²
- Time Of Observation Bias
- Climate Scamming For Profit
- Climate Scamming For Profit
- Back To The Future
- “records going back to 1961”
Recent Comments
- Bob G on Gaslighting 1924
- Bob G on Gaslighting 1924
- Bob G on Gaslighting 1924
- conrad ziefle on Gaslighting 1924
- Bob G on Gaslighting 1924
- Bob G on Gaslighting 1924
- arn on Gaslighting 1924
- conrad ziefle on Gaslighting 1924
- Gordon Vigurs on Gaslighting 1924
- conrad ziefle on Gaslighting 1924


Six years of WAGs, looks like Dec. of 2010 may have been best WAG.
http://i39.tinypic.com/34rufj9.jpg
Excellent graphic. It nicely shows the dead certainty of Hathaway’s 2006 prediction for SC24, which was an actual prediction made before SC24 began.
Can anyone say sunspot cycle 5 and the effect it had on this rock?
“Forecasters have long expected”??????? This was to be the “killer” cycle according to them. A high that would coincide with December 21st, 2012 and send flares to finish us off…
The projections fell awry of a sun that was doing its own thing. ie Not following the dictates of the scientific community. Our theories are only as good as the data that confirms them.
The low values seen are indicative of a quiescent period in solar activity. It may well decrease solar wind and thus affect GCR cloud formation resulting in more clouds and lower temperatures.
More speculation but a hypothesis that can be tested and will be demonstrated…IF we can get them to stop adjusting all of the temperature measurements upwards!
With Hansen’s 2,000 atom bombs exploding every day we’ll be warm.
According to Jan Alvestad:
http://www.solen.info/solar/
(bottom of page)
Solar max for cycle 24 may have been in February 2012 at SSN 66.9.