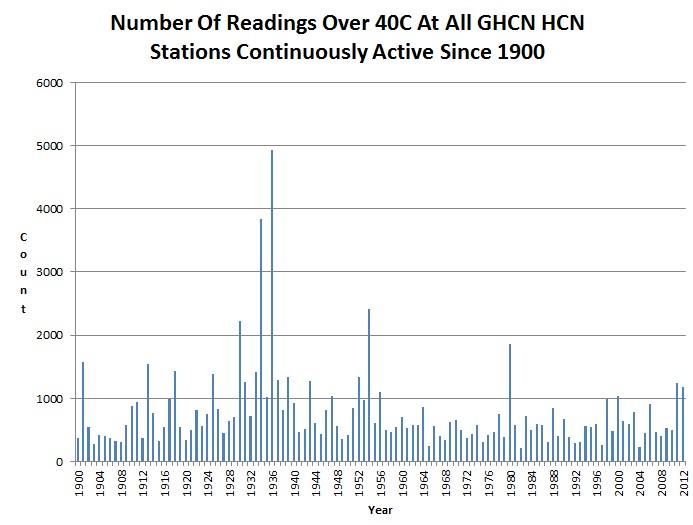
The graph below shows the number of daily US temperature readings over 40C, recorded at all 595 HCN stations continuously active since 1900.
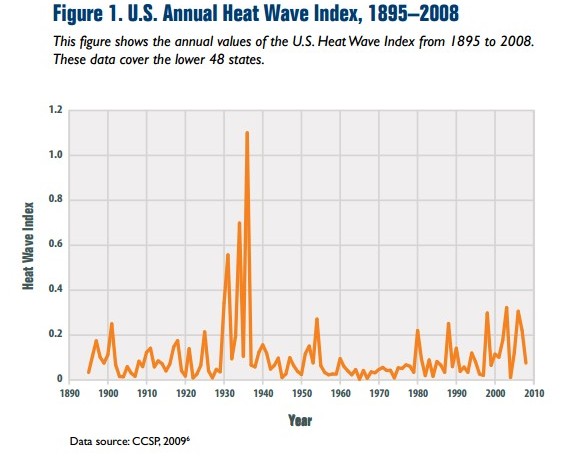
NOAA and GISS claim that the 2011/2012 heatwaves were unprecedented, when in fact they weren’t even in the top ten. In 1936, there were four times as many records of 40C+ as were measured in 2011 or 2012. The graph above updates the EPA graph below to 2012.
www.epa.gov/climate/climatechange/pdfs/print_heat-waves.pdf
The US was much hotter during the 1930s, and NOAA and GISS are determined to rewrite history.


The corruption is off the charts. NOAA should be abolished.
No sidestepping the count of temps over 40C. These people need to find honest jobs ( something that’s truly endangered with obama in office).
NOAA is arguably THE poster child for governmental agency burueaucratic corruption and yet our so called leaders do virtually nothing about it. The leaders responsible for this dysfunctional governmental system are useless worthless examples of what is wrong with government.