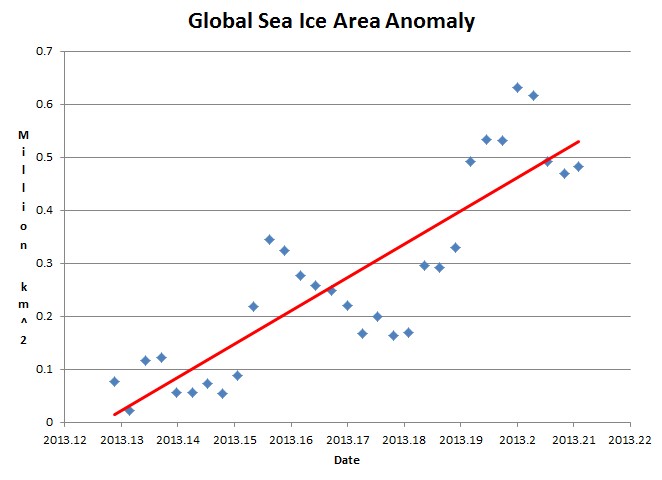
According to Masters, the odds of this happening are a billion to one (2^30)
 arctic.atmos.uiuc.edu/cryosphere/timeseries.global.anom.1979-2008
h/t to Dave G
According to Masters, the odds of this happening are a billion to one (2^30)
 arctic.atmos.uiuc.edu/cryosphere/timeseries.global.anom.1979-2008
h/t to Dave G
The Mayans are snickering…
Well, Tamino has jumped in before, and actually made a chart showing the difference in Arctic and Antarctic trends (and it’s the trend that’s always more important):
http://tamino.files.wordpress.com/2012/09/anom2.jpg?w=750&h=483
Here, he shows that while Arctic ice anomaly has dropped, the Antarctic ice anomaly has been ABOVE zero since about 1992 – about 20 years – over 240 months.
So while the “believers” use the “xxxth consecutive month with global temperatures warmer than the 20th century average” as a benchmark, why don’t they use the long-term Antarctic ice anomaly as a poster child of a warming world (the “xxxth consecutive month with Antarctic ice anomalies greater than the 20th century average”)?
Try figuring out the odds of THAT happening…
Quick, someone measure sea level. If global ice is above normal, sea level should be down.
Steve, I don’t like that trend very much, can you extrapolate it out to 2100 to see if it shows a new Ice Age.
You could then apply for some Non Big Oil cash to study it some more.
Actually both events (NH and SH ice extents) are probably 100% normal and have occurred probably thousands if not millions of times before sorry folks no AGW again! Unfortunately we only live to 100 years max so we don’t see…
Yeap, people leap to conclusions when they put a magnifying glass on a data set that tends to vary a lot from year to year anyway.