Steven … any idea why Cryosphere has that ice free area on the north of Svalbard but the Naval data has it ice covered? This discrepency has gone on for weeks now.
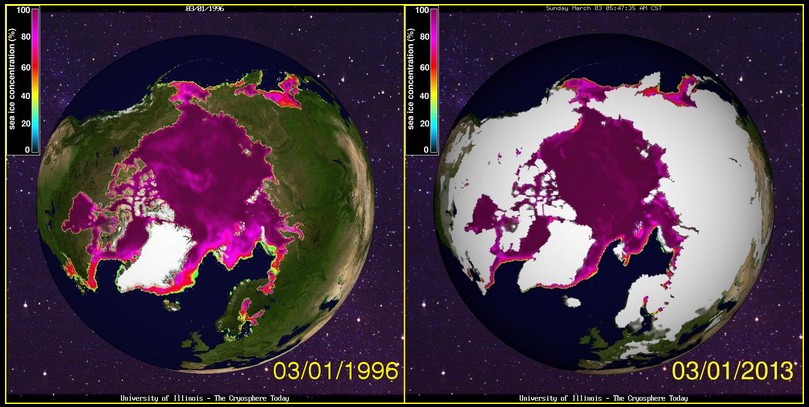
From eye-balling the images above, 1996 would appear to have the more ice. Has there been a change in the way they calculate the figure in the intervening period?
Of course… We all know the Arctic ice cap is only skin deep right… Maybe a few inches here or there. Oh wait, no. Actually its Metres and Metres of ice.
What is the ‘white’ area on these graphs supposed to represent? White is not shown on the scale. Disregard the white areas and we have much less ice in 2013.


Steven … any idea why Cryosphere has that ice free area on the north of Svalbard but the Naval data has it ice covered? This discrepency has gone on for weeks now.
Satellite vs surface observations.
I’m not as nice……..adjustments vs non-adjustments
From eye-balling the images above, 1996 would appear to have the more ice. Has there been a change in the way they calculate the figure in the intervening period?
They changed the eye elevation in 2008 in response to an observation I made.
One man can make a difference.
Of course… We all know the Arctic ice cap is only skin deep right… Maybe a few inches here or there. Oh wait, no. Actually its Metres and Metres of ice.
(Latest estimates to end January)
http://haveland.com/share/arctic-death-spiral-1979-201301.png
Jan 1996 volume: ~22,500 cubic kilometres
Jan 2013 volume: ~15,000 cubic kilometres
33% less
And fyi:
Sept 1996: ~14,000
Sept 2012: ~2,500
82% less.
Ice free September in 3, 2, 1…..
RE: Chris Alemany – “Ice free September in 3, 2, 1…..”
Ice volume is a model, not a measure… go argue with realclimate
http://www.realclimate.org/index.php/archives/2012/04/arctic-sea-ice-volume-piomas-prediction-and-the-perils-of-extrapolation/
“So using a model constrained by observations is quite possibly the best we can do to establish a long-term ice volume record.”
Why you are at it, for the sake of consistency, ask haveland.com to make a corresponding antarctic-life-spiral
Hi Chris,
Most of the reputable sources say Arctic Sea Ice extent now is either 14 or 15 Million Sq Km.
Ice thickness looks to me to average about 2 metres across the entire extent, but let’s give warmists the benefit of the doubt and say its 1.5 metres average.
http://www7320.nrlssc.navy.mil/hycomARC/navo/arcticictnnowcast.gif
Therefore, 14 x 1.5 = 21,000 Cubic Km of sea ice, so no significant change from 1996.
Taking the just slightly higher numbers, you get 15 x 2 = 30,000 Cubic Km of sea ice or the same as Feb 1979 at the start of the satellite era.
I forgot what your point was……………
What is the ‘white’ area on these graphs supposed to represent? White is not shown on the scale. Disregard the white areas and we have much less ice in 2013.
Huh? Look at the numbers I posted.