
Disrupting the Borg is expensive and time consuming!

Google Search
-
Recent Posts
- Cattle And The Climate
- One Atomic Bomb Per Hour
- New Video : Analyzing Oil And Gas
- Is Antarctica Melting?
- High Speed Analysis And Visualization
- El Nino To The Rescue?
- Fake News Update
- Growth Of Antarctic Sea Ice
- 65 Years Of Progress!
- El Nino To The Rescue?
- Worst March Drought On Record
- ChartGL Process Control Demo
- The Biggest Money Laundering Scam
- Drought In The Headwaters Of Lake Powell
- Unrealistic Expectations Of Water Availability
- Did Bill Gates Do This?
- Worst March Drought On Record In The US
- The Real Hockey Stick Graph
- Analyzing The Western Water Crisis
- Gaslighting 1924
- “Why Do You Resist?”
- Climate Attribution Model
- Fact Checking NASA
- Fact Checking Grok
- Fact Checking The New York Times
Recent Comments
- arn on Cattle And The Climate
- Bob G on Cattle And The Climate
- Robertvd on Cattle And The Climate
- Bob G on Cattle And The Climate
- Robertvd on Cattle And The Climate
- Billyjack on Cattle And The Climate
- Bob G on Cattle And The Climate
- Robertvd on Cattle And The Climate
- Robertvd on Cattle And The Climate
- Robertvd on Cattle And The Climate
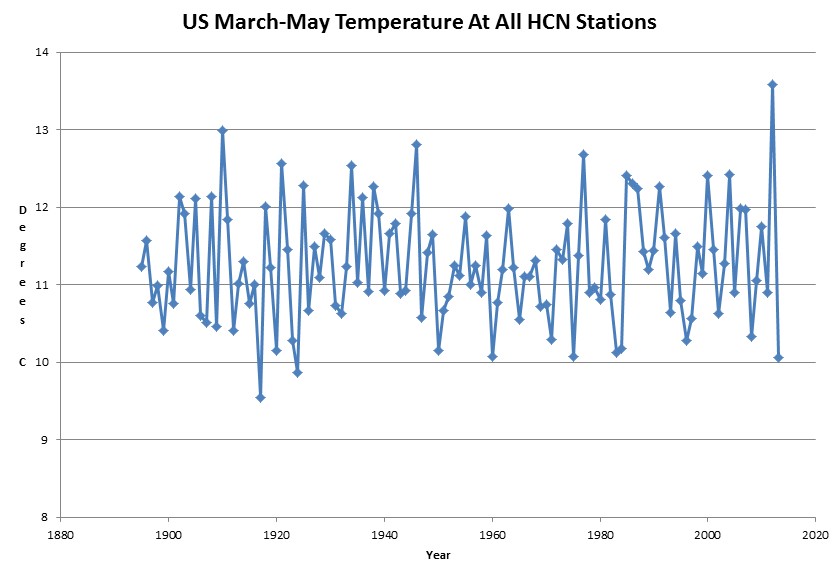
The hockey stick just took a nosedive. Not even a death spiral. Why would anyone be concerned about catastrophic warming looking at that chart?
Andy…..
http://www.foresight.org/nanodot/wp-content/uploads/2009/12/vostok.png
McKibben wins $100,000 prize.
“Divestment” is an old strategy. Anyone remember apartheid & South Africa?
And also on 30 May 1917 a tornado causing F4 damage killed 10 people and injured 100 in Crawford, Washington, St. Francois, and Jefferson counties in Missouri. This tornado was part of an outbreak that produced 7 separate tornadoes and was responsible for 21 deaths and 140 injuries.
Weather was so much better with CO2 below 350ppm.