
Twitter / ForecastFacts: Over 500 dead as killer heat …
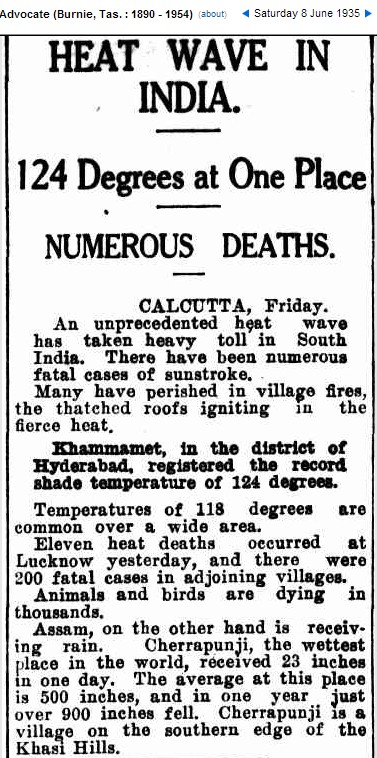
08 Jun 1935 – HEAT WAVE IN INDIA. 124 Degrees at One Place NUM…

Disrupting the Borg is expensive and time consuming!

Google Search
-
Recent Posts
- Cattle And The Climate
- One Atomic Bomb Per Hour
- New Video : Analyzing Oil And Gas
- Is Antarctica Melting?
- High Speed Analysis And Visualization
- El Nino To The Rescue?
- Fake News Update
- Growth Of Antarctic Sea Ice
- 65 Years Of Progress!
- El Nino To The Rescue?
- Worst March Drought On Record
- ChartGL Process Control Demo
- The Biggest Money Laundering Scam
- Drought In The Headwaters Of Lake Powell
- Unrealistic Expectations Of Water Availability
- Did Bill Gates Do This?
- Worst March Drought On Record In The US
- The Real Hockey Stick Graph
- Analyzing The Western Water Crisis
- Gaslighting 1924
- “Why Do You Resist?”
- Climate Attribution Model
- Fact Checking NASA
- Fact Checking Grok
- Fact Checking The New York Times
Recent Comments
- arn on Cattle And The Climate
- Bob G on Cattle And The Climate
- Robertvd on Cattle And The Climate
- Bob G on Cattle And The Climate
- Robertvd on Cattle And The Climate
- Billyjack on Cattle And The Climate
- Bob G on Cattle And The Climate
- Robertvd on Cattle And The Climate
- Robertvd on Cattle And The Climate
- Robertvd on Cattle And The Climate
Be careful there Steven, you may be accused as being a co-conspirator in unearthing historical events that distract from the administration & fellow followers goals:)
You’re always ahead of them Steve, great catch!
Meanwhile, the NORSEX ice area is at the 1979-2006 average again (as it happened in April last year), but now the rate of decrease is slower than in all recent years (since 2007)
http://arctic-roos.org/observations/satellite-data/sea-ice/observation_images/ssmi1_ice_area.png
It’s a good sign for the coming summer.
Remember the warmist phrase ” the US only makes up about 2% of the world’s surface”?
It was the battle cry of the Hansenites back when 1934 was still the hottest year on Earth.
Just before Hansen finger fudged 1998 into the new hottest year ever in 2007, he made the comment,
SO WITH Africa and South America insignificant, America experiencing it’s warmest decade ever (reinserting the 2 degrees that the Hansen team erased), and now we add the Indian sub-continent having heat waves. I bet they had hot weather in Europe, but I’m not going to look.
I have a point. The point is where was the cold place during the 1930’s?
The indians have always had this problem with extreme weather. Their housing and infrastructure are so poor that they need a ‘goldilocks’ temperature to avoid any deaths at all. A temperature between about 65°F and 105°F either side and deaths start to occur. Unfortunately, every year, just before the monsoon, the temperature starts to rise in the north towards 40°C and then on to 45°C. It is what creates the monsoon.
It’s all that CO2 they keep exhaling..
I thought the new MEME was CO2 / global warming causes cold ? Or is that just when its winter ?
Meanwhile, all of Western Europe except Scandinavia (especially the Arctic part) is “enjoying” an unusually cold May (after a record setting cold March) – with cold records being set for e.g. Paris. See for instance: http://www.english.rfi.fr/europe/20130526-frances-spring-coldest-1987