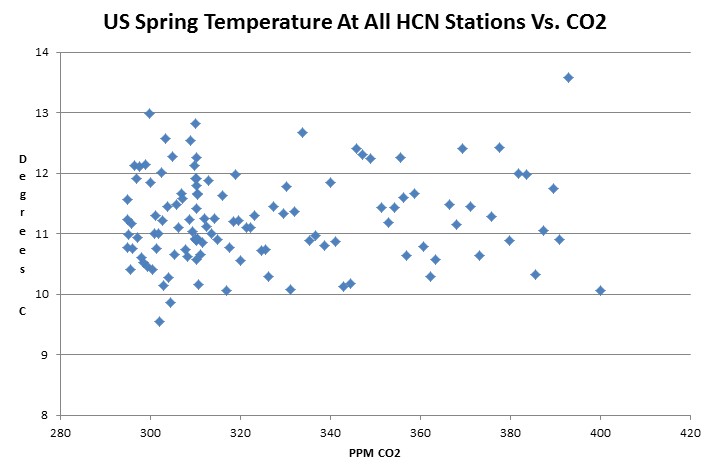
At 400 PPM CO2, the US just had the coldest spring since CO2 was 304 PPM. The second hottest US spring occurred when CO2 was below 300 PPM.
Disrupting the Borg is expensive and time consuming!
Google Search
-
Recent Posts
- Drought In The Headwaters Of Lake Powell
- Unrealistic Expectations Of Water Availability
- Did Bill Gates Do This?
- Worst March Drought On Record In The US
- The Real Hockey Stick Graph
- Analyzing The Western Water Crisis
- Gaslighting 1924
- “Why Do You Resist?”
- Climate Attribution Model
- Fact Checking NASA
- Fact Checking Grok
- Fact Checking The New York Times
- New Visitech Features
- Ice-Free Arctic By 2014
- Debt-Free US Treasury Forecast
- Analyzing Big City Crime (Part 2)
- Analyzing Big City Crime
- UK Migration Caused By Global Warming
- Climate Attribution In Greece
- “Brown: ’50 days to save world'”
- The Catastrophic Influence of Bovine Methane Emissions on Extraterrestrial Climate Patterns
- Posting On X
- Seventeen Years Of Fun
- The Importance Of Good Tools
- Temperature Shifts At Blue Hill, MA
Recent Comments
- Hank Phillips on Seventeen Years Of Fun
- Hank Phillips on Did Bill Gates Do This?
- Scott Allen on Drought In The Headwaters Of Lake Powell
- conrad ziefle on Unrealistic Expectations Of Water Availability
- Gordon Vigurs on Did Bill Gates Do This?
- Bob G on Did Bill Gates Do This?
- conrad ziefle on Did Bill Gates Do This?
- Bob G on Did Bill Gates Do This?
- Jack the Insider on The Real Hockey Stick Graph
- scott allen on Worst March Drought On Record In The US


This is an excellent way to show how ‘well’ temperature correlates with CO2…
When C3 plants evolved…CO2 levels crashed…..temperatures went up
…When C4 evolved….CO2 levels crashed again…..temperatures went up again
Forgot to change the axis title. It’s “CO2 ppm” not “year”
And now for the 6PM Solar System news with CO2 > 400ppm. Pretty cool.
http://www.youtube.com/watch?v=D7lEQ4GX0Fg