I think I am becoming a Freezing Alarmist. If we hit an ice age, all bets are so off. Bet hedgers would want to be ahead of the game. What better cover than to claim it is getting warmer? After all, if people knew things were going to freeze over, we would see some, um, problems. Flaming cities. Terrified crowds the size of entire states. I’m glad I live on a coastline, it’s not the rising seas but rampant glaciation comin to getcha.
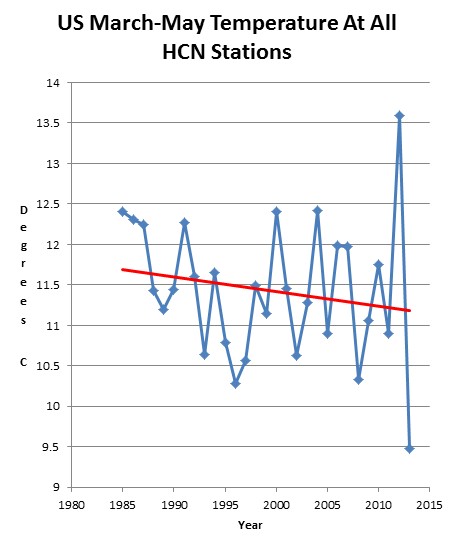
April #’s out from NCDC and it sure looks like they may have pulled another March upward adjust that’s to big. With such a large percentage of the nation at average to below average it just seems like a high number. http://www.ncdc.noaa.gov/cag/
ND broke its April record for coldest, and SD had #2, and MN had #3 for coldest.


The oscillation that happened in the last two years is really impressive. I believe it’s a “step-change” in the downward direction, similar to what happened in ~ 2000 and ~ 2008 (in connection with the ENSO system),
http://www.climate4you.com/images/NOAA%20SST-Nino3-4%20GlobalMonthlyTempSince1979%20With37monthRunningAverage.gif
Spring this year in the UK has been comparatively worse, I believe.
Check out this story about SNOW today in the West Country:
http://www.dailymail.co.uk/news/article-2324803/UK-weather-Snow-falls-amid-65mph-winds-town-gets-month-rain-just-24-hours.html
I think I am becoming a Freezing Alarmist. If we hit an ice age, all bets are so off. Bet hedgers would want to be ahead of the game. What better cover than to claim it is getting warmer? After all, if people knew things were going to freeze over, we would see some, um, problems. Flaming cities. Terrified crowds the size of entire states. I’m glad I live on a coastline, it’s not the rising seas but rampant glaciation comin to getcha.
Ice ages are caused by Global Warming.
Ummm no. They’re caused by solar/lunar/Earth axial tilt cycles
April #’s out from NCDC and it sure looks like they may have pulled another March upward adjust that’s to big. With such a large percentage of the nation at average to below average it just seems like a high number.
http://www.ncdc.noaa.gov/cag/
ND broke its April record for coldest, and SD had #2, and MN had #3 for coldest.
In averaging the states, the number is 49.76 with the national number recorded as 49.68.That’s pretty close. Last month was way off, though.
It would be really helpful if you could link to the raw data used to create this graph.
ftp://ftp.ncdc.noaa.gov/pub/data/ghcn/daily/hcn/