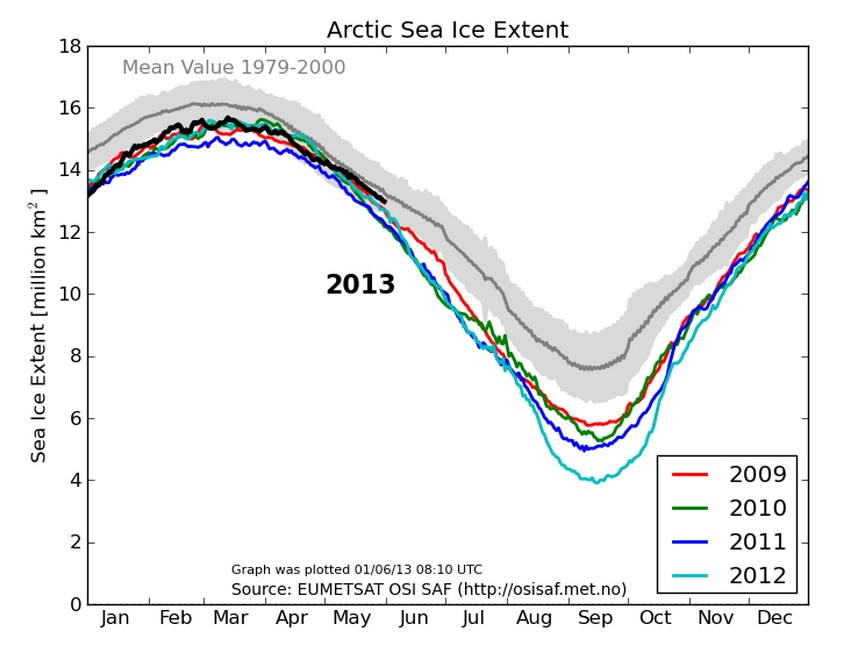
Following the link, one discovers that this is a revised chart. The original chart can be found, “for a time,” at the link. The two charts differ and leave different impressions. What is going on here?
Ice evaporates without melting first. Most people have seen an old ice cube tray with shrinking ice cubes that were filled months before.
Climate experts assume lay people are gullible and will think the Arctic ice thinning is from global warming and it’s melting. But it is from lower water vapor due to global cooling, and the Arctic ice evaporates. Same with glaciers, until the next ice age.
See http://www.thenakedscientists.com/HTML/questions/question/1943/
I’m sure you realize that the alarmists don’t see a center “average” line – they’re only tracking the current values against that 2012 line, and as soon as this year’s value goes BELOW that “benchmark”, there will be headline news worldwide.
Might as well make them happy, and start posting the “anomaly” between those two. Otherwise they’ll only call you a denier.
You can also stop, every 250 miles and wait 4 hours for a charge. That should give you lots of time to figure out that even ice in the Arctic melts, stupid.


Following the link, one discovers that this is a revised chart. The original chart can be found, “for a time,” at the link. The two charts differ and leave different impressions. What is going on here?
They changed their methodology, but both show that Arctic ice is the highest in years.
Ice evaporates without melting first. Most people have seen an old ice cube tray with shrinking ice cubes that were filled months before.
Climate experts assume lay people are gullible and will think the Arctic ice thinning is from global warming and it’s melting. But it is from lower water vapor due to global cooling, and the Arctic ice evaporates. Same with glaciers, until the next ice age.
See http://www.thenakedscientists.com/HTML/questions/question/1943/
I’m sure you realize that the alarmists don’t see a center “average” line – they’re only tracking the current values against that 2012 line, and as soon as this year’s value goes BELOW that “benchmark”, there will be headline news worldwide.
Might as well make them happy, and start posting the “anomaly” between those two. Otherwise they’ll only call you a denier.
You can also stop, every 250 miles and wait 4 hours for a charge. That should give you lots of time to figure out that even ice in the Arctic melts, stupid.