
Disrupting the Borg is expensive and time consuming!

Google Search
-
Recent Posts
- One Atomic Bomb Per Hour
- New Video : Analyzing Oil And Gas
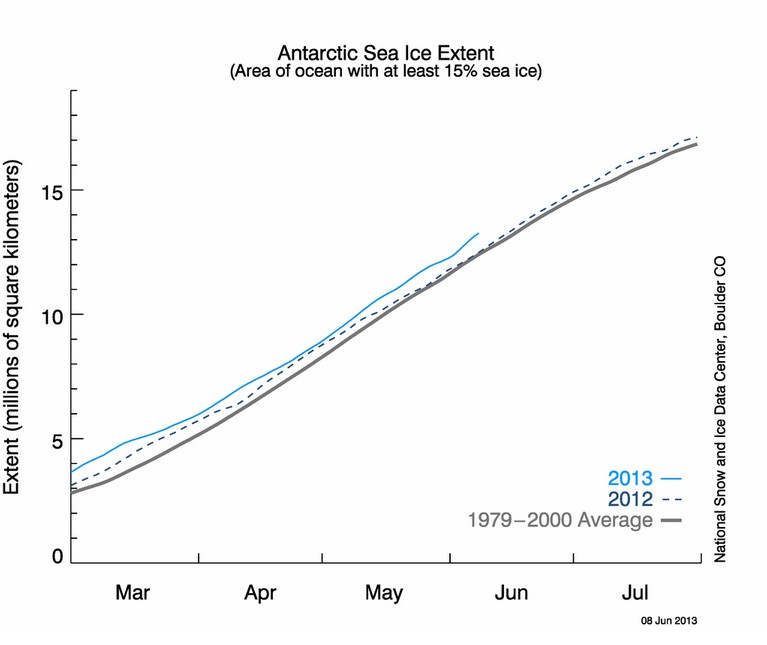
- Is Antarctica Melting?
- High Speed Analysis And Visualization
- El Nino To The Rescue?
- Fake News Update
- Growth Of Antarctic Sea Ice
- 65 Years Of Progress!
- El Nino To The Rescue?
- Worst March Drought On Record
- ChartGL Process Control Demo
- The Biggest Money Laundering Scam
- Drought In The Headwaters Of Lake Powell
- Unrealistic Expectations Of Water Availability
- Did Bill Gates Do This?
- Worst March Drought On Record In The US
- The Real Hockey Stick Graph
- Analyzing The Western Water Crisis
- Gaslighting 1924
- “Why Do You Resist?”
- Climate Attribution Model
- Fact Checking NASA
- Fact Checking Grok
- Fact Checking The New York Times
- New Visitech Features
Recent Comments
- Bob G on One Atomic Bomb Per Hour
- Bob G on One Atomic Bomb Per Hour
- Bob G on One Atomic Bomb Per Hour
- Jack the Insider on One Atomic Bomb Per Hour
- arn on One Atomic Bomb Per Hour
- Bob G on One Atomic Bomb Per Hour
- Bob G on One Atomic Bomb Per Hour
- Bob G on One Atomic Bomb Per Hour
- Hank Phillips on One Atomic Bomb Per Hour
- Hank Phillips on One Atomic Bomb Per Hour
The New Normal : Excess Sea Ice For The Penguins
This entry was posted in Uncategorized. Bookmark the permalink.
Penguins really don’t like excess sea ice. It’s not that they are alarmists and are looking forward to thermageddon but because it’s further to waddle from when you shoot out of the water and belly flop on to the ice to get to your nesting site.
Yeah and some Alarmist Twits are still claiming parts of Antarctica are melting 10X faster than the historic known norm!!
This is huge about Antarctic sea ice. And OT but important: Steven, I know you’ve done a lot of posts on the *near identical* rate of temperature change now and before the rise in CO2 (as during the 19th century and the first half of the 20th century compared to now). Now C3 has presented a great piece on the rate of change, with a powerful graphic.
View the graphic here: http://c3headlines.typepad.com/.a/6a010536b58035970c01901d26f85e970b-pi
And my comment just now in a jonova thread:
Baa Humbug, that is an OUTSTANDING graphic! Beyond no actual evidence at all of CO2 causing temperature change, what really casts doubt on the notion that CO2 has ANY effect on temps is the graphic you present. Clear as day. No change at all in the rate of temperature change despite CO2 having risen to “dangerous” levels.
Even many skeptics hold to the line that it is indisputable “established science” that CO2 has a direct greenhouse effect (GHE) of at least 1°C per doubling, and that it is only the feedbacks that are in question. But the chart you present clearly shows that the whole 9-yards should be in question. Barring all kinds of possible epicycle style explanations, the chart shows CO2 hasn’t done squat. CO2 has done… nothing.
As it is, there’s no empirical evidence that CO2 causes temp change: all that the warmists can point to is a theoretical model, but there are other theoretical models that maintain that CO2 won’t cause any temp change, for example, the one that posits that there is effectively no more GHE after 200ppm.
I saved that C3 link you gave as a favorite. We all should do the same.