You are almost qualified to be a Climate Chatterbot. All you have to do is sell your soul to the devil and remove half your brain and you too can be a useful idiot to the left.
Totally agree—I don’t understand that, either. Twelve years of data are not included in the mean value, which should lower the mean because of years like 2007 (e.g.).
Doing so would imply that this year’s values could be ABOVE the mean value. Oh, wait. That wouldn’t look good for the warmists, now, would it?
Nature was in perfect equilibrium in 1979 (must have been Jimmy Carter’s influence). Since then ice can only melt, it can no longer freeze. At least that is what the lunatic left believes.

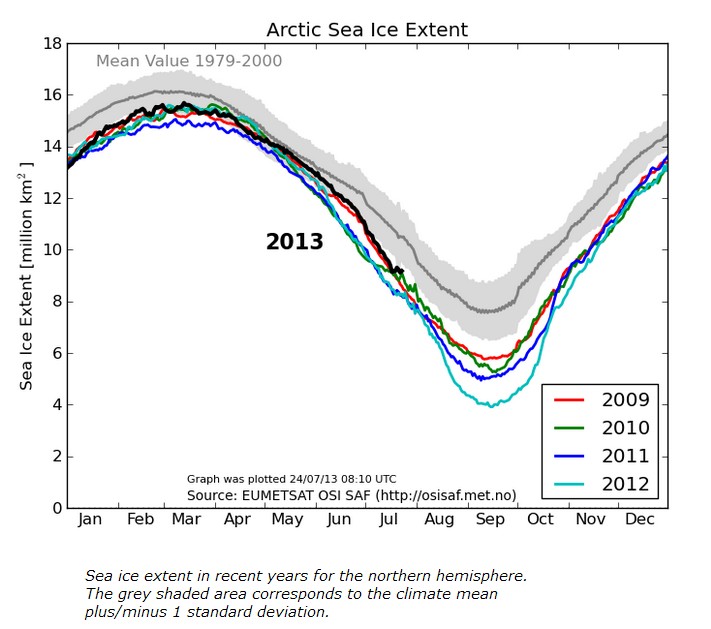


Well that’s only extent, not thickness and weather and then the hole and….. blah blah blah. Let me show you my graphs. Blather Blather Blather.
Brad,
You are almost qualified to be a Climate Chatterbot. All you have to do is sell your soul to the devil and remove half your brain and you too can be a useful idiot to the left.
Working on it. 🙂
May I be so kind to catergize Brad in the mephistophelian syndrome.
Why do they go with 1979-2000 mean value? Why not use mean value to present date?
Totally agree—I don’t understand that, either. Twelve years of data are not included in the mean value, which should lower the mean because of years like 2007 (e.g.).
Doing so would imply that this year’s values could be ABOVE the mean value. Oh, wait. That wouldn’t look good for the warmists, now, would it?
Nature was in perfect equilibrium in 1979 (must have been Jimmy Carter’s influence). Since then ice can only melt, it can no longer freeze. At least that is what the lunatic left believes.
Hey Lou! You are working my side of the street again. 😉
The alarmists need some heavy duty adjusting of the data or maybe even super Reggie and his blow torch.
They are probably picking up the flotilla of alarmist boats.
If you take out the wind in 2012….there’s absolutely nothing to see
Very different numbers here: http://arctic.atmos.uiuc.edu/cryosphere/arctic.sea.ice.interactive.html
They have a lot of problems this time of year distinguishing surface melt from open water.
Ok… good point
Ignorance is bliss, especially when trying to make sense out of Arctic ice satellite data.