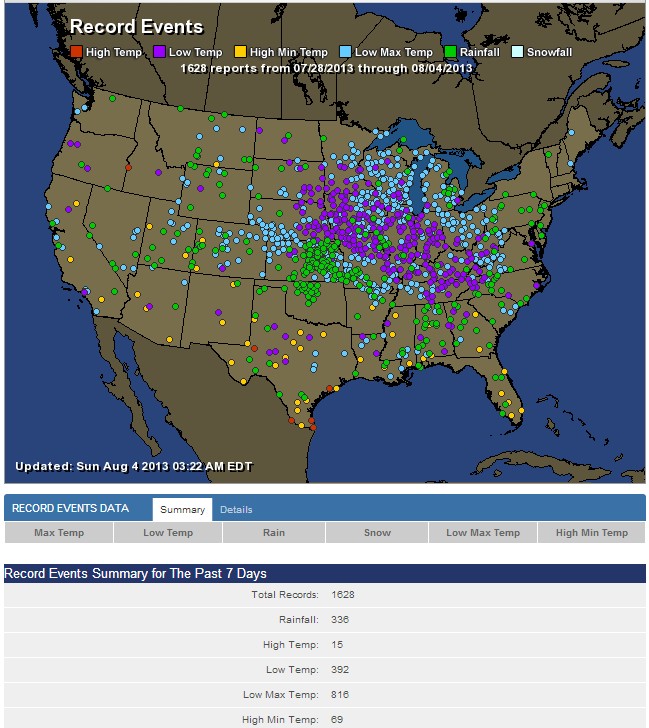
Last year, alarmists loved this statistic. This year, they completely forgot about it.
Disrupting the Borg is expensive and time consuming!
Google Search
-
Recent Posts
- Bullseye!
- It’s Getting Closer
- Greenland Meltdown Scam
- Greenland Ice Update
- Wyoming Gold
- Three Years Since The Apocalypse
- Arctic Report card Summer 2026
- Elon Pushing Pushing Geoengineering
- Earth, Wind And Fire
- On The Road Again
- Vandalism At The Reflecting Pool
- Fifty Years Ago Today
- Truth Or Consequences
- US Climate Trend Maps
- Declining Spring Snow Cover In Northern New Mexico
- You Can’t Fool Mother Nature
- Cattle And The Climate
- One Atomic Bomb Per Hour
- New Video : Analyzing Oil And Gas
- Is Antarctica Melting?
- High Speed Analysis And Visualization
- El Nino To The Rescue?
- Fake News Update
- Growth Of Antarctic Sea Ice
- 65 Years Of Progress!
Recent Comments
- Stuart Hamish on Three Years Since The Apocalypse
- Stuart Hamish on Cattle And The Climate
- Bob G on Bullseye!
- conrad ziefle on Bullseye!
- arn on Greenland Ice Update
- D. Boss on Bullseye!
- scott allen on Bullseye!


Steven, do you know of a source that tabulates the number of record highs vs record lows for the entire summer and for the entire year?
As everyone on this blog is fully aware, the media consistently report record highs as “climate change”, and record lows (if reported at all) as just “weather”. So, what is the statistical trend?

The high temp in Idaho is suspect. Lows on either side.
Probably had the thermometer next to a frying pan.